
Summary:
- Broadcom’s stock price surged 30% due to AI advancements and industry optimism, prompting a reevaluation of its valuation using a reverse DCF model.
- Market-implied revenue growth for Broadcom is higher than our projections, driven by strong Networking segment performance and VMWare acquisition.
- Despite intensified competition from Nvidia, Broadcom’s AI-related chip growth and software integration with VMWare support a Strong Buy rating.
- A revised DCF analysis with a higher EV/EBITDA of 29.02x, reflecting Broadcom’s hybrid business model, indicates the stock has tremendous upside.
Sundry Photography
In our previous analysis of Broadcom, Inc. (NASDAQ:AVGO), we highlighted that positive investor sentiment, seen in valuation ratios contributed significantly to stock price outperformance, alongside factors such as AI advancements and industry optimism. We maintained our revenue forecast, considering robust Semicon segment growth from AI networking products.
In this current analysis, we revisit the company following the 30% increase in its stock price since our previous coverage, and we examine whether the company’s stock might be overvalued. We construct a reverse DCF model to calculate the market-implied revenue growth, profitability margins, and terminal value. First, we analyze the market-implied revenue growth in comparison with our forecasts and analysts’ consensus, determining whether the forecasts remain appropriate by focusing on the latest developments in the semicon and software segments. Additionally, we analyze the market-implied operating margins compared to our forecasts and explain any significant differences through expense analysis. Finally, we analyze the market-implied terminal value compared to our forecasts and assess whether it is appropriate by examining semicon chipmakers’ EV/EBITDA multiples.
Market Implied Revenue Growth Higher Than Our Projections
First, we analyze the market-implied revenue growth in comparison with our forecasts and analysts’ consensus, determining whether the forecasts remain appropriate by focusing on the latest developments in the semicon and software segments. We construct a reverse DCF model below, holding our assumptions for profitability and terminal value constant from our previous analysis to derive the market-implied revenue growth.
Company Data, Khaveen Investments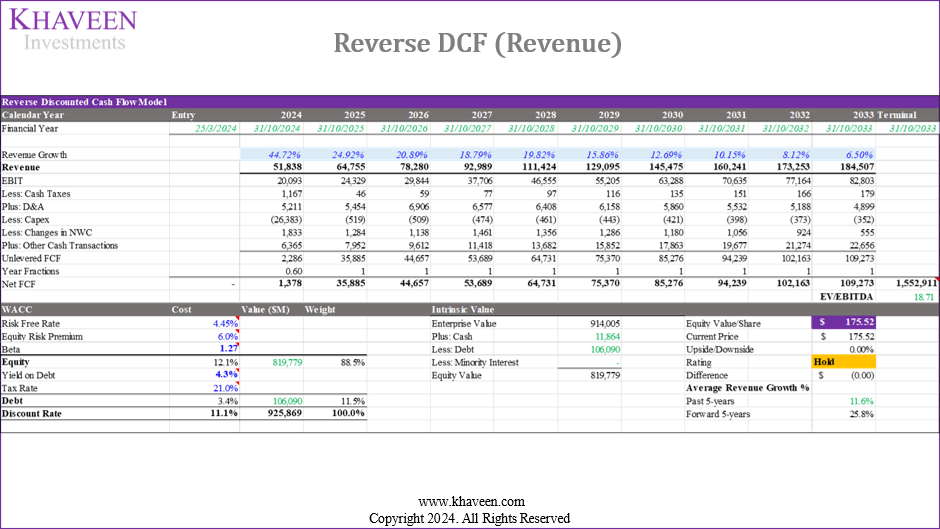
|
Revenue Comparison ($ mln) |
2024F |
2025F |
2026F |
2027F |
2028F |
2029F |
2030F |
2031F |
2032F |
2033F |
Average (5-yr) |
Average (10-yr) |
|
Revenue (Reverse DCF) |
51,838 |
64,755 |
78,280 |
92,989 |
111,424 |
129,095 |
145,475 |
160,241 |
173,253 |
184,507 |
– |
– |
|
Growth % YoY |
44.72% |
24.92% |
20.89% |
18.79% |
19.82% |
15.86% |
12.69% |
10.15% |
8.12% |
6.50% |
25.83% |
18.25% |
|
Revenue (Our Previous Forecast) |
51,208 |
62,419 |
71,884 |
83,816 |
94,205 |
103,546 |
111,760 |
118,852 |
124,886 |
128,382 |
– |
– |
|
Growth % YoY |
42.96% |
21.89% |
15.17% |
16.60% |
12.39% |
9.92% |
7.93% |
6.35% |
5.08% |
2.80% |
21.80% |
14.11% |
|
Revenue (Analysts’ Consensus) |
51,597 |
60,493 |
67,909 |
– |
– |
– |
– |
– |
– |
– |
– |
– |
|
Growth % YoY |
44.05% |
17.24% |
12.26% |
– |
– |
– |
– |
– |
– |
– |
– |
– |
Source: Seeking Alpha, Khaveen Investments
Based on the table above, we obtained the market implied revenue growth for Broadcom through 2033 at a 5-year forward average of 25.8%, which is slightly higher compared to our forecasts at a forward average of 21.8%. Additionally, we derived the market average of 18.3% in the 10-year forward period, higher than our projected average of 14.11%. Compared to analysts’ consensus for the forward 3 years, the 2024 forecasts of 44.05% is close to our projection and the market implied growth, but the 2025 and 2026 analysts’ consensus is slightly lower than our projection and the market implied growth.
In our previous analysis, we forecasted Broadcom’s growth by its segment breakdown in terms of semicon and Infrastructure Software segments. For the semicon segment, we forecasted the growth to be primarily driven by the strong growth in its Networking segment at a 5-year average of 22.5% followed by its other semicon segments such as Storage, Wireless, Broadband, and Industrial. Moreover, we forecasted its software revenue growth primarily driven by its VMWare acquisition at a forward average of 27% beyond 2024. We examine the company’s latest developments to determine whether its strong growth could remain stable.
Networking Segment Developments and Competitiveness
We believe the Networking business of Broadcom’s semicon segment continues to be the key driver for Broadcom’s growth, we had forecasted it to grow 46.6% in 2024 accounting for management’s past guidance for its AI revenues to double in 2024. Broadcom is expected to release a new Ethernet switch chip, Tomahawk 6, following the releases of Trident 5 this year and Jericho chips in 2023. We compiled and updated our comparison of its chips against competitors Nvidia, Cisco and Marvell below based on their latest chips to compare their specifications.
Company Data, Khaveen Investments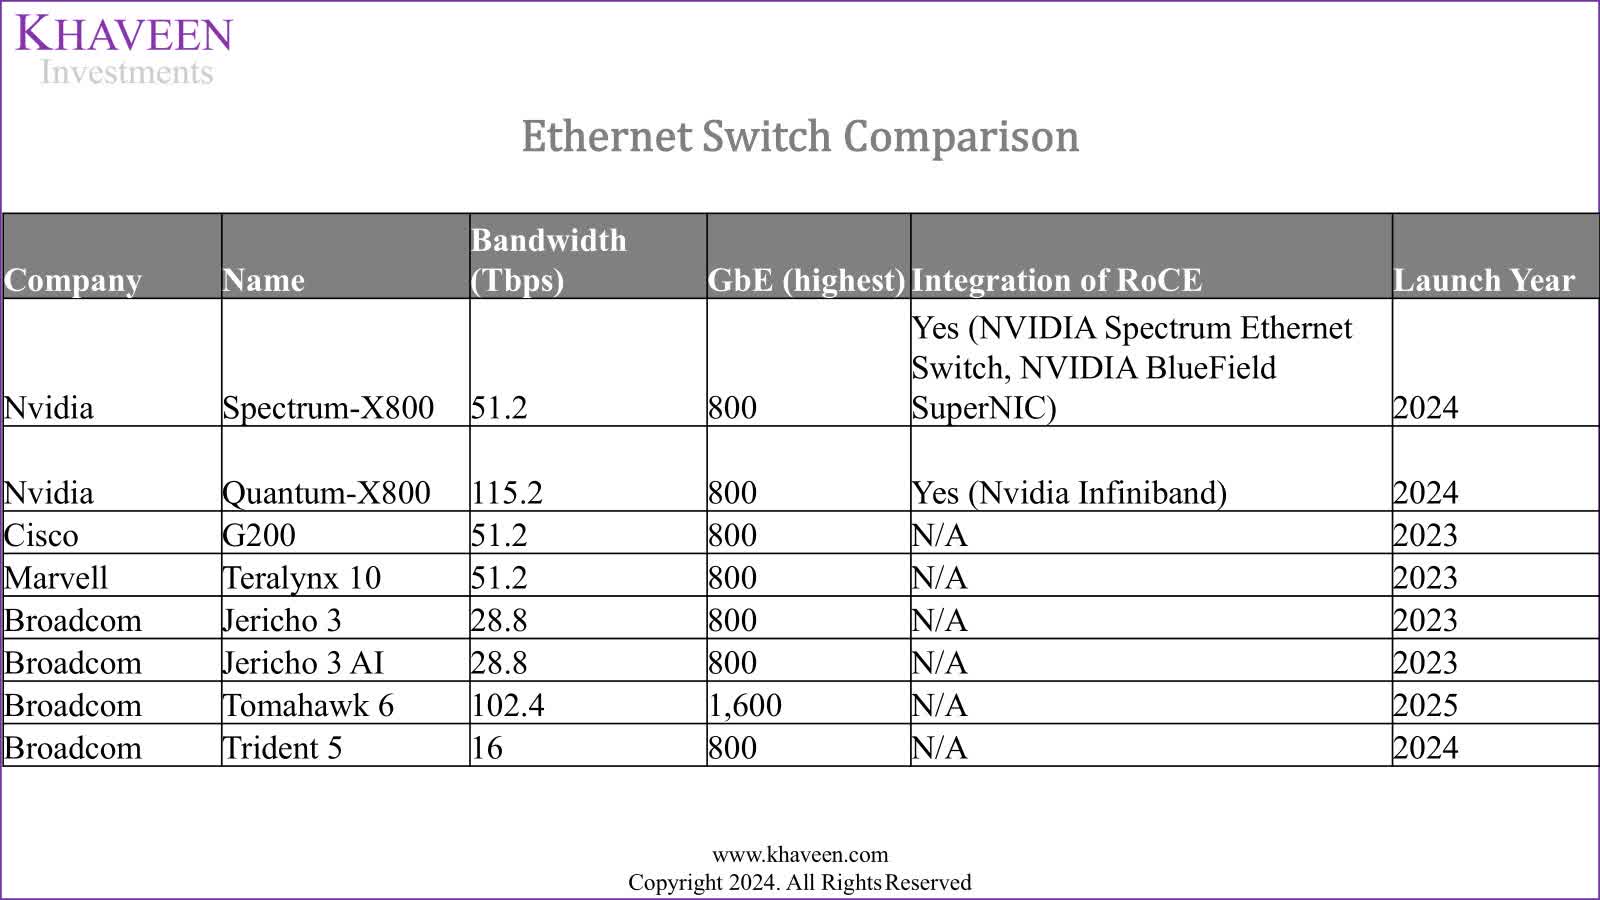
Based on the table above, Tomahawk 6 chip shows a big increase in bandwidth to 102.4 Tbps, double that of the Tomahawk 5. The new Tomahawk chips also have a much higher bandwidth and aggregate GbE compared with Jericho and Trident. Tomahawk is targeted towards HPC in data centers compared to Trident for enterprise networks and Jericho for telecommunication service provider networks. Compared with Cisco (CSCO) and Marvell (MRVL), Broadcom’s Tomahawk 6 is superior in terms of specifications. On the other hand, Nvidia’s (NVDA) new Spectrum X800 chip is slightly better than Tomahawk in terms of Bandwidth compared to Tomahawk 6, though Tomahawk 6 has double the GbE compared to Nvidia, indicating that Nvidia’s chip has a higher bandwidth speed but lower capacity of traffic. Though, another advantage of Nvidia is the integration of Nvidia InfiniBand, which is a high-performance networking used for data centers and high-performance computing. Furthermore, “InfiniBand is a low latency owing to an architecture that reduces packet loss”, which is positive for enabling higher bandwidth. On the other hand, Broadcom adopts an open standard via Ultra Ethernet Consortium to challenge Nvidia InfiniBand. Moreover, we compiled the market share of the Networking revenues of Broadcom, Nvidia, and Marvell below.
Company Data, Khaveen Investments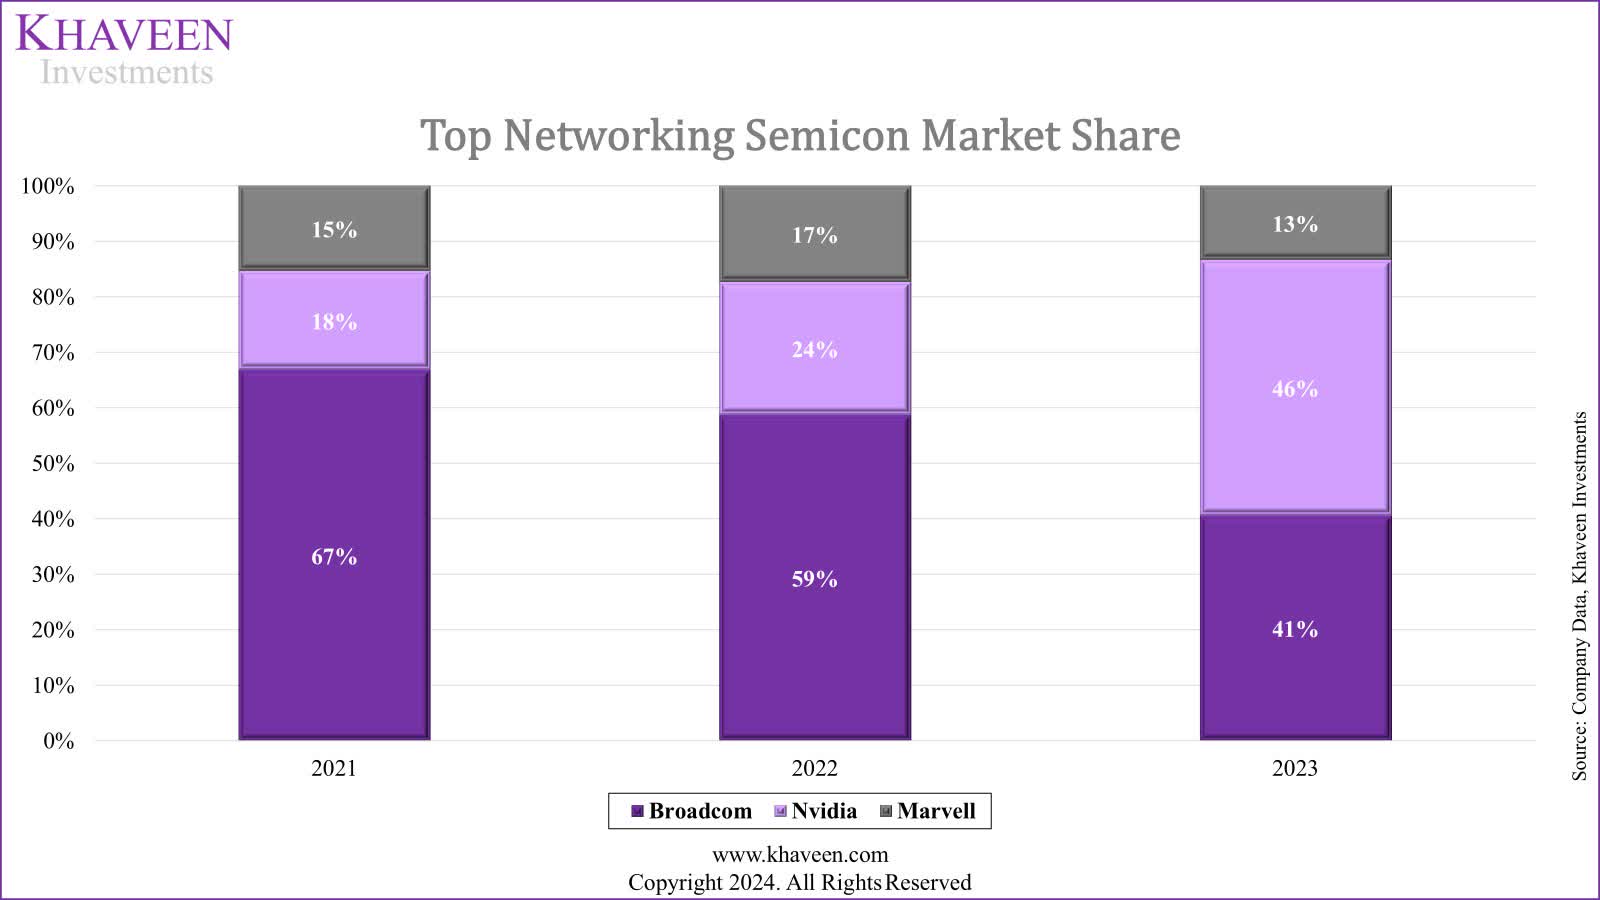
Nvidia’s market share has surged, almost doubling alone in 2023 with a higher share than Broadcom, which it had previously dominated. In our past analysis, we highlighted Nvidia’s surging growth driven by its data center GPUs which are fundamental for cloud infrastructure to support AI. We believe the growth of Nvidia’s data center GPUs boded well for the demand for its networking solutions. Despite that, Dell’Oro stated that AI systems account for less than 10% of the total market, with 90% using Nvidia/Mellanox’s InfiniBand which indicates the remaining 10% using Ethernet solutions such as those from Broadcom. Therefore, we still expect Broadcom to capitalize on the rise of AI infrastructure despite the dominance of Nvidia’s InfiniBand. Also, Broadcom highlighted in its latest earnings briefing the strong growth in the Ethernet switch business, “driven by Tomahawk 5 and Jericho3-AI grew over 4 times year-on-year”. In its previous quarter’s earnings call, management highlighted “close collaboration with partners like Arista Networks, Dell, Juniper, and Supermicro” and “seven of the largest eight AI clusters in deployment today use Broadcom Ethernet solutions”, which indicates positive developments. Additionally, management highlighted in the latest briefing, the strong growth in networking semicon in Q3 2024 by 43% YoY and cited “strong demand from hyperscalers for both AI networking and on custom AI accelerators”.
DAO Semicon Recovery
Moreover, we then examined the company’s semicon segment performance in Q3 2024 YTD YoY and compared it with our previous full-year growth projections as we previously anticipated the company’s semicon segment growth besides Networking to remain sluggish with a recovery only expected in the next year.
|
Semicon Segment Revenue ($ mln) |
Q1 2024 |
Q2 2024 |
Q3 2024 |
Q3 2024 YTD |
4-year Historical Average |
Our Previous Full Year Forecast |
|
Networking |
3,326 |
4,082 |
4,001 |
11,408 |
16,024 |
|
|
Growth (YoY %) |
46.2% |
53.7% |
44.1% |
48% |
16.3% |
46.6% |
|
Storage |
887 |
847 |
800 |
2,534 |
4,044 |
|
|
Growth (YoY %) |
-30.7% |
-26.8% |
-32.2% |
-30% |
20.0% |
-17.0% |
|
Wireless |
1,995 |
1,694 |
1,673 |
5,363 |
7,337 |
|
|
Growth (YoY %) |
-3.2% |
8.2% |
0.4% |
1% |
8.4% |
0.0% |
|
Broadband |
961 |
770 |
582 |
2,313 |
3,660 |
|
|
Growth (YoY %) |
-20.5% |
-37.1% |
-47.6% |
-35% |
15.2% |
-12.5% |
|
Industrial |
222 |
308 |
218 |
748 |
938 |
|
|
Growth (YoY %) |
-22.0% |
50.8% |
4.8% |
7% |
5.0% |
-2.5% |
|
Total |
7,390 |
7,702 |
7,274 |
22,366 |
31,065 |
|
|
Growth (YoY %) |
4.0% |
13.1% |
4.8% |
7% |
13.2% |
9.8% |
Source: Company Data, Khaveen Investments
Based on the table above, the company’s revenue growth in Q3 2024 YTD for its total semicon segment was fairly in line with our forecasts. Its Q3 growth was fairly in line with the Networking segment, Industrial and Wireless. However, its growth in the Storage and Broadband segments continued to remain weak with growth in Q3 2024 YTD lower compared to our full-year forecasts. This is as the company highlighted in its briefing that “Broadband remains weak on the continued pause in telco and service provider spending” but is expected to bottom out in the second half and recover in 2025. Whereas in Storage, the company’s management highlighted a potential bottom in Q3 2024 and expects recovery onwards. In Industrials, management guided for Q4 to decline by “approximately 20%”. Overall, we believe we continue to expect a more meaningful recovery for its semicon segments in 2025 and beyond as its growth in Q3 2024 YTD remains sluggish, but management’s positive guidance reaffirms our previous expectations for a recovery next year.
Overall, we believe the company continues to face growth headwinds in the rest of its semicon segments in Storage, Wireless, Broadband, and Industrial. On the one hand, the semicon market is projected to recover with strong growth of 16% YoY and reach $611 bln in 2024, however, the Analog market is expected to decline by single digits. This is as we previously analyzed the DAO market outlook this year facing sluggish growth headwinds due to a slowdown in Industrial and Automotive end markets with slowing industrial output growth and oversupply of automotive chips due to overproduction of automotive vehicles in 2023, which we expect both to gradually recover in H2 2024 onwards which is a delayed recovery compared to Logic and Memory markets which are projected to grow positively this year.
Software Growth
|
Revenue By Segments ($ mln) |
Q1 2024 |
Q2 2024 |
Q3 2024 |
Q3 2024 YTD |
Our Previous Full Year Forecast |
|
Semiconductor Solutions |
7,390 |
7,702 |
7,274 |
22,366 |
31,065 |
|
Growth (YoY %) |
4.0% |
13.1% |
4.8% |
7.2% |
9.8% |
|
Infrastructure Software |
4,571 |
5,285 |
5,798 |
15,654 |
20,295 |
|
Growth (YoY %) |
152.8% |
174.5% |
199.6% |
176.2% |
165.7% |
|
Total |
11,961 |
12,987 |
13,072 |
38,020 |
51,359 |
|
Growth (YoY %) |
34.2% |
48.7% |
47.3% |
43.3% |
43.0% |
|
VMware Revenue |
2,100 |
2,700 |
3,800 |
8,600 |
12,000 |
|
Infrastructure Software (Excluding VMWare) |
2,471 |
2,585 |
1,998 |
7,054 |
8,295 |
|
Growth (YoY %) |
34.3% |
3.3% |
24.5% |
8.6% |
Source: Company Data, Khaveen Investments
Furthermore, in terms of the company’s software segment, its total growth in Q3 2024 YTD has been in line with our expectations for the full year of growth, primarily driven due to the revenue contribution of VMWare. However, the company’s total software revenue excluding VMware (including Brocade, Symantec, and CA) grew robustly by 24.5% YoY in Q3, surpassing our full-year forecasts. Based on management in its earnings briefing, the growth was attributed to Brocade mainly (estimated 21% of software revenue) following a decline of 9% in 2023 as management highlighted the cyclicity of enterprise spending which impacts its growth and also and affirmed that its current growth is sustainable.
Furthermore, for the company’s VMWare acquisition, management disclosed its revenues increased to $2.7 bln, a rise of 29% QoQ compared to $2.1 bln in Q1. However, this falls short of our full-year forecasts of $12 bln based on management guidance. However, the company highlighted that is still undergoing its restructuring and highlighted that it is “making good progress in transitioning all VMware products to a subscription licensing model” and that 30% of its customers had been signed up for multi-year contracts while its annualized booking value surged from $1.2 bln to $1.9 bln in Q2. If we assume its VMWare segment growth maintains through Q4, we calculated its VMWare revenue to reach $13 bln, higher compared to our forecast which was based on management guidance previously. Additionally, management also noted that Q3 “infrastructure software segment revenue of $5.8 billion was up 200% year-on-year driven by $3.8 billion in revenue contribution from VMware”.
Therefore, we believe our growth projections could be lower compared to the market implied growth also due to its strong performance in the software segment, which surpassed our expectations in Q3 2024 YTD for its legacy software business mainly due to Brocade. Thus, we believe the market may be expecting its strong growth to continue, but we highlighted the cyclicity of its growth which could moderate going into the second half of the year and finish the year closer in line with our forecasts based on long-term growth. Furthermore, we believe VMWare strong growth could be another factor as we previously based our forecast on management guidance, we now expect it could reach $13 bln based on its Q3 2024 YTD performance amid its transitioning strategy to subscription.
Outlook
|
Broadcom Projections ($ mln) |
2023 |
2024F |
2025F |
2026F |
2027F |
2028F |
|
Networking |
10,934 |
16,024 |
18,991 |
22,669 |
26,833 |
31,494 |
|
Growth % YoY |
21.0% |
46.6% |
18.5% |
19.4% |
18.4% |
17.4% |
|
Storage |
4,872 |
4,044 |
4,777 |
5,597 |
6,500 |
7,485 |
|
Growth % YoY |
11.0% |
-17.0% |
18.1% |
17.1% |
16.1% |
15.1% |
|
Wireless |
7,337 |
7,337 |
8,082 |
8,821 |
9,540 |
10,222 |
|
Growth % YoY |
-2.0% |
0.0% |
10.15% |
9.1% |
8.1% |
7.1% |
|
Broadband |
4,183 |
3,660 |
4,034 |
4,407 |
4,770 |
5,115 |
|
Growth % |
8.0% |
-12.5% |
10.24% |
9.2% |
8.2% |
7.2% |
|
Industrial |
962 |
938 |
985 |
1,025 |
1,055 |
1,077 |
|
Growth % |
-6.8% |
-2.5% |
5.0% |
4.0% |
3.0% |
2.0% |
|
Total Semicon |
28,288 |
31,065 |
35,884 |
41,494 |
47,643 |
54,316 |
|
Growth % |
9.6% |
9.8% |
15.5% |
15.6% |
14.8% |
14.0% |
|
Core Software |
7,637 |
8,295 |
9,027 |
9,843 |
10,756 |
11,778 |
|
Growth % |
3.4% |
8.6% |
8.8% |
9.0% |
9.3% |
9.5% |
|
Virtualization (VMWare) |
12,991 |
19,003 |
22,848 |
28,866 |
32,739 |
|
|
Growth % |
46.3% |
20.2% |
26.3% |
13.4% |
||
|
Total Broadcom (With VMWare) |
35,925 |
52,350 |
63,914 |
74,185 |
87,266 |
98,833 |
|
Growth % |
8.2% |
45.7% |
22.1% |
16.1% |
17.6% |
13.3% |
Source: Company Data, Khaveen Investments
All in all, we maintain our revenue projections from our previous analysis with an update to our 2024 forecasts due to the higher VMWare revenues that we prorate to reach $13 bln compared to $12 bln previously which was based on management guidance, resulting in a higher projected growth rate in 2024 at 45.7% compared to 43% previously. Furthermore, due to increased revenues of VMWare in our forecast which we projected to grow at a strong growth rate compared to its total revenues, this results in our revised forecast being slightly higher in 2024 onwards compared to our previous forecasts, at a 5-year forward average of 23% compared to 21.8% previously. Despite that, our revised growth forecasts are still slightly lower in comparison with the -market-implied growth at a forward average of 25.8%. We believe our growth relatively conservative forecasts may be more appropriate given risk factors such as the intensified competition within the Networking segment which had caused the company to lose its dominant market position and market share to key competitor Nvidia which, we believe, has a performance-advantage supported by its InfiniBand technology, as well as growth headwinds within the DAO semicon market which continues to pose growth headwinds amid end market weaknesses across industrial and automotive markets. However, another reason for our computed market-implied growth may be our margins or terminal value being lower than the -market-implied figures. Thus we examine the company further using our reverse DCF focusing on margins and terminal value.
High Market Implied Margins
Moreover, we analyze the -market-implied operating margins in comparison with our forecasts to determine and explain any significant differences between our projections using expense analysis. We computed our reverse DCF model below, holding our assumptions for revenue growth and terminal value constant from our previous analysis to derive the -market-implied margins.
Company Data, Khaveen Investments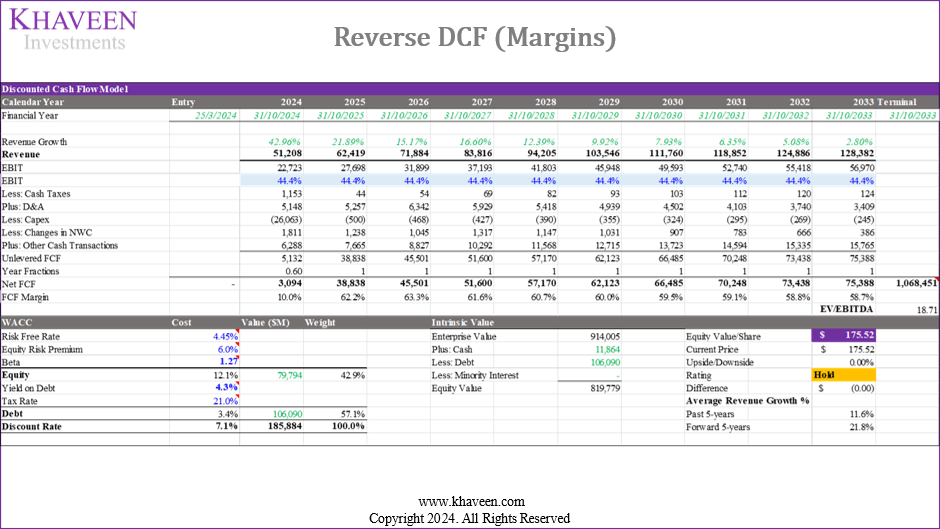
|
Comparison (5-year Forward) |
EBIT Margin |
FCF Margin |
|
Reverse DCF |
60.85% |
68.04% |
|
Our Previous Analysis |
37.91% |
42.72% |
Source: Company Data, Khaveen Investments
Compared to the calculated market-implied EBIT and FCF margins, our previous forecasts for EBIT and FCF margins were lower by around 6.5% and 8.8%, respectively. To determine whether our forecasts are too conservative, we examine the company’s Q3 YTD performance using the expense analysis below and compare it with our full-year forecasts.
Revised Projections
We revised our margin projections for the company from our previous analysis as we restated the company’s financials. The main restatement involves COGS and gross profit, whereby we factored in the total amortization expenses of the company by subtracting it from the total gross profit, in comparison to our previous model which did not subtract amortization expenses from gross profits. Additionally, we restated our calculations for the company’s COGS expenses, which are obtained by subtracting total D&A and restated gross profits.
In terms of our projections for the company’s COGS, we based our forecast for 2024 on its Q3 2024 YTD % of revenue of 23.57%. Beyond 2024, we forecast COGS to improve as management indicated that it expects its AI-related revenues to scale up as it grows rapidly and lead to operating margin expansion, and management previously guided for “operating margins for VMware to begin to converge towards that of classic Broadcom software by fiscal 2025” following the integration of VMWare, as its segment reported operating margin decline by 14% in H1 compared to 2023. We calculated a weighted average increase in margins of 7.1% in 2025 followed by an average increase of 1.2% per year based on the company’s 5-year average increase.
Furthermore, for Depreciation and Amortization, we account for the amortization of intangible assets according to management’s estimates of amortization expenses through 2028 based on the company’s quarterly report, in addition to depreciation expense based on TTM of $693 mln per year.
Additionally, we adjusted our assumption SG&A and R&D based on its Q3 2024 YTD % of revenue in 2024 and beyond. This is as we highlighted the company’s SG&A has declined lower than what we had previously forecasted, which was based on a weighted average of Broadcom’s and VMWare’s SG&A before the acquisition, as the company implemented SG&A integration with VMWare, which we believe led to better SG&A % of revenue. For R&D in 2024 and going forward, we based it on its Q3 2024 YTD % of revenue figure, higher than we previously forecasted which was also based on a weighted average R&D spending of Broadcom and VMWare, as we believe the company’s robust product developments for Networking contribute to the higher R&D spending.
For other non-operating expenses, we based this company’s TTM of $2.9 bln, for a full-year forecast of 3.29%. However, from 2025 onwards, we calculated an assumption of 1.87% of revenue factoring in management guidance from its earnings briefing for the integration costs to “stabilize at $1.2 billion post-integration”. Additionally, we adjusted our interest forecast assumption based on its 5-year average net interest % of debt of 3.12% and total long-term debt of $70 bln. In total, we modeled the company with an average 5-year forward EBIT and a net margin of 34.9% and 23.4% respectively through 2028.
|
Expense Analysis (% of revenue) |
Q3 2024 YTD |
Our Previous 2024 Restated |
|
Revenue |
100.00% |
100.00% |
|
COGS (excluding D&A) |
23.57% |
23.80% |
|
Depreciation & Amortization |
19.72% |
10.05% |
|
Gross Profit |
56.71% |
66.14% |
|
Research and Development |
18.86% |
16.57% |
|
Selling, General and Administrative |
9.85% |
13.77% |
|
Other Expenses (Income) |
0.00% |
0.00% |
|
Earnings Before Interest & Taxes (EBIT) |
28.00% |
35.81% |
|
Interest |
-8.09% |
-3.48% |
|
Other non-operating expenses (income) |
3.51% |
2.95% |
|
Earnings Before Tax |
16.40% |
29.37% |
|
Tax (% of EBT) |
68.10% |
7.67% |
|
Net Earnings |
5.37% |
27.12% |
|
Minority Interests |
1.32% |
0.00% |
|
Net Earnings to Shareholders |
4.05% |
27.12% |
Source: Seeking Alpha, Khaveen Investments
Based on the table above, we restated our previous full-year 2024 forecast assumptions and compared them with the actual Q3 YTD results of the company. As seen, its margins underperformed in Q3 YTD compared to our previous restated full-year forecasts. This is mainly due to lower gross margins by 10% due to the difference in D&A, while COGS is in line. Furthermore, the company’s EBIT margins are also lower due to lower gross margins, while the decline in SG&A was offset by the rise in R&D. Its tax expenses as % of EBT was 68.10%, mainly due to the relocation of IP to the US. This is as in the Q3 2024 quarterly report, the company highlighted that they had recognized a “discrete tax provision of $4,522 million during the fiscal quarter ended August 4, 2024, from the establishment of a deferred tax liability as a result of the book and tax basis difference on these transferred IP rights”. Moreover, its EBT was also weighed down by higher interest. Therefore, we focused on the company’s D&A, operating expenses, other non-operating expenses and interest expenses below.
D&A
Based on the table above, Broadcom’s Q3 2024 YTD D&A % of revenue is significantly higher than our full-year forecast D&A % of revenue, mainly due to an increase in the Amortization of Intangible and ROU assets after acquiring VMware. For Q3 2024 YTD YoY, Amortization of Intangible and ROU assets increased from $2,525 mln in Q3 2023 YTD to $6,962 mln in Q3 2024 YTD, representing a 176% increase YoY, mainly due to an increase in Intangible Assets following VMware acquisition. After completing the acquisition in Q4 2023, Broadcom’s Intangible Assets increased substantially from $20,833 mln in Q4 2023 to $66,978 mln in Q3 2024 as Broadcom integrates VMware’s Technology and Customer Contracts and Related Relationships into its books. Thus, as a result of increased Intangible Assets from acquiring VMware, Broadcom’s Amortization expense is higher, leading to a 10% D&A % Revenue difference compared to our previous forecast.
Operating Expenses (R&D and SG&A)
Based on the chart above, Q3 2024 YTD R&D % of revenue was 18.86%, which was slightly higher than our full-year forecast R&D % of revenue of 16.57%. Based on its Q2 2024 earnings briefing, management highlighted increased investment in R&D for its semicon business segment. This is as we highlighted the company’s product launches for its Networking products, such as the upcoming Tomahawk 6 chip in 2025.
Furthermore, Q3 2024 YTD SG&A % of revenue was 9.85%, an increase from 4.4% in Q3 2023 YTD, due to the impact of its acquisition with “higher compensation, including higher stock-based compensation, as a result of an increase in headcount from the VMware Merger”, but lower than our forecasts which we accounted for. We believe the difference could to due to the company’s management highlighting that it had “integrated SG&A across the entire platform and eliminated redundant functions” of VMWare.
Other Non-Operating Expenses
Based on the chart above, Q3 2024 Other Expenses (Income) % of revenue of 17.9% was significantly higher than our full-year forecast of 11.67%, mainly due to Q3 2024 YTD’s $3.9 bln VMware spending run rate as well as restructuring and integration costs. During its Q2 2024 Earnings Call, management highlighted that “year to date, we have incurred about $2 billion of restructuring and integration costs and drove our spending run rate at VMware to 1.6 billion this quarter from what used to be 2.3 billion per quarter pre-acquisition”. Furthermore, management highlighted in Q3 that they “brought VMware spending down to $1.3 million in Q3 from $1.6 million in Q2”.
Interest Expenses
Furthermore, the company’s interest expenses were higher in Q3 2024 YTD, as its quarterly report mentioned that the “increases were primarily due to interest on debt incurred for the VMware Merger”. In our previous forecasts, we accounted for higher interest expenses at 6% of revenue in 2025 in our forecasts.
Outlook
Company Data, Khaveen Investments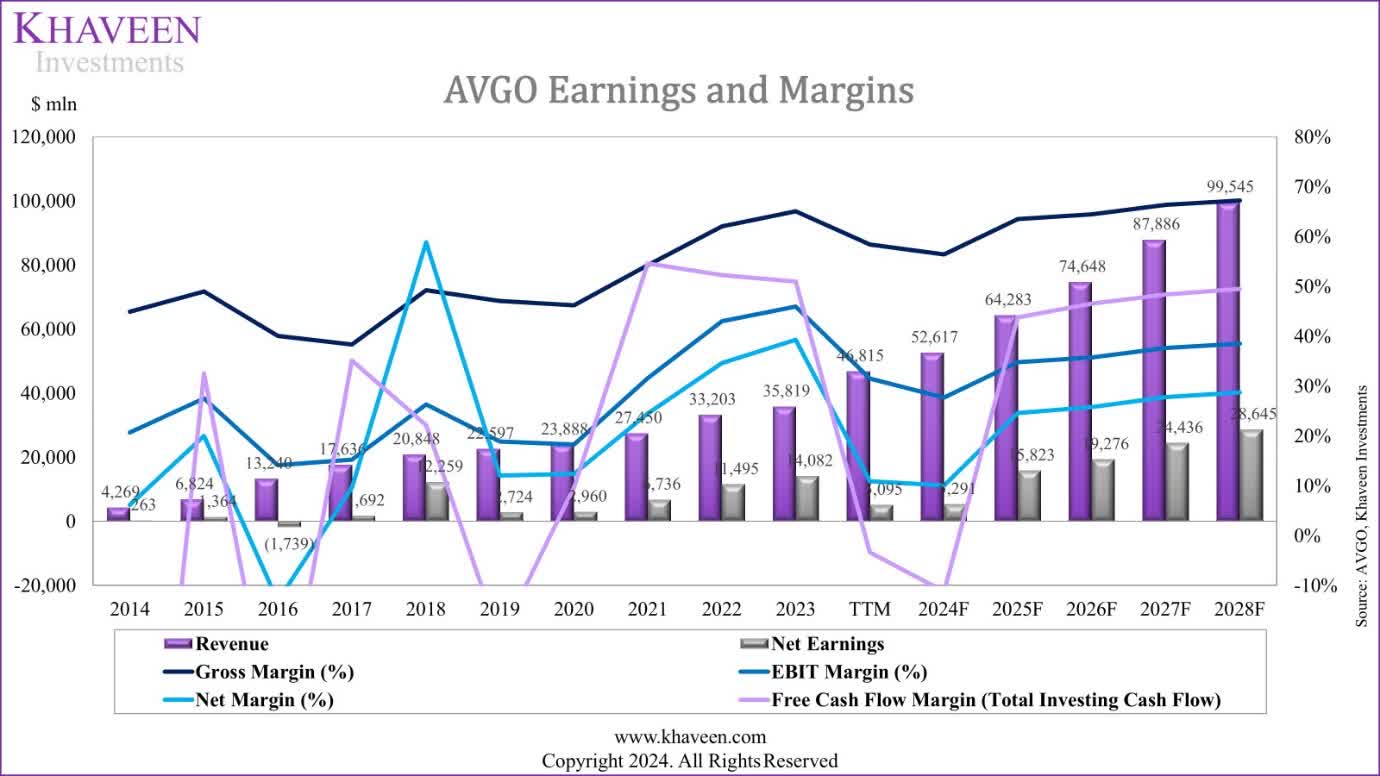
Compared to the market-implied EBIT margin, our latest forecast for its EBIT margin is lower at a 5-year average of 34.9%. The main reason for the decline in 2024 margins is due to the acquisition of VMWare, resulting in higher amortization of intangible assets, as well as other factors such as higher R&D spending. However, in the next year onwards, we expect a gradual improvement in its margins due to the lower estimated amortization expenses for the year based on its quarterly report as well as margin improvement between its semicon and software segments as it scales up its AI-related revenues and integration of the VMWare business. Notwithstanding, our modeled margins are still significantly lower compared with the market-implied margins. We believe this indicates the market may not have fully accounted for the impact of the acquisition of VMWare on its margins which had led to a decline to 25% in H1 2024 compared to 45% in the previous year due to additional expenses related to the acquisition such as amortization of intangibles and integration costs related to its expenses, which we have accounted for in our forecasts, resulting in the lower margins in 2024. Additionally, we believe that the market might be optimistic about the company’s margins growth, as management indicated it expects semicon margins to rise as AI scales up and software margins to improve as the company integrates VMWare. However, we had already accounted for this in our projections as we estimated an increase in semicon margin based on its 5-year average of 1.3% which, we believe, is fair as the company’s semicon reported operating margin declined by 3% in 2023, indicating its AI revenues has not yet reached scale, whereas, for Software, we had based our assumption that management achieves to increase to software margin back to 2023 levels of 73.8% and a forward average increase of 2% per year based on its historical average. One of the reasons for the higher implied margins from our DCF model could be that we fixed the revenue growth based on our projections, which are lower compared to the market implied growth estimates as mentioned in the first point.
Higher Market Implied Valuation Multiple
Finally, we analyze the market implied terminal value in comparison with our forecasts and determine whether it is appropriate by analyzing semicon chipmakers’ EV/EBITDA multiples. We compute a reverse DCF model below, holding our assumptions for profitability and revenue growth constant from our previous analysis, to derive the market-implied terminal value and EV/EBITDA.
Company Data, Khaveen Investments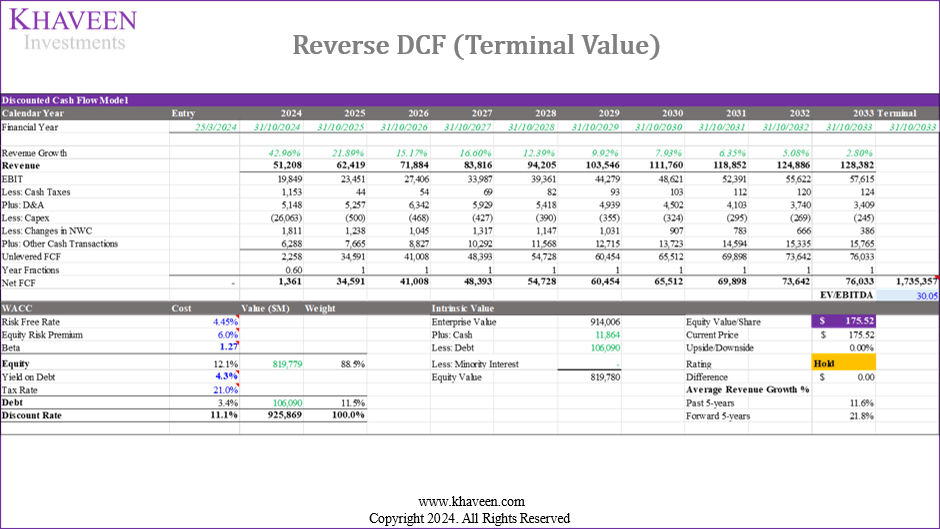
|
Comparison |
Terminal Value ($ mln) |
EV/EBITDA |
|
Reverse DCF |
1,735,357 |
30.05x |
|
Our Previous DCF |
1,141,999 |
18.71x |
Source: Company Data, Khaveen Investments
We calculated the market’s terminal value to be $1.735 tln, significantly higher by $593,358 mln compared to our previous terminal value of $1.141 tln. This is primarily due to a higher EV/EBITDA (30.05x) in the Reverse DCF model, compared to our previous EV/EBITDA of 18.71x. Previously, we based the EV/EBITDA on the 5-year average of US-only chipmakers, excluding companies with a CAGR above 20%. To determine the appropriate EV/EBITDA for the valuation, we updated our EV/EBITDA multiples comparison from our previous analysis of Nvidia.
Seeking Alpha, Investing.com, Khaveen Investments 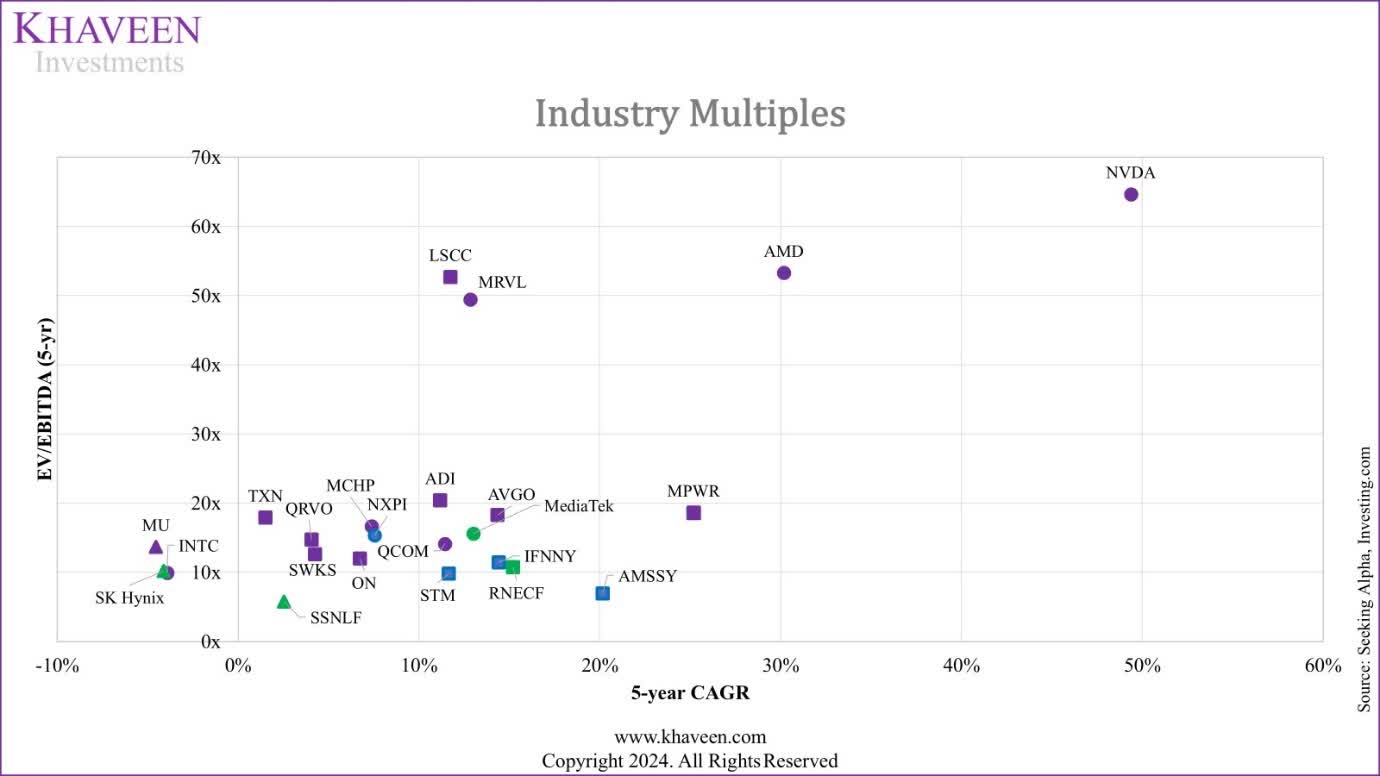
Geographic Location
|
EV/EBITDA and CAGR Comparison |
EV/EBITDA (5-yr) |
5-year Revenue CAGR |
|
US Only |
26.47x |
11.18% |
|
European Only |
10.90x |
13.44% |
|
Asian Only |
10.59x |
6.65% |
|
Overall |
20.75x |
10.77% |
Source: Company Data, Khaveen Investments
Based on the chart above, US-only companies have the highest EV/EBITDA multiples on a 5-year average of 26.47x. Additionally, US Only companies’ EV/EBITDA multiples are significantly higher than European Only (10.90x) and Asian Only (10.59x). Despite this, US Only companies’ 5-year CAGR of 11.18% is lower than European Only companies’ 5-year CAGR of 13.44% by around 2%. As a US company, we believe Broadcom justifies a higher EV/EBITDA multiple if not accounting for differences in growth rates between European Only and Asian Only CAGR.
Semicon Submarket
|
EV/EBITDA and CAGR Comparison |
EV/EBITDA (5-yr) |
5-year Revenue CAGR |
|
Logic |
34.52x |
16.54% |
|
DAO |
16.90x |
10.01% |
|
Memory |
9.90x |
-2.04% |
Source: Company Data, Khaveen Investments
Based on the chart above, Logic-focused companies have the highest 5-year EV/EBITDA at 34.52x. Additionally, Logic companies’ EV/EBITDA multiples are significantly higher than DAO companies by 17x and Memory companies by 24x, likely due to a higher 5-year Revenue CAGR of 16.54%.
Company Data, Khaveen Investments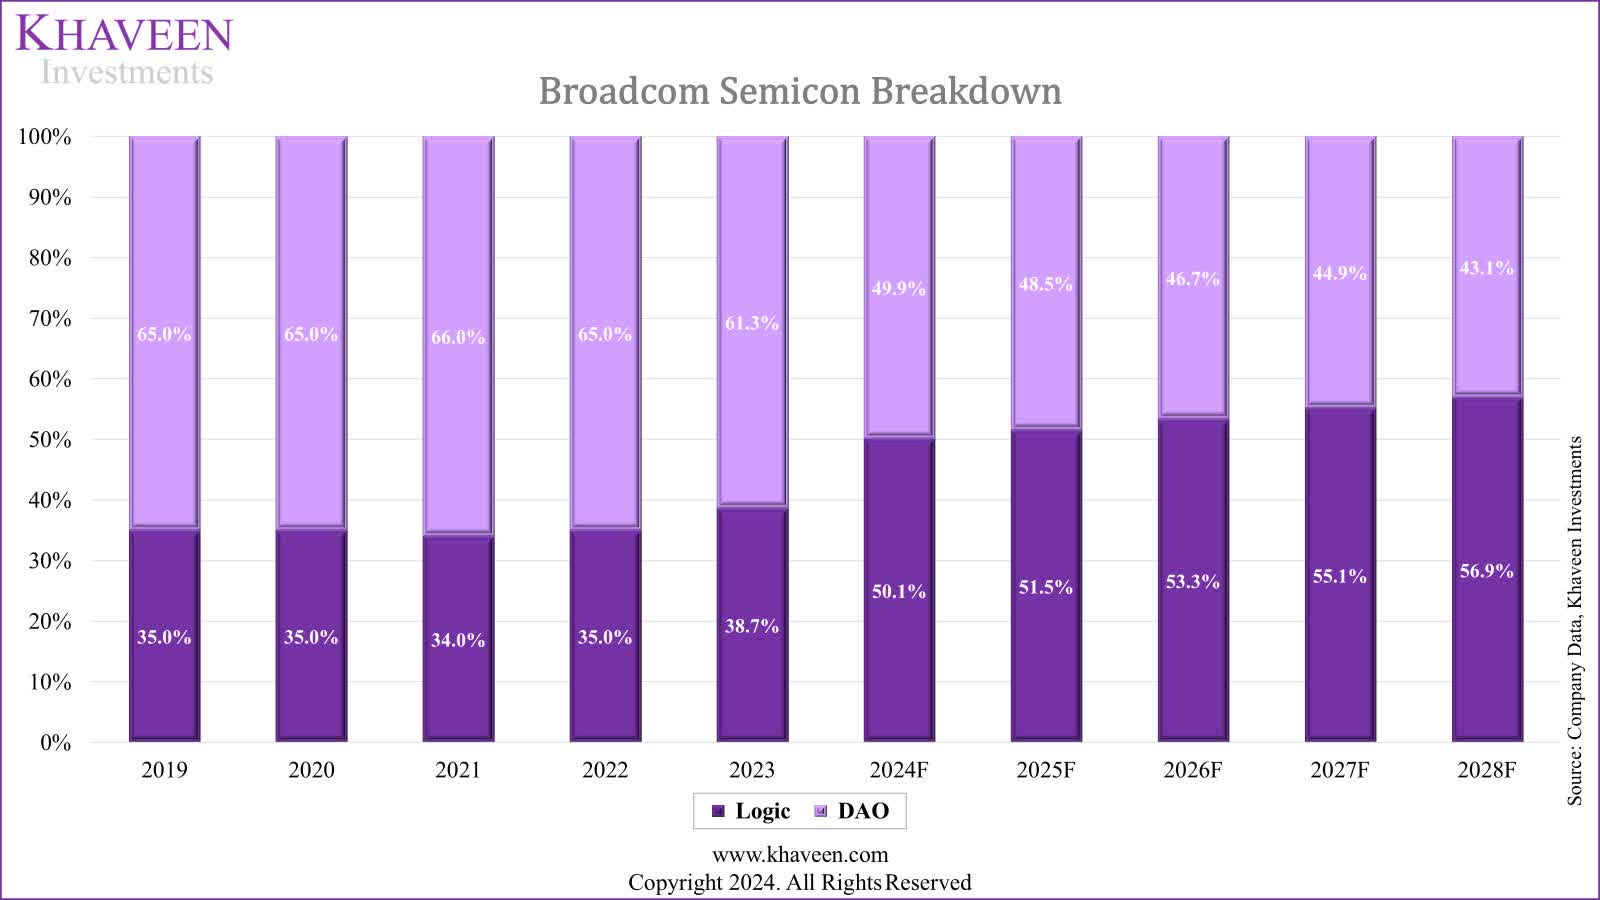
Broadcom, which we previously categorized as a DAO company, has an increasing share of revenues from the Logic segment through 2023, and in 2024, based on our revenue forecasts, we expect it to account for 50.1% of its total revenues from Logic and rising gradually to 57% by 2028 due to the strong growth of its Networking segment which involves logic-related Ethernet chips and ASICs. We previously categorized Broadcom as a DAO company, though it has an increasing share of revenues from the Logic segment through 2023. In 2024, based on our revenue forecasts, we expect it to account for 50.1% of its total revenues from Logic and rise gradually to 57% by 2028 due to the strong growth of its Networking segment which involves logic-related Ethernet chips and ASICs. We calculated a weighted average EV/EBITDA of 25.73x for Broadcom based on our full-year 2024 forecast of its revenue breakdown between Logic (50.1%) and DAO (49.9%).
Growth
|
EV/EBITDA and CAGR Comparison |
EV/EBITDA (5-yr) |
5-year Revenue CAGR |
|
Higher Growth (20%+) |
41.65x |
33.23% |
|
Medium Growth (10% to 20%) |
22.51x |
11.58% |
|
Low Growth (0% to 10%) |
13.59x |
4.41% |
|
Negative Growth (<0%) |
11.29x |
-4.20% |
Source: Company Data, Khaveen Investments
Based on the table above, Higher Growth (20%+) companies have both the highest 5-year EV/EBITDA valuation at 41.65x and 5-year Revenue CAGR at 33.23%. In comparison, Broadcom has a 5-year CAGR of 14.33%. However, we forecasted Broadcom’s 5-year forward average growth at 23% including 2024. Excluding 2024, our forward average growth forecast for it is 17.3%. Therefore, we believe the company falls within the medium growth category (10% to 20%) based on its past growth and our average forecast growth. Finally, we calculated a weighted average EV/EBITDA of 24.69x for the company based on its revenue breakdown between software and semicon revenues.
Semicon vs Software Average
We compiled the top 30 software companies by revenue and compared their average multiple with the semicon chipmakers weighted average between Logic and DAO based on Broadcom’s breakdown. However, for software companies, we excluded companies with over 150 EV/EBITDA (5-yr) multiples as extreme outliers that would increase the average significantly.
|
Industry |
Average EV/EBITDA (5-yr) |
5-year Revenue CAGR |
Broadcom 2024 Breakdown Forecast % |
|
Semicon Chipmaker (DAO and Logic) |
25.79x |
11.39% |
59.34% |
|
Software |
33.75x |
14.85% |
40.66% |
|
Weighted Average |
29.02x |
13.82% |
100% |
Source: Company Data, Khaveen Investments
Based on the chart above, software companies’ average EV/EBITDA (5-yr) of 33.75x is substantially higher than semicon chipmakers’ average EV/EBITDA (5-yr) of 25.79x. This is because the Software companies have a higher average 5-year CAGR of 14.85% compared to semicon’s average of 11.39%. Overall, we calculated a weighted average EV/EBITDA in terms of software (33.75x) and semicon (25.79x) average based on its revenue exposure, with the semicon average EV/EBITDA based on a weighted average between our derived Logic and DAO breakdown, this results in an EV/EBITDA multiple of 29.02x.
Outlook
|
Factor |
EV/EBITDA |
Explanation |
|
Market Implied |
27.77x |
Reverse-DCF Model |
|
Geographic |
26.47x |
US Only |
|
Semicon Submarket |
25.73x (Weighted Average) |
Weighted average of Logic and DAO revenue breakdown against Logic and DAO companies EV/EBITDA (5-yr) |
|
Growth |
22.51x |
Medium Growth (10% to 20%) |
|
Industry (Semicon vs Software) |
29.02x (Weighted Average) |
Weighted average of semicon and software revenue breakdown against semicon and software companies EV/EBITDA (5-yr) |
|
Our Previous Assumption (Updated) |
21.05x |
Updated EV/EBITDA from the previous assumption and removed companies with CAGR >20% |
Source: Company Data, Khaveen Investments
Based on the chart above, compared to our previous EV/EBITDA assumption (updated), all EV/EBITDA multiples based on Geographic, Semicon Submarket, Growth, and Industry factors are higher than our previous assumption. However, compared to the -market-implied multiple, only the industry factor EV/EBITDA is higher than the -market-implied EV/EBITDA of 29.02x but only slightly. Overall, we believe that the most appropriate multiple to use for the valuation is the weighted average Industry multiple of 29.02x, despite being the highest, as Broadcom now has a large exposure (40% of revenues) to the software industry that has a higher average EV/EBITDA average. Moreover, our forecasts show its software revenues rising further to 45% of the total by 2028 due to the strong potential growth of VMWare. This is also closer to the market-implied multiple of 27.77x as well as the company’s current FWD multiple of 27.74x. In comparison, our previous assumption is also lower as it includes the average of Memory semicon chipmakers which is 62% lower than our weighted average DAO and Logic average multiple (25.73x), which, we believe, is not reflective as Broadcom purely operates in the Logic and DAO market segments. Overall, we believe the appropriate multiple to be based on the weighted average of the company’s revenue exposure to semicon and software markets (29.02x), reflecting its hybrid business model as a semicon and software company, which is 62% higher than our previous assumption used (18.71x) based on semicon only.
Risk: Competition Within Networking
We believe the key risk for the company lies in its Networking segment, the largest segment of Broadcom’s semicon business, which still accounts for 60% of its total revenues following the VMWare acquisition. We highlighted the intensified competition threats from Nvidia, which has taken the lead over Broadcom in the networking semicon market, as we believe its InfiniBand architecture provides it with a performance advantage compared to Broadcom. Additionally, we believe Marvell could pose competition for Broadcom with the upcoming next-gen Teralynx chip, expected to be released in 2025 based on a 2-year launch cycle.
Valuation
Company Data, Khaveen Investments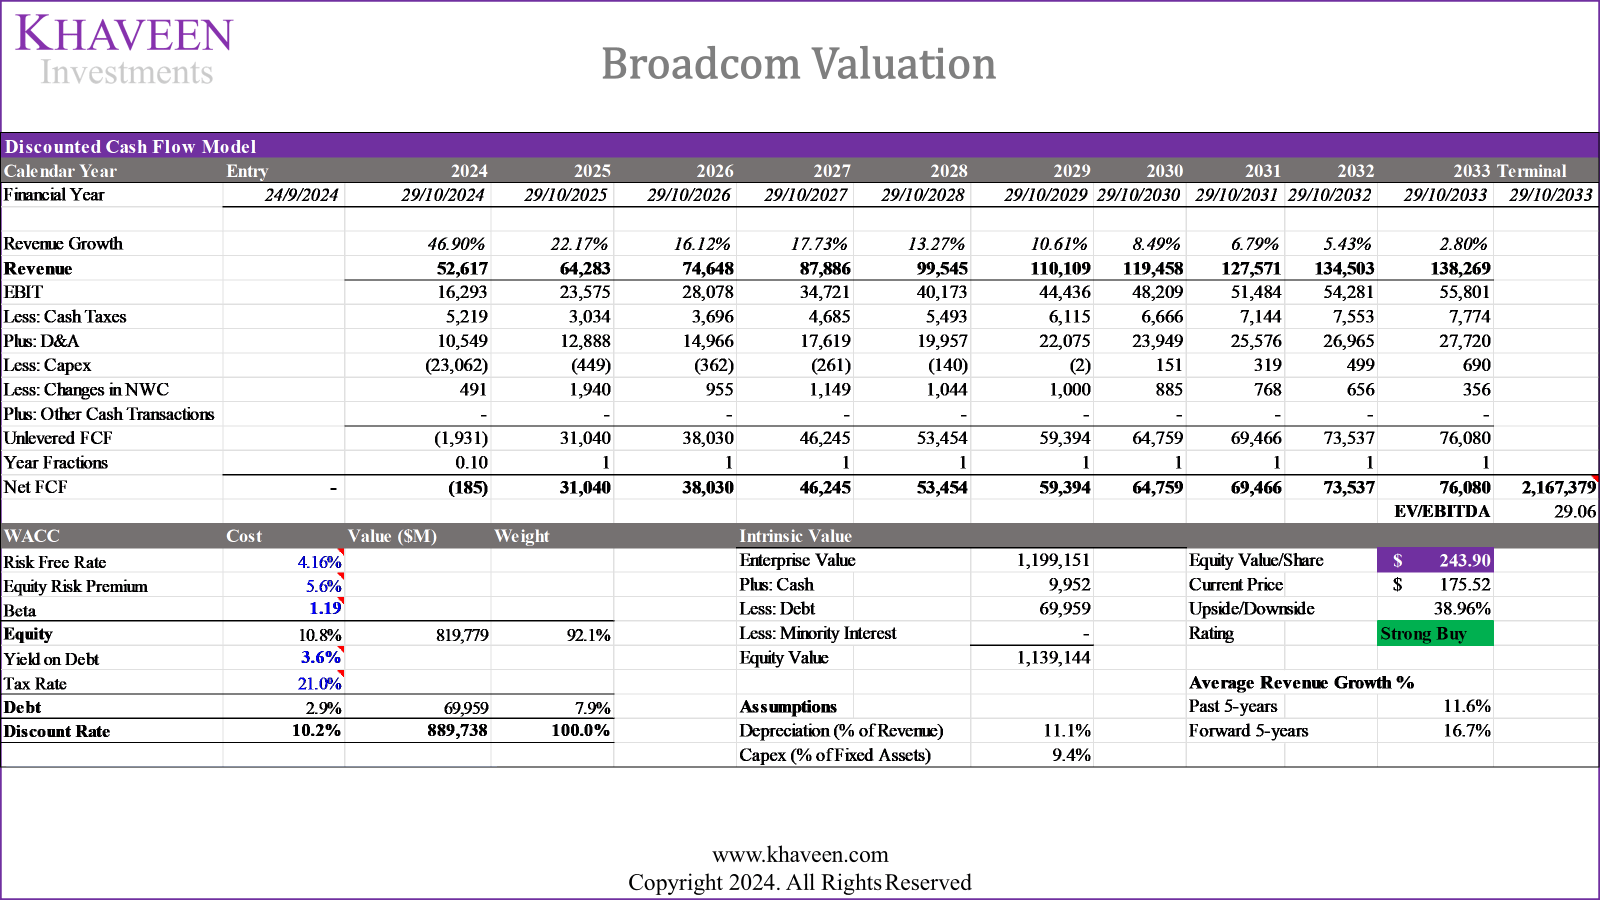
For our updated valuation, we moderately adjusted our forecasts for its revenue growth based on our expectations for higher VMWare at $13 bln as well as lower 5-year forward net margins of 23.4% vs 31.5% previously. However, the main difference is our terminal value based on a weighted average EV/EBITDA of 29.0x as discussed in the third point, resulting in an overall upside of 33.8%.
Verdict
All in all, we believe our revenue forecasts for Broadcom remain appropriate with a 5-year forward average of 23% (including 2024) as we expect its semicon growth to capitalize on AI-related chip growth in its Networking segment despite intensifying competition from Nvidia, as well as a strong growth outlook for its software business following the integration with VMWare. Additionally, we expect the company’s profitability, which had been impacted following the VMWare acquisition, to improve going forward as integration costs moderate and amortization gradually decreases, with an overall 5-year forward EBIT and net margin average of 34.9% and 23.4% respectively. To sum it up, we believe that the company is not overvalued, with a more appropriate valuation multiple based on our derived weighted average of 29.06x based on its breakdown between semicon and software revenues to reflect the company’s business model as a semicon and software company, with a rising proportion of sales from software (40% of revenues). Overall, we upgraded Broadcom to a Strong Buy based on our revised DCF analysis mainly due to a higher EV/EBITDA of 29.02x which is 62% higher than 18.71x, which was based solely on the overall US-only semicon market. Overall, we upgraded Broadcom to a Strong Buy based on our revised DCF analysis mainly due to a higher EV/EBITDA of 29.02x which is 62% higher than 18.71x, which was based solely on the overall US-only semicon market.
Analyst’s Disclosure: I/we have a beneficial long position in the shares of AVGO either through stock ownership, options, or other derivatives. I wrote this article myself, and it expresses my own opinions. I am not receiving compensation for it (other than from Seeking Alpha). I have no business relationship with any company whose stock is mentioned in this article.
No information in this publication is intended as investment, tax, accounting, or legal advice, or as an offer/solicitation to sell or buy. Material provided in this publication is for educational purposes only, and was prepared from sources and data believed to be reliable, but we do not guarantee its accuracy or completeness.
Seeking Alpha’s Disclosure: Past performance is no guarantee of future results. No recommendation or advice is being given as to whether any investment is suitable for a particular investor. Any views or opinions expressed above may not reflect those of Seeking Alpha as a whole. Seeking Alpha is not a licensed securities dealer, broker or US investment adviser or investment bank. Our analysts are third party authors that include both professional investors and individual investors who may not be licensed or certified by any institute or regulatory body.