Summary:
- Strong Buy Rating with a fair price of $2,428.45 and a 2029 target of $4,773.98, indicating 30.8% annual returns.
- Q2 2024 Earnings Beat: Broadcom exceeded expectations with a non-GAAP EPS of $10.96 and revenue of $12.49 billion.
- Growth Strategy: Broadcom focuses on large corporations and growth through acquisitions and cost-cutting, holding significant market shares in key segments.
- Market Expansion: Broadcom’s addressable market is projected to grow from $784.43 billion in 2023 to $1.2 trillion by 2028.
- Valuation Projections: Strong growth driven by AI infrastructure spending, and a 77% gross margin target by 2029.
G0d4ather
Thesis
In my previous article about Broadcom, Inc. (NASDAQ:AVGO) I upgraded the stock from “buy” to “strong buy”, explaining that the fair price indicated by my model now stood at $2,006.62, which showed a 53.3% upside from the stock price at that time of $1,308.72. Then, for 2029, the stock price could climb up to $3,676.77, translating into 30.8% annual returns.
Broadcom reported Q2 2024 earnings on Wednesday, June 12. Broadcom reported a non-GAAP EPS of $10.96 for the quarter, which beat estimates by a narrow 1.1%. Broadcom’s quarterly revenue of $12.49B also beat estimates, this time by a higher 3.9% margin.
After re-evaluating Broadcom’s stock, I arrived at a fair price estimate of $2,428.45 (which is 44.5% above the current stock price of $1,676.70), and a stock price estimate for 2029 of $4,773.98 (which implies 30.8% annual returns throughout 2029). For this reason, I maintain my “strong-buy” rating on Broadcom.
Overview
Growth Plan
Broadcom’s main clients are big corporations to which it tries to offer additional solutions aside from the main ones they offer. This is because big companies have a bigger and more stable purchasing power than small businesses.
Broadcom is also famous for acquiring companies and then conducting aggressive cost-cutting measures to boost value. The objective is “to build one of the world’s leading enterprise software businesses”.
How does Broadcom Compare to Peers?
I will focus on Broadcom’s most important segments which are: networking, wireless, and broadband. The reason for that is that Broadcom is too diverse and its software business is divided into 5 smaller segments which each brings in 5% of revenues.
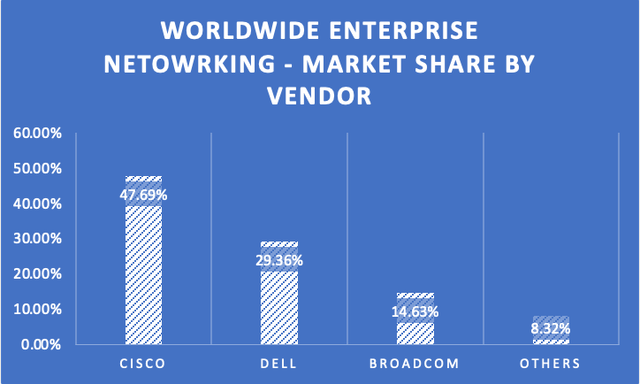
Starting with Networking, Broadcom holds a market share of 14.54% which puts it in third place behind Cisco Systems, Inc. (CSCO) and Dell Technologies (DELL), which hold 47.69% and 29.36% respectively. These three companies control 91.49% of the worldwide networking market, leaving other competitors 8.32% of the market.
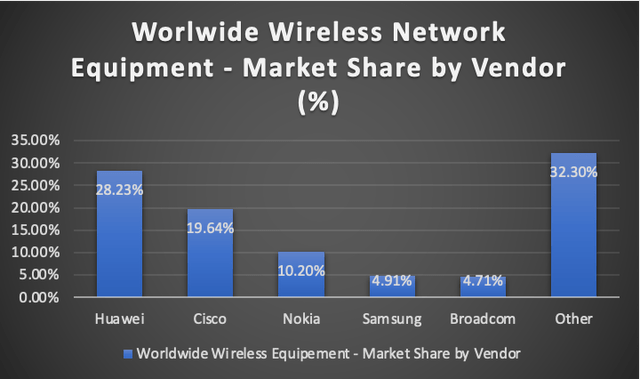
Then, the global network equipment market was valued at $174.81B in 2023. This means that when dividing the wireless revenue by the total market size, we can deduct that the major players are: Huawei, with a 28.23% market share, followed by Cisco with 19.64%, Nokia Oyj (NOK), then Samsung Electronics Co., Ltd. (OTCPK:SSNLF), and finally in fifth place, Broadcom, with a market share of 4.71%.
Lastly, Broadcom holds a 14.97% share in the broadband equipment market. Huawei and Cisco may hold higher market shares but this is impossible to know since both of those companies don’t disclose broadband equipment revenue as explicitly as Broadcom.
Industry Outlook & Addressable Market
The first segment I will cover is networking. Broadcom offers all the solutions necessary to build data centers: network infrastructure, servers, and storage devices. This means that it can serve the entirety of the data center market which in 2023 generated revenues of $329.3B, and that number is expected to be $438.63B for 2028, implying a 6.56% CAGR.
Then, it’s wireless equipment, through which Broadcom offers semiconductor solutions for building mobile network towers. The wireless infrastructure market was valued at $174.81B in 2023 and that number is expected to increase to $271.82B by 2028.
The next segment is cybersecurity where Broadcom offers VMWare (its most recent acquisition).The worldwide cybersecurity market generated revenues of $166.20B in 2023 and it’s expected to grow at a 10.48% CAGR by 2028 when it’s expected to generate revenues of around $273.5B.
Then it’s FC SAN. SAN is a network of storage devices that is used for servers. Meanwhile, FC refers to the Fiber Channel, which is what enables PCs to connect to the SAN (Storage Area Network). The SAN market is estimated to grow at a CAGR of 24.7%, passing from 2023’s $18.64B to 2028’s $56.20B.
Lastly, it’s payment security, whose main offering is Arcot. The worldwide payment security market was valued at $23.48B in 2023 and it’s expected to reach $48.14B in 2028, which showcases a 15.44% CAGR.
Overall, Broadcom’s addressable market stands at $784.43B, and this is expected to go all the way up to $1.2T in 2028, which suggests that Broadcom’s TAM will grow by 8.61% annually.
| Segments | TAM at the end of 2023 | TAM for 2028 | CAGR % |
| Broadband | 82,000.0 | 91,600.0 | 2.25% |
| Networking, Storage & Servers | 329,300.0 | 438,630.0 | 6.56% |
| Wireless | 174,810.0 | 296,910.0 | 11.00% |
| Cybersecurity | 166,200.0 | 273,500.0 | 10.48% |
| FC SAN | 18,640.0 | 56,205.4 | 24.70% |
| Payment Security | 23,480.0 | 48,140.0 | 15.44% |
| Total | 794,430.0 | 1,204,985.4 | 8.61% |
Can Broadcom Achieve These Growth Rates?
Broadcom’s revenue has been growing at an average of 17.4% annually since 2018. But what’s the most important tailwind that Broadcom has is the accelerated AI spending, which directly affects FC SAN, Networking, and to a lesser extent, broadband. These segments combined were responsible for around 55% of Broadcom’s revenue in 2023. According to UBS, spending on AI infrastructure is expected to grow by around 38% throughout 2027. This directly affects Broadcom’s networking and storage segments, which are part of the worldwide data center market.
Valuation
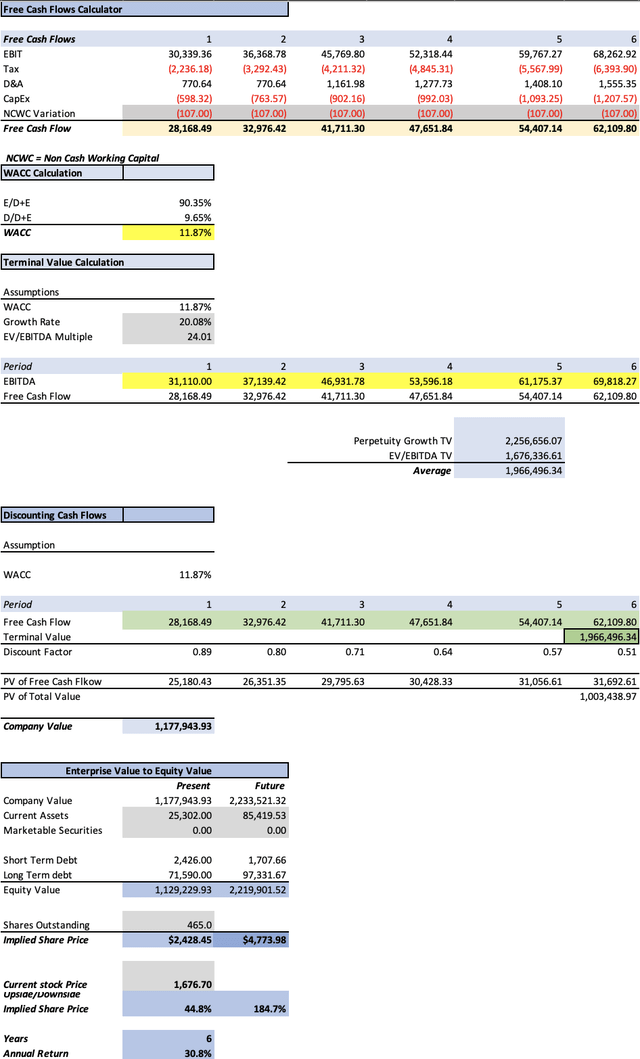
I will value Broadcom with a DCF model. The first step is determining the WACC, which was calculated with the already-known formula. The resulting WACC was 11.87%.
Then, D&A expenses will be projected through a margin tied to revenue, which came out at 1.51%.
| TABLE OF ASSUMPTIONS | |
| (Current data) | |
| Assumptions Part 1 | |
| Equity Market Price | 693,050.00 |
| Debt Value | 74,016.00 |
| Cost of Debt | 3.76% |
| Tax Rate | 9.96% |
| 10y Treasury | 4.252% |
| Beta | 1.36 |
| Market Return | 10.50% |
| Cost of Equity | 12.75% |
| Assumptions Part 2 | |
| CapEx | 500.00 |
| Capex Margin | 1.17% |
| Net Income | 10,273.00 |
| Interest | 2,784.00 |
| Tax | 1,136.00 |
| D&A | 644.00 |
| Ebitda | 14,837.00 |
The first step is to project the potential revenue of each of Broadcom’s operating segments. All the segments will perform in line with their respective markets this means that broadband will grow at a 2.25% rate, wireless at an 11% rate, cybersecurity by 10.48%, FC SAN by 24.70%, and payment security by 15.4%.
The segments that were not mentioned are because they have something I need to explain. The first two are networking and storage. Both of these segments are highly related to data centers which have witnessed a recent boom thanks to AI. For these reasons, I will make these two segments grow at a rate of 30% for 2024-2026, which is lower than the 38% expected by UBS. For the rest of those years, they will grow at 6.56%, in line with the worldwide data center market.
Then mainframe & distributed software will grow in pace with the performance of broadband, networking, wireless, storage, and industrial (which will collectively grow by 19.18% annually) because Broadcom’s software offerings are mostly used to manage the hardware that Broadcom sells.
It’s also worth noting that the reason why cybersecurity revenue went up from $1.79B in 2023 to $14.97B in 2024 is because VMWare generated around $13B in revenues for 2023 which will now be part of Oracle’s income statement.
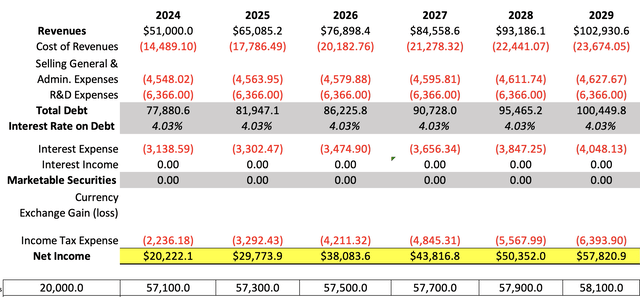
Then, it’s time to calculate net income. The first step is determining the gross margin. Currently, the gross margin is around 71.5%, and I will place a gross margin target of 77% for 2029. This means that the gross margin should increase by 1.082% annually to achieve my target. I think this is very possible considering that Broadcom has a reputation for being an aggressive cost cutter with their newly acquired companies.
Then I will calculate general & administrative expenses. In 2023, Broadcom had 20K employees and $1.59B in this type of expense. This means that Broadcom spent $80K per employee. Then I added all the new employees from VMWare which are around 37.1K, with the 1.2K planned layoffs by Broadcom already in.
The R&D expenses will be flat at $6.36B since Broadcom depends on 46.17% of software, and let’s remember that the major expense in software is the initial development. This is evidenced in the R&D spending range of 4.9B-4.6B in 2019-2022 despite gross profit increasing by 19.05% annually during that period.
Then it’s time to project total debt and marketable securities. Total debt will increase at a rate of 5.2%, mirroring the annual change during 2019-2023. I selected this year’s range because Broadcom’s debt spiked in 2024 thanks to its acquisition of VMWare. However, it’s not prudent to think that Broadcom will acquire huge companies every year. Plus, the additional revenue, net income, and cash flows that VMWare will provide should compensate for that total debt load at the moment of valuing equity.
Then, Broadcom’s interest expenses will be around 4.03%. The reason is that I found that during 2019 (when interest rates were lower, Broadcom paid 4.40% interest on debt), and in 2024TTM, Broadcom paid 3.76% interest on debt (a period when interest rates were higher than in 2019). This suggests that Broadcom’s credit rating has improved, and since predicting which would be Broadcom’s credit rating next year, I will use the average of both figures, which is 4.03%.
Concerning marketable securities, I will leave them at $0, since that has been the number Broadcom has maintained since 2015.
Lastly, income tax expenses will be tied to the current effective tax rate on Broadcom of 9.96%.
In the last two things, CapEx will increase at the same pace as revenue tied with a CapEx margin of 1.17%. Then, I will also calculate which could be the potential stock price for the year 2029.
The first thing to do is to sum all the undiscounted cash flows that are highlighted in green in the model below, to obtain the future enterprise value. Then, I predict which could be the value of each of the elements that conform to equity.
To do this I will make current assets grow by 27.55% annually, and long-term debt by 6.3%, meanwhile short-term debt will decrease by 6.8%. Marketable securities (as previously said) will remain at $0.
Lastly, the perpetuity growth rate will be maintained at 3% to keep consistency through my coverages on Broadcom.
As you can see, the suggested present fair price for Broadcom is $1,676.70, which represents a 44.8% upside from the current stock price of $1,676.70, and the suggested stock price for 2029 is $4,773.98. This last one translates into annual returns of 30.8% throughout 2024-2029.
How Realistic are my EPS Targets?
My EPS target for 2024 is very conservative since to achieve it, Broadcom would need to increase its non-GAAP net income by 3.62%, something that can be done with simple cost cuts.
However, for 2025, the required improvement is 50.51%, a high number. However, let’s remember that this is in part thanks to the compound effect of the 30% growth rate in networking and storage. Nevertheless, let’s remember that UBS is expecting 38% for 2024-2027. In other words, 8% more and for one year more.
| Past and future non-GAPP EPS | Growth Rate % | |
| 2019 | 21.29 | |
| 2020 | 22.06 | 3.62% |
| 2021 | 28.01 | 26.97% |
| 2022 | 37.64 | 34.38% |
| 2023 | 42.25 | 12.25% |
| 2024 | 43.49 | 2.93% |
| 2025 | 65.45 | 50.51% |
| 2026 | 83.83 | 28.08% |
| 2027 | 96.43 | 15.03% |
| 2028 | 110.81 | 14.91% |
| 2029 | 127.26 | 14.85% |
How has My Fair Price Estimates Evolved?
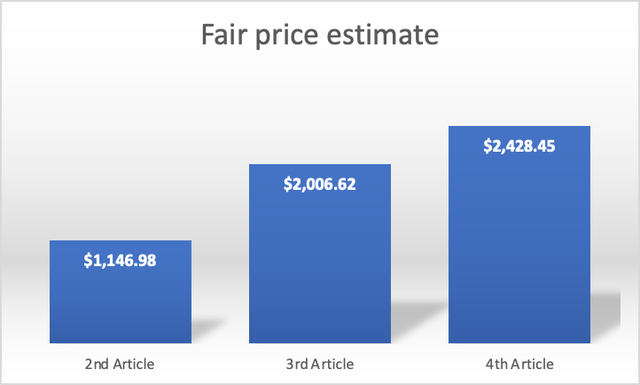
My current fair price estimate is 111.72% higher than the one I suggested in my first article. The reasons for this were Broadcom’s earnings beat on FQ1 2024 and FQ2 2024, which increased Broadcom’s valuation, as well as the addition of VMWare’s $13B revenue stream to the projection.
Risks to Thesis
Part of the growth that Broadcom has witnessed comes from its M&A operations. As previously said, the methodology of Broadcom is acquiring rivals and then aggressively cutting costs. However the problem lies in the fact that Broadcom is a big company and one of the world’s most valuable ones, therefore there is the possibility that the U.S. Federal Trade Commission, will start to block future acquisitions by Broadcom, which could slow down growth.
The other risk is competition because Broadcom is of course not alone. In networking, for example, it needs to compete with Cisco, and in wireless with companies such as Huawei. Both of those companies are giants in their industries and well-capitalized.
Conclusion
In conclusion, Broadcom continues to offer a decent opportunity, and one of the main aspects on Broadcom’s side is momentum, as you can have probably seen since my first article Broadcom’s stock has grown by 16%, however, stock as Cisco (which I said was hugely undervalued) continues to trade flat.
After re-evaluating the stock, I arrived at a fair price per share of $2,428.45 and a future price for 2029 of $4,712.29. The first one means that the stock price can increase by 44.8% in the near term, and the latter one, that the stock can deliver 30.8% annual returns throughout 2029.
Having said this, I reiterate my “Strong Buy” rating on Broadcom’s stock, and in subsequent quarters, I will pay attention to the performance of the segments exposed to AI, which is currently the main source of momentum for Broadcom.
Analyst’s Disclosure: I/we have no stock, option or similar derivative position in any of the companies mentioned, and no plans to initiate any such positions within the next 72 hours. I wrote this article myself, and it expresses my own opinions. I am not receiving compensation for it (other than from Seeking Alpha). I have no business relationship with any company whose stock is mentioned in this article.
Seeking Alpha’s Disclosure: Past performance is no guarantee of future results. No recommendation or advice is being given as to whether any investment is suitable for a particular investor. Any views or opinions expressed above may not reflect those of Seeking Alpha as a whole. Seeking Alpha is not a licensed securities dealer, broker or US investment adviser or investment bank. Our analysts are third party authors that include both professional investors and individual investors who may not be licensed or certified by any institute or regulatory body.
