Summary:
- Microsoft Corporation recorded significant financial growth in 2022, with substantial revenue and net income driven by Azure and LinkedIn’s performances, leading to an increase in stock price.
- Microsoft’s cybersecurity department has seen significant growth, while the company also ventures into the secure service edge market.
- Despite global economic uncertainties, Microsoft’s stock price has shown resilience and is predicted to maintain its upward momentum, with technical analysis suggesting a probable upward breakout.
- The emergence of a bullish hammer at the 38.2% Fibonacci retracement level, followed by a swift rebound, suggests a likely upward breakout.
Jean-Luc Ichard
Microsoft Corporation (NASDAQ:MSFT) enjoyed remarkable financial growth in 2022. The tech giant’s substantial revenue and operating income, buoyed significantly by the performances of Azure and LinkedIn, directly led to a marked increase in its stock price and operating profit. Continuing this upward trend, Microsoft anticipates a promising trajectory with projections indicating a double-digit growth in revenue and operating income for the fiscal year 2023. This article provides an in-depth technical examination of Microsoft to forecast its future trajectory and highlights potential investment avenues for investors. It is evident that the market is presently positioned at a pivotal breakout point, where any advancement beyond this mark will trigger a substantial surge in Microsoft’s value. The appearance of an inside bar, inverted head and shoulders, and a bullish hammer suggests a probable upward breakout in Microsoft’s value.
Microsoft’s Road to Huge Profits Paved by AI and Cybersecurity
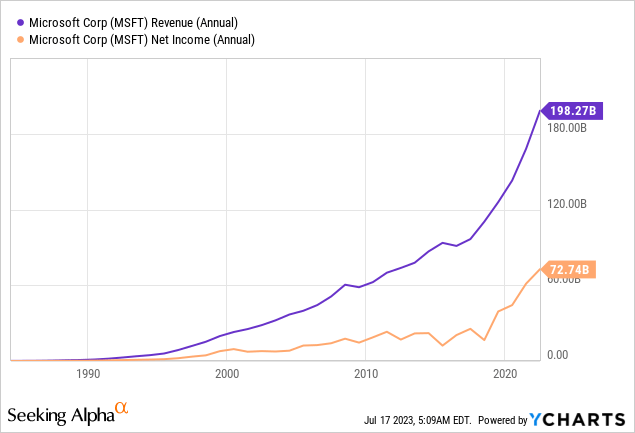
Over the course of 2022, Microsoft witnessed an extraordinary financial upswing, as evidenced by its substantial revenue of $198.27 billion and net income of $72.74 billion, as seen in the chart below. This exceptional growth in earnings contributed significantly to the increase in the tech giant’s stock price. Microsoft concluded its fiscal year 2022 on a robust note, recording a significant surge in operating income. This surge was largely attributed to Azure and other cloud services, which saw a 40% revenue increase in the fourth quarter, and LinkedIn, which experienced a 26% revenue growth.
Renowned for its strong relationship with shareholders, Microsoft started distributing dividends in 2003, further establishing its dependability. Although its dividend yield stands at less than 1% in mid-2023, compared to approximately 1.5% of the S&P 500, Microsoft still retains a prominent position in the U.S. dividend environment. In 2022, Microsoft allocated an impressive $18 billion in dividends, marking the 13th successive year it has raised its dividend.
Despite the extensive media attention drawn by Microsoft’s ventures into artificial intelligence and its impending acquisition of Activision Blizzard, its rapidly growing cybersecurity segment often gets overlooked. It’s important to note that Microsoft’s cybersecurity department has seen substantial growth, amassing over $20 billion in annual revenues and expanding at a 33% annual rate. Moreover, an increasing proportion of Microsoft’s current clients have opted to strengthen their security affiliations with the company. CEO Satya Nadella is proud of the company’s robust, integrated tools that process an astonishing 65 trillion signals daily.
Continuing to evolve, Microsoft has ventured into the secure service edge market and introduced Security Copilot, a generative AI, and significant language model-powered service. It has also launched two new offerings—Microsoft Entra Internet Access and Microsoft Entra Private Access, aiming to enhance security access to various Internet, SaaS, and Microsoft 365 resources. These products, currently in preview, will be widely available later this year, and Microsoft hopes to simplify processes and attract new clientele by integrating these cybersecurity products with its Azure cloud computing and other SaaS offerings.
The first half of 2023 has proved to be a good year for investors following a challenging 2022. Many stocks have bounced back from last year’s slump, bolstered by a more resilient tech sector than initially feared. Artificial intelligence has been a major catalyst for this recovery, with stocks like Microsoft enjoying a year-to-date increase of more than 40%. Despite previous cost-saving measures and bracing for a predicted economic downturn that never materialized, companies are thriving with AI playing a pivotal role. The market is therefore eagerly awaiting further growth in earnings.
Microsoft’s Long-term Perspective
Microsoft’s long-term perspective appears to be predominantly bullish, as demonstrated by the yearly chart below. Notably, the price shows a considerable level of volatility, approaching record highs. This heightened volatility was particularly evident during the years 2019, 2020, and 2021, as shown by the yearly candles. This surge in Microsoft’s price fluctuation was largely attributed to the prevailing global economic uncertainty, spurred by the prolonged US-China trade tensions and the ambiguous state of Brexit. These international affairs significantly impacted multinational corporations, such as Microsoft.
Furthermore, the unprecedented outbreak of the COVID-19 pandemic dramatically influenced worldwide financial markets. Initial reactions saw the markets drop sharply due to the uncertainty enveloping the pandemic. However, Microsoft subsequently witnessed an escalation in stock prices as remote work and the need for cloud services become increasingly vital, leading to heightened volatility.
This fluctuation in Microsoft led to the price reaching a peak of $344.80, only to retract to a lower level during 2022. Microsoft’s stock price underwent a phase of consolidation in 2022, seemingly reaching a low point before rallying again. This period of price consolidation in 2022 marked an inside bar, as observable on the yearly chart, and the price is currently consolidating at the breakout point of this inside bar.
Microsoft Yearly Chart (stockcharts.com)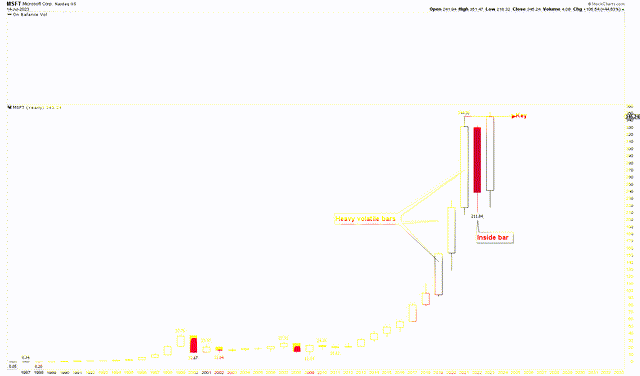
The appearance of this inside bar following the heavily volatile periods of 2019, 2020, and 2021 indicates price compression. Should the price manage to surpass the all-time highs, it would likely initiate a robust rally to the upside, rendering $352 as the decisive key to this potent rally in Microsoft.
The quarterly chart further elucidates the bullish price behavior identified in the yearly chart. This chart reveals a parabolic move in the market, characterized by a price strengthening from the 2009 low of $11.14. It is also apparent from the quarterly chart that the correction in Microsoft produced a solid bottom at $211.84, accompanied by the emergence of a bullish hammer. The candles following the bullish hammer represented a swift recovery. The appearance of the bullish hammer within this correction and the quick recovery following its emergence suggests that Microsoft’s parabolic move is not yet over and that the price is set to rally in the coming months.
Microsoft Quarterly Chart (stockcharts.com)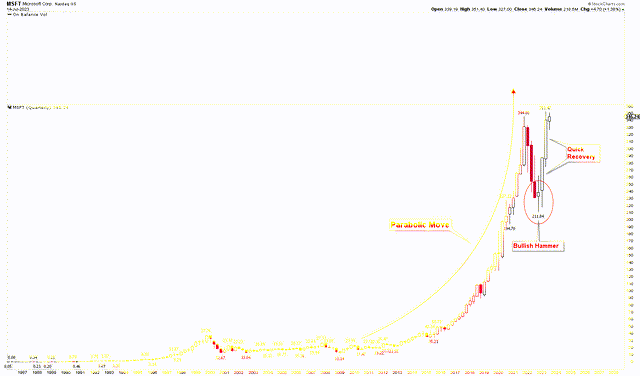
Pinpointing Crucial Market Levels and Strategic Moves for Investors
The monthly chart helps to understand Microsoft’s bullish outlook by illustrating the Fibonacci retracement levels, which are drawn from the low of $11.14 to the high of $344.80. Typically, powerful bull markets bottom at the 38.2% retracement level before rallying again to exceed the previous highs. In this instance, Microsoft bottomed at the 38.2% retracement during the most recent correction. The bounce from this solid support level has once again reached all-time highs and is poised for an upside breakout. The consistent strong rally from the 38.2% retracement further bolsters the bullish momentum and the probability of an upside breakout.
Microsoft Monthly Chart (stockcharts.com)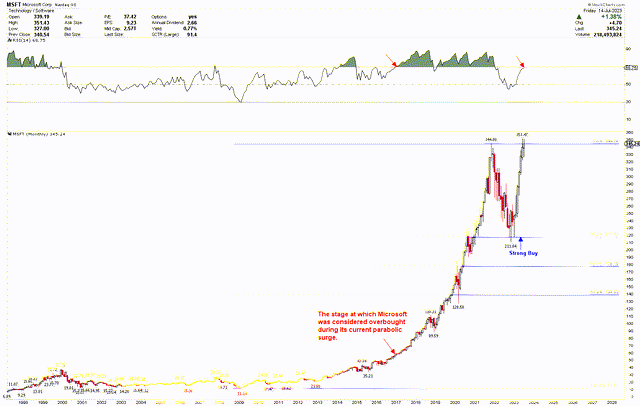
Furthermore, July marks the seventh consecutive month to produce a positive bullish candle on the chart. This chart clearly signals that a break above $352 would exceed this critical level and ignite a robust rally in the market. Presently, the chart indicates that the market is entering the overbought territory. Nevertheless, it is evident from the aforementioned chart that during parabolic movements, the market tends to disregard extreme conditions. A notable example can be observed in the same chart, where the market became overbought in 2017 but continued to rally strongly until 2021.
It is evident that Microsoft maintains a healthy bullish trend and is presently on the verge of breaking the crucial level of $352. However, to understand the investment strategies better, the weekly chart explores the critical levels where investors could consider long positions. Interestingly, the market low observed in the quarterly chart, which revealed the emergence of the bullish hammer, coincides with the low of the ascending broadening wedge formed from the low of $89.59 to the high of $344.80. The price successfully bounced back from the wedge support line.
Microsoft Weekly Chart (stockcharts.com)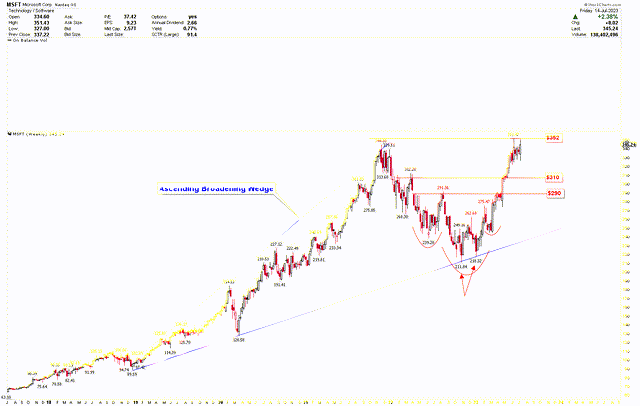
It’s also interesting that the market created a double bottom during this low at $211.84 and $218.32. The price rapidly reversed from this bottom, forming an inverted head and shoulders pattern with the head at $211.84 and shoulders at $239.20 and $245.07, respectively. The neckline of this pattern was broken at $290, and the price swiftly rose to all-time highs. This emerging robust bullish pattern at this strong support region further bolsters the bullish case, suggesting that a breakout from $352 will trigger another powerful rally. If the price breaks above all-time highs, investors can buy the breakout at $352 in anticipation of higher prices. A correction will likely occur if the market fails to breach $352. In such an event, investors could consider buying at the strong support region of $310 and $290.
Market Risk
Microsoft’s stock price has experienced considerable volatility in response to global economic uncertainties, including US-China trade tensions and Brexit ambiguities. With the COVID-19 pandemic still ongoing and geopolitical tensions intensifying, any sudden changes in global economic conditions could adversely impact Microsoft’s stock price. Moreover, Microsoft operates within a rapidly evolving technological landscape, characterized by fierce competition and constant innovation. The company’s growth is contingent upon its ability to adapt to these dynamics and stay ahead of competitors such as Amazon (AMZN), Alphabet Inc. (GOOG), and International Business Machines Corporation (IBM) in cloud services and other areas of technology.
Additionally, Microsoft operates in various jurisdictions worldwide, and changes in regulations or legislation could affect its operations and financial performance. Particularly, the ongoing scrutiny of tech giants for antitrust issues poses a significant risk. As Microsoft broadens its footprint in the cybersecurity market, it also becomes more susceptible to cyber threats and attacks. Although the company is developing more sophisticated protection tools, the risk of a cyber-attack causing reputational damage or financial loss is a constant challenge. Microsoft’s announced acquisition of Activision Blizzard may face regulatory scrutiny and integration challenges that could potentially disrupt its business and financial performance.
From a technical perspective, Microsoft’s stock price continues to maintain a robustly bullish trend. Yet, until it breaches the $352 mark, the likelihood of a market correction persists. Given the ongoing high volatility, a dip below $210 could trigger additional downward momentum.
Final Thoughts
Microsoft’s formidable financial performance in 2022, with a robust revenue of $198.27 billion and an operating income of $83.38 billion, along with significant growth in its Azure cloud service and LinkedIn, positions the company as a strong player in the tech sector. Even with a dividend yield less than the S&P 500’s, Microsoft remains a major dividend payer, showcasing the company’s reliability. Despite the spotlight on its venture into AI and the acquisition of Activision Blizzard, Microsoft’s cybersecurity business quietly thrives, garnering over $20 billion in annual revenues. This success, coupled with new security products, lays the groundwork for Microsoft’s bid to capture the booming internet security services market. Despite the economic instability caused by the pandemic, Microsoft’s stock exhibited an impressive year-to-date growth of over 40% in 2023, a surge largely attributed to the impact of AI. Based on the stock’s technical performance, the price is predicted to maintain its upward momentum.
From a technical standpoint, the appearance of an inside bar after the high volatility bars of 2019, 2020, and 2021 suggests price compression and the potential for an upward breakout. The emergence of a bullish hammer at the 38.2% Fibonacci retracement, coupled with quick recovery after the bullish hammer, further augments the likelihood of an upward breakout. Interestingly, the inverted head and shoulder formation at the ascending broadening wedge signifies that a breakout above $352 could trigger a substantial rally to higher levels. Investors might consider buying at the $352 levels or could consider buying if the market retraces to the $310 and $290 levels.
Analyst’s Disclosure: I/we have no stock, option or similar derivative position in any of the companies mentioned, and no plans to initiate any such positions within the next 72 hours. I wrote this article myself, and it expresses my own opinions. I am not receiving compensation for it (other than from Seeking Alpha). I have no business relationship with any company whose stock is mentioned in this article.
Seeking Alpha’s Disclosure: Past performance is no guarantee of future results. No recommendation or advice is being given as to whether any investment is suitable for a particular investor. Any views or opinions expressed above may not reflect those of Seeking Alpha as a whole. Seeking Alpha is not a licensed securities dealer, broker or US investment adviser or investment bank. Our analysts are third party authors that include both professional investors and individual investors who may not be licensed or certified by any institute or regulatory body.
