Summary:
- Caesars reported a Q2 result showing a shift into stronger Las Vegas operations but likely temporarily weakening regional casino financials after good post-Covid normalization.
- CZR’s debt remains high after the COVID earnings slump and the 2020 merger, but debt paydowns should accelerate through improved cash flows.
- The sale of the WSOP brand should also aid in paying down debt, while the transaction still lets the Company leverage licensed brand assets from WSOP, including tournament hosting.
- Caesars’ stock valuation seems balanced but extremely volatile due to its extremely high debt.
Nature, food, landscape, travel/iStock Editorial via Getty Images
Caesars Entertainment, Inc. (NASDAQ:CZR) primarily operates brick-and-mortar casinos with Las Vegas locations such as Caesars Palace, Flamingo, and Horseshoe, and with several regional casinos under the Harrah’s and other names. The company also has online operations through the Caesars Sportsbook and other brands, including the WSOP brand that Caesars has now agreed to sell.
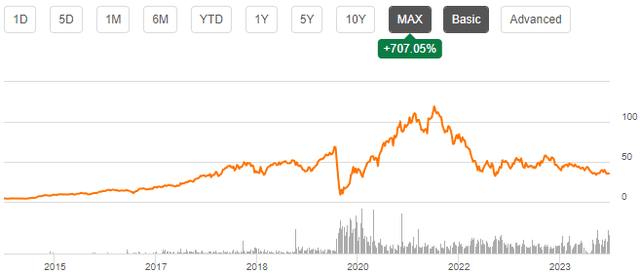
After the current company was formed in 2020 with the merger of Eldorado Resorts and Caesars Holdings, the stock initially rallied along with the market to the 2021 highs. Ultimately, with Caesars holding an immense amount of debt, the stock has now traced back, still leaving a good long-term return for Eldorado Resorts’ legacy shareholders but remaining worries of high debt amid Caesars’ post-Covid earnings recovery.
Caesars Is Now Operating Healthily After The Covid Pandemic’s Lingering Effects
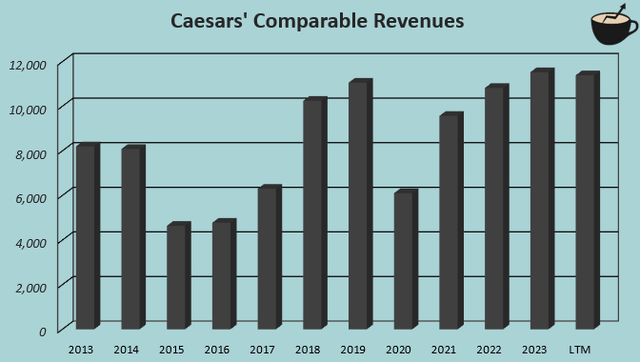
Caesars’ operations have slowly normalized from the Covid pandemic’s lingering effects – amid the industry’s traffic recovery from the Covid pandemic slump, Caesars has increased the company’s hotel occupancy from a low 82.1% in 2021 into 96.8% in 2023 already in Las Vegas casinos, meanwhile the area’s revenues from gambling have still stayed near stagnant for the company. After the occupancy improvements and normalizing food & other sales, the total trailing revenues of $11.4 billion are now comparable to pre-pandemic figures.
While Las Vegas operations have still continued to trail at a -4.1% decline in 2023, regional casinos have shown more resilient results and Caesars Digital revenues are showing solid growth momentum, pushing for better revenues.
Author’s Calculation Using TIKR & CZR Press Release Data
The company’s operating margin now also stands strong at a trailing 21.3% level, being at the high end of peers’ comparable figures; Boyd Gaming (BYD) has a 24.7% trailing operating margin, Wynn Resorts’ (WYNN) trails at 17.7%, and MGM Resorts’ (MGM) at just 10.3%.
I believe that Caesars has found a good operational balance as the industry in Las Vegas is experimenting with different house edges, hotel room pricing, and provided services; behind the revenues and operating profitability, Caesars has successfully managed to increase the table game hold percentage to a great 22.2% in 2023 combined with the constantly increasing hotel occupancy.
Meanwhile, the higher-margin Boyd Gaming has struggled in maintaining table game hold percentage at a -5.5% decline in 2023, coupled with Boyd Gaming’s weak occupancy that I’ve written on previously due to the focus on margins. MGM Resorts, on the other hand, has been able to push better table game hold percentages into a high 26.3% in 2023, but ultimately trails in occupancy and overall profitability when compared to Caesars. Overall, Caesars seems to post a stable performance compared to the industry, with healthy underlying KPIs.
Q2 Report: Great Las Vegas Improvement, Likely Temporarily Weakening Regional Performance
Caesars reported the company’s Q2 results on the 30th of July. Revenues came in at $2.83 billion, $29 million below Wall Street analysts’ expectations, with the -1.7% year-on-year decline. The adjusted EPS of $0.12 beat estimates by a small $0.04 margin.
Notably, Las Vegas operations showed a trend change into 1.9% comparable growth, improving incredibly well compared to the weak 2023 performance and a continued -4.5% Las Vegas revenue decline in Q1. With traffic worries in the industry due to macroeconomic pressures, the improvement is in my opinion a very great sign. Wagering amounts in Las Vegas declined slightly organically, whereas Caesars is still greatly improving the table games hold percentage by 1.1 percentage points in Q2 into 21.9%. The segment’s adjusted EBITDA was near flat year-on-year at $514 million.
Caesars’ Las Vegas hotel occupancy continued improving into a nearly fully booked 98.7% occupancy level in Q2, with a 1.1 percentage point improvement year-on-year. The level compares to MGM Resorts’ around 1 percentage point increase into 97% during Q2, WYNN Resorts’ -0.3 percentage point decline into 89.4%, and Boyd Gaming’s best 2.6 percentage point improvement from an incredibly poor starting level; Caesars continues leading Las Vegas by hotel occupancy with the good, improving occupancy trend still continuing in Q2.
The Caesars Digital segment continued growing at a great 27.8% rate, managing to scale into small GAAP net income profitability in Q2. The segment now looks to potentially drive good earnings growth in Caesars from a still small scale. The Caesars Sportsbook app’s growth does likely cannibalize Caesars’ brick-and-mortar casino revenues slightly, though.
Contrary to the great Las Vegas and Caesars Digital segments’ performances, regional operations saw an incredibly weak -5.2% revenue decrease year-on-year as competition in many new regional markets remains high. The segment’s adjusted EBITDA declined by -7.7% into $469 million, reflecting weaker revenues.
The regional performance was disturbed in the quarter by construction, as told in the Q2 earnings call, being a temporarily negative effect. The expensive rebranding of the New Orleans Caesars should start to drive improvements in the segment, and the weakness in Q2 was related primarily to a weak April due to Easter timing as May and June already showed year-on-year improvements – the weak regional performance in revenues seems to primarily be a one-off quarter for now, although the competitive pressures could pressure regional performance in upcoming quarters and years as well.
Summing up, the quarter saw a very positive shift in the Las Vegas financial trend coupled with continued online revenue growth as the company remains optimistic about Caesars’ future performance. The regional performance was impaired by casino rebranding and weak April revenues, but excluding some competitive pressures, the regional segment should also show sequential improvements going forward.
Caesars’ Debt Remains Unsustainably High, But Deleveraging Progress Should Accelerate
Caesars’ incredibly high debt is the company’s primary weakness. The company has around $12.4 billion of interest-bearing financing debt and trailing interest expenses of $2355 million, covering nearly all the Caesars’ $2,421 million in operating income at a clearly unsustainable level despite some operational earnings progress. The long-term debt has so far been chipped away from $14.2 billion in 2020. Of the interest expenses in H1, $525 million were related to interest-bearing debts, and the rest at $660 million are related to lease expenses being operative in the nature as Caesars leases a portion of its locations.
Most of the maturities are from 2028 through to 2031 in term loans, with unsecured 2027 and 2029 senior notes being other significant portions of the debt, as the company has now refinanced the debt to the nearest maturity in three years. The company also has revolver capacity of $2,235 million, providing the potential for further refinancing if needed – short- to mid-term liquidity issues still seem highly unlikely despite the extremely high debt.
Caesars is actively making progress on paying down the debt, using improving cash flows to deleverage the balance sheet – the company anticipates to lower capital expenditures by $200 million in 2025 as told in the Q2 earnings call, enabling better debt paydowns. Progress on the balance sheet has so far been slow due to impaired Covid-time earnings, but improving occupancy trends, Caesars Digital segment’s earnings momentum, and currently ongoing investments should push cash flows forward in the near- to mid-term, enabling better debt payments. With the improving free cash flow outlook, debt paydowns should, and need to, accelerate as net income still trails at around breakeven from extremely high interest.
The lease interest expenses are understandably still going to remain despite debt paydowns, being at an annualized $1,320 million rate with the H1 interest expenses.
The Sale of WSOP Likely Accelerates Debt Paydown
On the 1st of August, Caesars announced the definitive agreement to sell the World Series of Poker brand to NSUS Group. As part of the transaction, Caesars receives $250 million in cash and a $250 million promissory note due five years after the transaction closes – Caesars is receiving a good amount of capital to pay off a fraction of its debt through the transaction.
With the agreement, Caesars remains with the right to host the infamous WSOP live tournament in its Las Vegas casinos for the next twenty years, along with the right to host all WSOP-C tournaments. The company is also allowed to run its online WSOP real-money poker business in Nevada, New Jersey, Michigan, and Pennsylvania for the foreseeable future but restricted in other states. Caesars’ casinos will also still include WSOP branding elements – Caesars is still going to benefit from WSOP through licensing.
The transaction is very interesting, as NSUS appears to be confident in driving the WSOP brand in a better direction with extensive partnerships with GGPoker. Still, Caesars gets a good number of continued operations under the WSOP brand and receives a total of $500 million, likely to be used to pay down the incredibly high debt. I believe that the transaction is likely accretive for shareholders through further accelerated debt payments enabled by the proceedings, although the financial implications haven’t been fully disclosed to determine the value of the transaction.
CZR’s Valuation Is Fair, But Volatile
I constructed a discounted cash flow [DCF] model for Caesars to determine a rough fair value estimate for the stock. In the model, I estimate revenues to decline by -0.5% in 2023, suggesting an improving H2 performance, with the improvements in macroeconomic sentiment continuing in the DCF model with a 3.5% revenue growth in 2025. Afterward, I estimate stable 2.0% revenue growth, expecting very slow brick-and-mortar revenue growth and digital growth carrying the growth into a slightly higher level. The upcoming revenue growth estimates include a negative impact from the WSOP sale.
With improving operating leverage from digital revenues and good cost management in brick-and-mortar casinos, along with the improving macroeconomic estimate in 2025, I estimate Caesars’ EBIT margin to rise to an eventual 23.0% level from a 20.9% estimate in 2024.
In the cash flow conversion, I estimate improving cash flows from lowering capex from 2025 forward, enabling debt payments. The cash flow conversion estimate also includes the interest expenses related to leases, as I account them as operational expenses and not necessarily as debt payments.
I have added $250 million of cash to the balance sheet from the WSOP sale, and $250 million in 2029 cash flows.
DCF Model (Author’s Calculation)
The estimates put Caesars’ fair value estimate at $34.44, 3% below the stock price at the time of writing – the stock seems to be nearly fairly valued with the expectation of some operational improvements from digital sales and ongoing investments including the New Orlando Caesars rebranding.
Compared to peers, Caesars’ forward EV/EBITDA of 8.5 also seems fair – PENN Entertainment (PENN) has a comparable forward EV/EBITDA of 9.9, Boyd Gaming a lower 7.1, MGM Resorts a comparable 8.6, and Wynn Resorts a lower 7.2, with all the companies still trading at quite a comparable level to Caesars.
Still, I want to note the model’s incredibly volatile nature – with a persisting 20.9% EBIT margin, the model already estimates 31% downside for the stock as the incredibly high debt leverages shareholder returns. On the other hand, better growth could make the stock a highly attractive investment as well.
CAPM
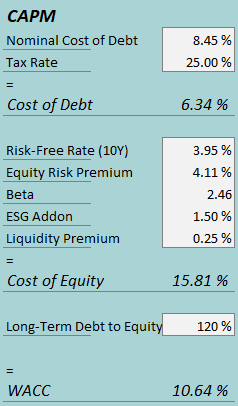
A weighted average cost of capital of 10.64% is used in the DCF model. The used WACC is derived from a capital asset pricing model:
CAPM (Author’s Calculation)
In H1, Caesars had $525 million in interest expenses related to interest-bearing debts excluding leases, making the company’s interest rate 8.45% with the current amount of interest-bearing debt. I estimate an incredibly high 120% long-term debt-to-equity, still less than the current ratio with the market’s equity valuation.
To estimate the cost of equity, I use the 10-year bond yield of 3.95% as the risk-free rate. The equity risk premium of 4.11% is Professor Aswath Damodaran’s estimate for the US, updated in July. Seeking Alpha estimates Caesars’s beta at 2.46, understandably high due to Caesars’ extremely leveraged balance sheet. With an ESG add-on of 1.5% and a liquidity premium of 0.25%, the cost of equity stands at 15.81% and the WACC at 10.64%.
Takeaway
Caesars has finally recovered operationally from lingering Covid effects, posting incredibly healthy occupancy and other KPIs. The Q2 results posted a shift into stronger Las Vegas revenues but weaker temporary regional revenues, combined with good Caesars Digital growth momentum, being a solid quarter due to the likely temporary nature of regional casinos’ weakness.
Still, after the 2020 merger and the Covid pandemic, Caesars’ debt is still unsustainably high. The strategic sale of WSOP and improving cash flows should start to aid accelerated debt paydowns, but the heavy debt looks to remain high for the foreseeable future. As I see the stock’s valuation balanced but incredibly volatile, I initiate Caesars Entertainment at a Hold rating. I still suggest caution, but also a potentially opportunistic view of the stock if cash flows improve well.
Analyst’s Disclosure: I/we have no stock, option or similar derivative position in any of the companies mentioned, and no plans to initiate any such positions within the next 72 hours. I wrote this article myself, and it expresses my own opinions. I am not receiving compensation for it (other than from Seeking Alpha). I have no business relationship with any company whose stock is mentioned in this article.
Seeking Alpha’s Disclosure: Past performance is no guarantee of future results. No recommendation or advice is being given as to whether any investment is suitable for a particular investor. Any views or opinions expressed above may not reflect those of Seeking Alpha as a whole. Seeking Alpha is not a licensed securities dealer, broker or US investment adviser or investment bank. Our analysts are third party authors that include both professional investors and individual investors who may not be licensed or certified by any institute or regulatory body.


