Summary:
- Broadcom has seen significant gains due to the AI boom but remains unlikely to surpass Nvidia as the top AI semiconductor stock.
- Despite strong financial performance and growth, Broadcom’s valuation multiples are high, indicating the stock is overvalued relative to its growth rate.
- Short and intermediate-term technical analyses show mixed signals, while the long-term outlook is positive with strong uptrend support.
- Given the rich valuation and mixed technicals, Broadcom deserves a hold rating, with Nvidia’s top position in AI semiconductors remaining secure.
Mariana Mikhailova
Thesis
Nvidia (NVDA) has taken the spotlight in the past couple of years as the AI boom has propelled its stock to levels previously almost unimaginable. However, another much less known semiconductor company, Broadcom Inc. (NASDAQ:AVGO), has also seen its business benefit from this boom and after a nearly 100% gain in its stock in the TTM, it is seeing its market cap near the exclusive $1 trillion club. Can Broadcom take Nvidia’s title of top AI semiconductor stock? As discussed in the analysis below, Broadcom has a net positive short and intermediate term outlook, while the long term is much more bright. In terms of the fundamentals, however, despite healthy growth rates and beating earnings expectations in the most recent quarter, valuation multiples indicate the stock is overvalued even after accounting for its growth. So back to the question if Broadcom can dethrone Nvidia or not. In my view, it is not likely that Broadcom will be able to surpass Nvidia to be the top AI stock. In a recent article, I initiated a buy rating on Nvidia as technicals and fundamentals converge on a bright outlook for its stock. From the analysis below, I determine that Broadcom only deserves a hold rating.
Daily Analysis
Chart Analysis
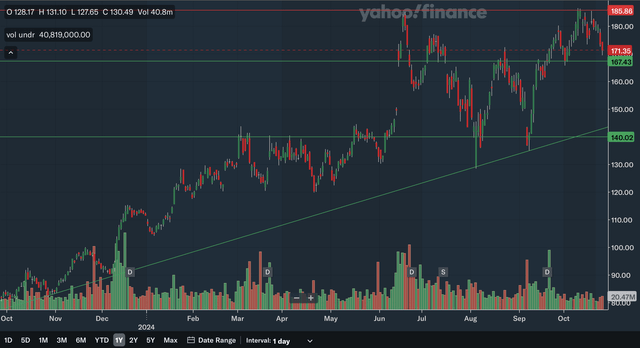
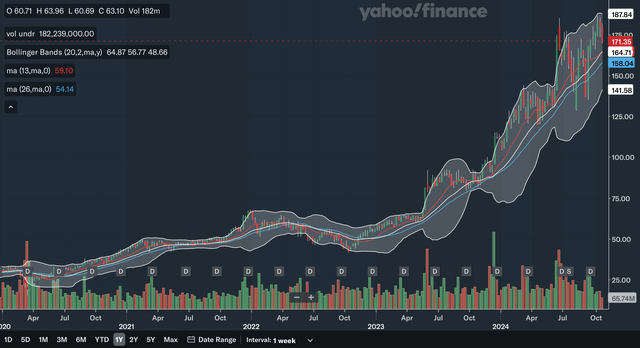
The daily chart is a mainly positive one for Broadcom as the stock nears key support. As you can see above, despite the volatility in the past few months, the stock remains in a near-term uptrend. The nearest support level would be in the mid-160s as that level has been support and resistance multiples times in the past few months. The next level of support would be the uptrend line that is currently nearing 145 and rising. Lastly, we also have support at 140 as that area was important resistance during the first half of the year and was support in August and September even though the line was broken for a very short period of time in both cases. The only area of resistance would be at the all-time highs in the mid-180s. This high was set in June, and the stock has still not truly broken out from this area. Overall, I believe the daily charts show a net positive near term for Broadcom as the stock remains in an uptrend with support quite near underneath.
Moving Average Analysis
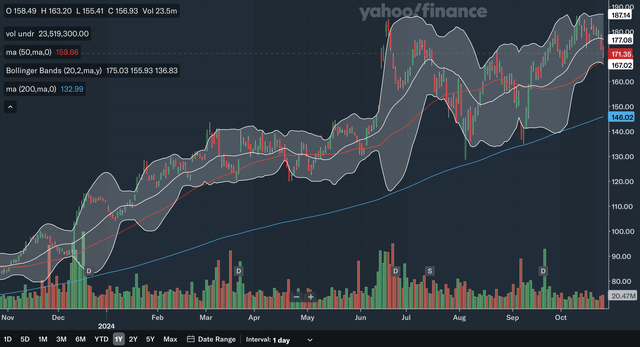
There have been no crossovers of the 50-day SMA and the 200-day SMA in the past year, as the 50-day SMA has been on top the entire time. Currently, the 50-day SMA is still pulling away from the 200-day SMA, showing that there is still near-term bullish momentum. The stock is currently trading very near the 50-day SMA and could find support at that line. For the Bollinger Bands, the stock is approaching the lower band but has not entered into oversold territory yet. The stock did break the 20-day midline of the Bollinger Bands, which is a bearish indication as that line is supposed to be support in an uptrend. This could indicate the near-term uptrend is weakening. From my analysis, the short-term picture for Broadcom is still a net positive one, despite the breach of the Bollinger Bands midline as the stock remains above both MAs with the 50-day SMA still widening the gap with the 200-day SMA.
Indicator Analysis
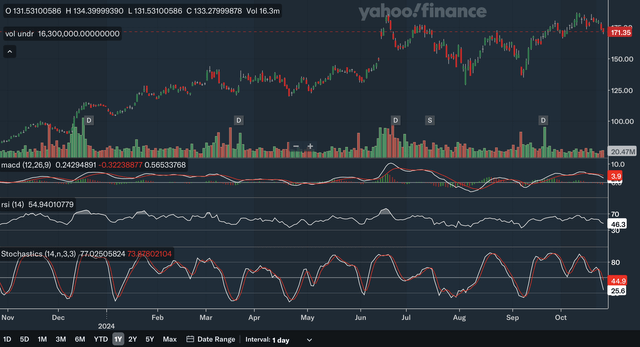
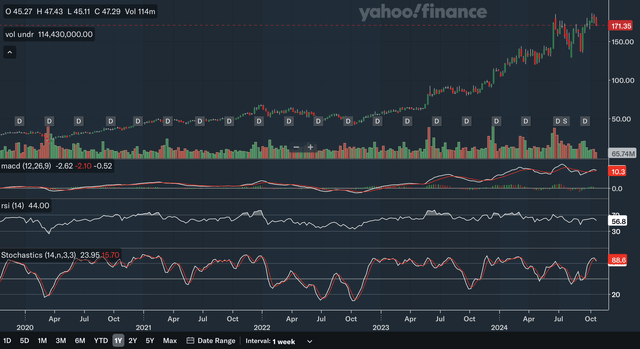
The MACD had a bearish crossover with the signal line earlier this month, and the gap has since been widening between the two, indicating an increase in bearish momentum. In addition, the MACD also displays negative divergence since the stock is back at all-time highs but the MACD is significantly lower than it was in June. For the RSI, it currently has a reading of 46.3 and was not able to hold above the critical 50 level, indicating that bears have regained control from the bulls. The RSI also displays the negative divergence as discussed above as it too remains significantly below the June peak. Lastly, for the stochastics, the %K had a bearish crossover with the %D earlier this month and since then, the %K has plunged quickly, widening the gap between the two. This indicates accelerating bearish momentum in the nearer term. Overall, in my view, these indicators reflect a rather worrying outlook for Broadcom as there are few positives to be taken.
Takeaway
The short-term technical outlook for Broadcom is only a slightly net positive one. The chart shows that we are still in an uptrend and the moving averages remain quite strong. However, the Bollinger Bands and the rest of the indicators are flashing bearish signals that could indicate that this rally is on weak legs.
Weekly Analysis
Chart Analysis
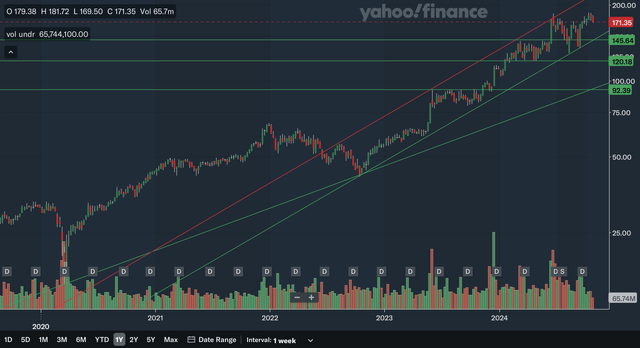
Note that the above chart is in a logarithmic scale to better show Broadcom’s intermediate term picture. The weekly chart is a positive one for the stock as it remains in a strong uptrend with significant support underneath. The only resistance identified is the upper channel line that dates back to 2022. The resistance should be minimal as this line is quickly sloping upwards. The closest area of support would the lower channel line. Moving down, we also have support in the mid-140s. This zone is basically the same as the one identified in the daily analysis. The next level of support would be at around 120 as that level was support throughout the first half of this year. Next, we also have a less steep uptrend line in play that dates back to 2020. This is an even longer-term uptrend line and could also be a source of support. Lastly, the low 90s may also be support as that area was resistance throughout 2023. In my view, the weekly chart is a highly positive one for Broadcom as it remains in both a quicker and a slower uptrend with support underneath.
Moving Average Analysis
After a bullish crossover at the end of 2022, the 13-week SMA has remained above the 26-week SMA to the present day. Currently, the gap between the two has narrowed, showing that the bullish momentum has receded a bit recently. The stock remains above both of these MAs. For the Bollinger Bands, the stock is trading between the upper band and the 20-week midline after nearing the upper band. The midline should be the nearest MA support for Broadcom if it continues to pullback. Despite the narrowing gap between the SMAs, I believe this moving average analysis is a positive one for Broadcom, as there are no signs the intermediate uptrend is coming to an end.
Indicator Analysis
The MACD is currently above the signal line, but it is very near a bearish crossover, negating the bullish signal. The weekly MACD also shows the negative divergence like in the daily analysis, as it remains significantly below the peak in the middle of the year, despite the stock being at all-time highs recently. The RSI shows that the negative divergence occurred even earlier, as the RSI has slumped since early 2023 despite the stock continuing to advance to new highs. The divergence of these two key indicators are red flags that investors need to take note. Lastly, for the stochastics, the %K just had a bearish crossover with the %D within the overbought 80 zone, which is a significant negative signal. Overall, like in the daily indicator analysis, there is not much to like here as bullish signals are nowhere to be seen.
Takeaway
Like in the daily analysis, the intermediate term technical outlook is a slightly net positive one, but investors should practice high caution. The charts show the stock remains in both a slower and quicker uptrend, and the moving averages are supporting the trend. However, the indicators discussed above show a worrying picture, with both nearer term bearish signals as well as longer-term bearish divergence.
Monthly Analysis
Chart Analysis
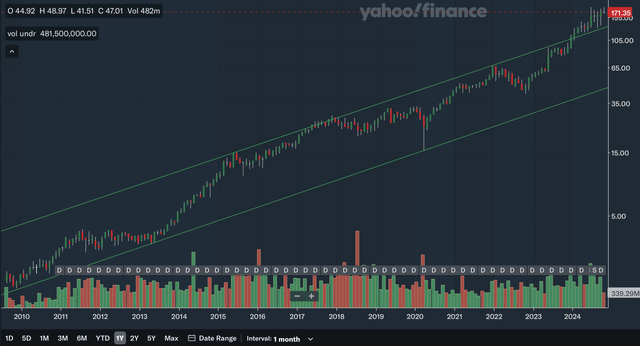
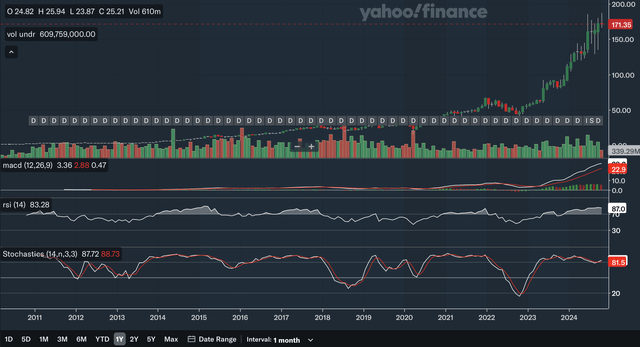
Note that the above chart is also on a logarithmic scale to better reflect Broadcom’s long-term trend. There is not too much to discuss here, but as you can see above, Broadcom is clearly in a long-term uptrend. There is an upward channel that dates back to 2010 and the stock was bound between these two lines until the stock recently broke out early this year. This upside breakout did not happen on extraordinary volume, and so there is still a possibility that this was a false breakout. Also, note that the stock has had a lot of long wicked candlesticks, almost dojis, as of late after breaking out of the channel. This could indicate there is hesitancy and weakness despite the breakout. Nonetheless, Broadcom is currently in an accelerated long-term uptrend, with the upper channel line being quite close to support. Overall, the monthly charts show a positive outlook, but in my view, investors may still want to practice caution as the breakout shows signs of weakness.
Moving Average Analysis
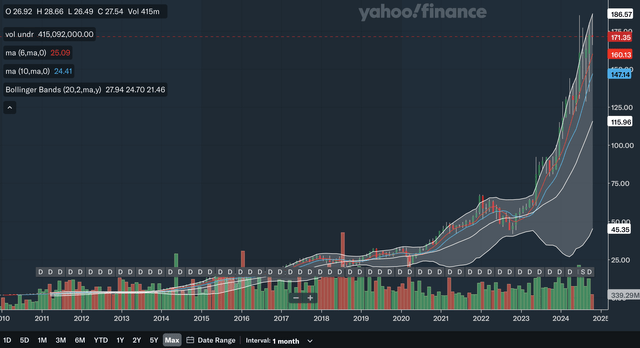
Since a bullish crossover back in early 2023, the 6-month SMA has remained above the 10-month SMA. Currently, the 6-month SMA is a healthy margin above the 10-month SMA, showing that the bulls have been resilient. The stock trades above both of the SMAs with the 6-month SMA providing relatively near support at 160 and rising. As for the Bollinger Bands, the stock recently hit the upper band, showing it was overbought, but has since receded. The stock is miles above the 20-month midline, and so there is no worry that the long-term uptrend is in danger. The stock has been consistently at the upper part of the Bollinger Bands since early 2023, showing just how strong the bulls have been. From my analysis, the long-term MAs should comfort long run investors as they confirm and support Broadcom’s uptrend.
Indicator Analysis
The monthly indicators are very different to their daily and weekly counterparts. The MACD is currently a large margin above the signal line since a crossover in early 2023, indicating strong bullish momentum. Even more importantly, the monthly MACD does not show any negative divergence as it has risen along with the stock’s advance. For the RSI, it is currently at 87, which is an overbought reading. However, stocks can remain overbought for significant periods of time and can actually indicate sustained bullish momentum. It too does not show the negative divergence, as it has been rising throughout the year. Lastly, for the stochastics, the %K just crossed back above the %D very recently, another positive signal. In addition, the stochastics has remained above the 80 zone since early 2023, showing that the bulls have been relentless. Overall, the monthly indicators are completely different to the daily and weekly ones as bearish signals are nowhere to be found here.
Takeaway
The long-term technical outlook is a much better one compared to the short and intermediate terms. All three of the long-term analyses reflect a positive picture. The charts show that the long-term uptrend is accelerating, while the MAs are clearly supporting this bull run. Lastly, the indicators show bull signals galore as all three of the key indicators show positive signs for Broadcom.
Fundamentals & Valuation
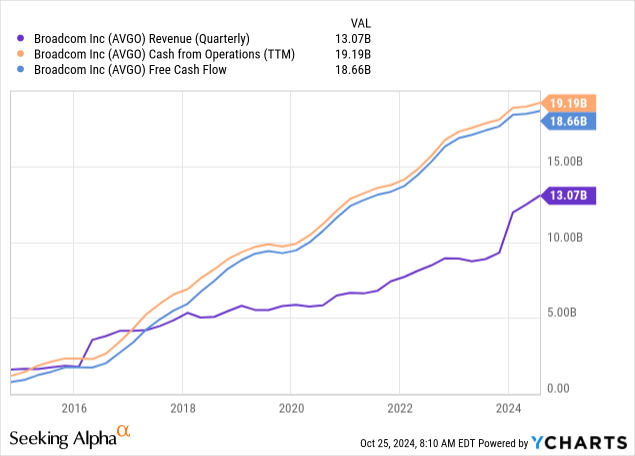
On September 5th, Broadcom released their Q3 earnings report and the figures were quite strong. They reported revenues of $13.073 billion, up 47% YoY and an adjusted EPS of $1.24, up from $1.05 in the year ago period. Both of these figures beat expectations, as revenue beat by $108.35 million and EPS beat by $0.03. As you can see in the above chart, Broadcom’s financials are continuing to head in the right direction. They also provided Q4 guidance of $14.0 billion in revenue and adjusted EBITDA equalling 64% of projected revenue. Lastly, they also issued a dividend of $0.53 per share, with the current yield standing at 1.24%. Overall, in my view, Broadcom’s Q3 earnings were strong as they saw significant growth, and they beat high expectations.
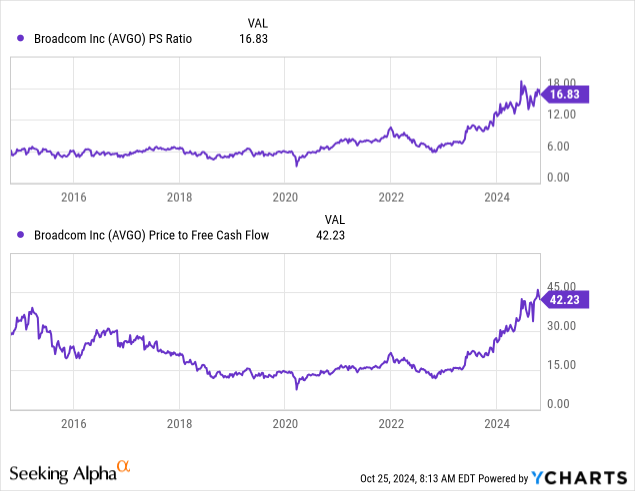
The P/S and P/FCF ratios are currently quite high by historic standards and are near a 10-year peak. The P/S ratio is currently at around 17, down slightly from the peak of over 18 set earlier in the year. The P/FCF ratio is currently at 42, down slightly from a peak of over 45 set just very recently. From the revenue and EPS chart above, it is clear that things are headed in the right direction for Broadcom’s business. However, are the growth rates high enough to justify these current valuation multiples is another question. As you can see, the rate of FCF growth is slowing down, as indicated by the flatter trajectory of the FCF line. In addition, in percentage growth terms, even revenue isn’t growing by extraordinary amounts relative to the past 10 years. This leads me to believe that Broadcom is currently moderately overvalued relative to its growth rate. Make no mistake, its business is doing fine, in fact, it’s doing better than fine as its financials continue to strengthen. But the valuation more than prices this in and with the multiples near 10-year highs, the stock certainly is not cheap. Seeking Alpha currently has a D- valuation rating for Broadcom, confirming my evaluation that the stock is overvalued. This stock should not be on the shopping list for value investors.
Conclusion
Broadcom has not dethroned Nvidia and is unlikely to do so in the near future. The short and intermediate term technical analyses had many mixed signals, despite being overall net positive. The long-term analysis was much better as the chart, moving averages, and indicators converge to a conclusion that the long-term technical outlook is bright. However, when looking at the fundamentals, the valuation is currently too rich even after considering its growth rate. Key valuation multiples are at 10-year highs and while growth is high, it is not extraordinarily high. Therefore, I draw the conclusion that its stock is overvalued. Since the short and intermediate technicals are mixed and the valuation is rich, I believe Broadcom only deserves a hold rating at this moment. Nvidia’s crown is at no risk of being taken in the near future.
Analyst’s Disclosure: I/we have no stock, option or similar derivative position in any of the companies mentioned, and no plans to initiate any such positions within the next 72 hours. I wrote this article myself, and it expresses my own opinions. I am not receiving compensation for it (other than from Seeking Alpha). I have no business relationship with any company whose stock is mentioned in this article.
Seeking Alpha’s Disclosure: Past performance is no guarantee of future results. No recommendation or advice is being given as to whether any investment is suitable for a particular investor. Any views or opinions expressed above may not reflect those of Seeking Alpha as a whole. Seeking Alpha is not a licensed securities dealer, broker or US investment adviser or investment bank. Our analysts are third party authors that include both professional investors and individual investors who may not be licensed or certified by any institute or regulatory body.

