Summary:
- Canopy Growth has received shareholder approval for its plans to enter the US THC cannabis market.
- The company’s recent Q3-2024 report shows ongoing financial recovery and success of the company’s new right-sizing strategy.
- Canopy Growth’s stock price has been on an ongoing uptrend, gaining 87% over the last three months.
- I change my previous rating of Canopy Growth from a buy to a hold.
Photography
Canopy Growth (NASDAQ:CGC) has gained 63.5% since I covered the company last September. Since then, the company underwent a reverse split and its stock price has recovered from the split. I previously rated the company as a buy and emphasized Canopy Growth’s strategy for entering the US THC cannabis market. Canopy Growth has gone forward with its plans and received shareholder voter approval this month. I will discuss the transaction and amendment to the articles of incorporation below. For now, I rate the company has a hold. Canopy Growth is undergoing right-sizing and has divested some of its subsidiaries. Although it is leading the current cannabis rally, it will take some time for the company’s financials to recover.
There has been an ongoing cannabis sector rally surrounding possible scheduling and passage of the SAFER Banking Act. It is unclear when these events will take place. Some speculate over the next year. Canopy Growth has several synergies driving investor sentiment. The most important factor concerns the company’s unique strategy for entering the US cannabis markets. Other items include its presence in Germany, since the country legalized recreational cannabis. Canopy Growth reported Q3-2024 results last February. Margins are increasing and YoY sales are increasing in the remaining operating segments. Earnings through the next two to three quarters will likely decrease. I recommend that investor watch these developments.
Canopy USA
Canopy USA was set up as a US domiciled holding company in 2022 to keep Canopy Growth’s US THC cannabis assets. Canopy USA would hold the assets until laws in the US allow Canopy Growth to hold its US THC assets directly. Canopy USA holds the assets which will allow Canopy Growth to acquire Acreage Holdings, Mountain High Products, Wana Wellness and The Cima Group (WANA brands), and Lemurian (Jetty).
In April, the company held a shareholder vote, which amended the company’s articles of incorporation to include the creation of a class of non-voting and non-participating exchangeable shares. It allows for the issue of an unlimited number of these shares. The shares cannot be traded on the market nor do they hold voting or any other rights. The exchangeable shares are categorized as multilateral financial instruments.
The other side of this transaction concerns Constellation Brands (STZ), who hold the largest number of Canopy Growth shares and some of Canopy Growth’s board seats. Constellation Brands and its subsidiaries will convert its common shares into exchangeable shares and its board seats will be vacated. Constellation Brands is a US beer, wine, and liquor manufacturer. The company manufactures Corona and Modelo beers among other famous brands.
The transaction between Constellation Brands and Canopy Growth will be beneficial to both parties. The exchangeable shares may be converted at any time into common shares. Canopy Growth had issued a promissory note to Greenstar, a subsidiary of Constellation Brands. The note has now been paid or converted into 9.1 million shares, which reduces Canopy Growth’s debt by CA$100 million. Constellation Brands and its subsidiaries will have a total of 26 million exchangeable shares.
Once Constellation Brands exits Canopy Growth’s board of directors, Canopy Growth will go forward and acquire Acreage Holdings, Wana Brands, and Jetty. Wana and Jetty will be completed during Q2-2025 and the acquisition of Acreage will be completed by the end of FY2025. The transaction gives Canopy Growth equity in its US holdings, which include brands that are present in twenty-one states and found in 2,150 retail outlets. A third party still has to put up the money to acquire the US assets. It is assumed that the non-exchangeable shares will be used as backing.
According to Canopy Growth, “Canopy Growth is expected to deconsolidate the financial results of Canopy USA and have a non-controlling interest in Canopy USA, which will be accounted for as an equity method (fair value) investment.” Shareholders voted to approve the transfer of shares which represent less than 25% of Canopy Growth’s total market capitalization. Canopy Growth estimates the US retail cannabis market to be valued at US$50 billion in 2026. Over 32 million common shares are available for conversion, representing around 35% of all issued and outstanding shares. It should be noted that other Canadian cannabis LPs have US entry strategies, for instance Village Farms (VFF), who owns and operates vegetable / produce grow facilities in the US.
Canopy Growth Operating Segments
When I last covered Canopy Growth, the company was ending its public facing recreational cannabis operations. The move was an attempt to cut down on operating costs and focus on other segments. The divesture was successful and since then, Canopy Growth has sold off other operating segments. The company sold off BioSteel and Q3-2024 is the last quarter for revenue from This Works. Accordingly, the company’s revenue number will decrease over the next few quarters. Canopy Growth focuses in its last earnings release on the improvements to its remaining segments and lower operating costs.
The remaining operating segments are as follows: Canadian cannabis (business to business sales), Canadian medical cannabis, rest-of-the-world cannabis, and Storz & Bickel. The following chart from Canopy Growth’s Q3-2024 earnings release shows the company’s revenue breakdown by segment of channel.
|
Revenue by Channel (in millions of CA$) |
Q3 FY2024 |
Q3 FY2023 |
Vs. Q3 FY2023 |
|
|
Canada cannabis / Canadian adult-use cannabis |
||||
|
Business-to-business |
$23.4 |
$21.5 |
9% |
|
|
Business-to-consumer |
$— |
$11.0 |
(100%) |
|
|
$23.4 |
$32.5 |
(28%) |
||
|
Canadian medical cannabis |
$15.6 |
$14.1 |
11% |
|
|
Total |
$39.0 |
$46.6 |
(16%) |
|
|
Rest-of-world cannabis |
$10.5 |
$5.8 |
81% |
|
|
Storz & Bickel |
$18.5 |
$20.2 |
(8%) |
|
|
This Works |
$8.2 |
$8.3 |
(1%) |
|
|
Other |
$2.3 |
$3.9 |
(41%) |
|
|
Total Net revenue |
$78.5 |
$84.8 |
(7%) |
|
The company is manufacturing WANA branded gummies for Canadian adult recreational cannabis. The products have increased its YoY sales within the segment, as well as new products from Tweed. Revenue from international sales has increased YoY due to an increase in sales in Australia and Europe. Storz & Bickel improved sales YoY with the introduction of a new series of portable flower vaporizers. Demand for the new product is outpacing supply. Total revenue for Q4-2023 across all segments is down 7% YoY and will continue to decrease with the divestment of This Works.
Q3-2024 Earnings and Q4 Outlook
|
Amount in CA$ Millions |
Q3-2024 |
Q2-2024 |
Q1-2024 |
Q4-2023 |
Q3-2023 |
|
|
Revenue |
78.5 |
69.6 |
76.3 |
73.7 |
84.9 |
|
|
Cost of Revenue |
50.3 |
46.9 |
62.5 |
103.0 |
77.6 |
|
|
Gross Profit |
28.2 |
22.7 |
13.8 |
(29.3) |
7.2 |
|
|
Operating Expenses |
53.1 |
49.8 |
57.6 |
110.2 |
82.3 |
|
|
Operating Income |
(24.9) |
(27.1) |
(43.8) |
(139.5) |
(75.1) |
|
|
Net Income |
(216.8) |
(310.0) |
(38.1) |
(711.6) |
(259.5) |
|
|
Cash / ST Investments |
188.4 |
272.2 |
573.0 |
784.3 |
797.0 |
|
|
Accounts Receivables |
87.8 |
88.0 |
142.9 |
149.6 |
214.7 |
|
|
Current Assets |
397.3 |
493.7 |
883.2 |
1,077.3 |
1,172.9 |
|
|
Total Assets |
1,359.8 |
1,668.2 |
2,190.5 |
2,439.1 |
3,020.2 |
|
|
Accounts Payable |
25.8 |
22.7 |
57.6 |
76.2 |
63.1 |
|
|
Current Liabilities |
221.3 |
196.3 |
451.2 |
803.8 |
678.7 |
|
|
Total Liabilities |
815.1 |
918.8 |
1,343.0 |
1,679.1 |
1,580.4 |
|
|
Book Value Per Share (US$) |
$4.96 |
$6.65 |
$10.19 |
$10.85 |
$21.27 |
|
|
Current |
||||||
|
NTM Total Enterprise Value / Revenues |
4.75x |
5.28x |
3.49x |
3.34x |
2.11x |
4.12x |
|
Price (US$) |
8.97 |
8.63 |
5.11 |
7.83 |
3.88 |
17.50 |
|
Total EV (US$) |
1,412.57 |
1,567.42 |
1,053.68 |
1,332.68 |
932.62 |
1,756.48 |
|
Market Cap (US$) |
907.55 |
1,062.40 |
560.62 |
769.10 |
299.18 |
1,214.96 |
Financial data from Seeking Alpha. Valuations from TIKR
For Q3-2024, Canopy Growth reported CA$78.5 million in total revenue. The number is down 7% YoY due to divestment of subsidiaries. Canopy Growth reported 36% in margins for Q3-2024. Canadian cannabis gross margins increased the most YoY, from (11%) to 28%.
Net income remains in the negative with only a slight improvement YoY. SG&A expenses have decreased YoY (from CA$90 million to CA$90 million). Operating loss has improved YoY (from negative CA$113 million to negative CA$60 million).
Adjusted EBITDA improved 82% YoY (from negative CA$50 million to CA$9 million). The improvement is credited to the reduction of operating costs. The company reported total debt as of Q3-2024 to be CA$612 million.
Canopy Growth expects a continued increase for its international sales and for Storz & Bickel to continue seeing an increase in sales. The company is still undergoing right sizing and quarterly reports till continue to show recover. Canopy Growth expects positive EBITDA in each business segment at the end of 2024. The current market consensus on the company’s Q4-2024 revenue is CA$73 million, representing a decrease YoY.
The results show better performance in its segments and higher margins. Operating costs and net loss are decreasing slowly. The recovery time will last longer and may not show much improvement until the end of 2024 or beginning of 2025. Investors would want to see an improvement in overall net loss and improvement in free cash flow. Otherwise, it looks like Canopy Growth’s right-sizing strategy has worked so far.
The company’s stock price is currently overvalued compared to its book value per share. According to its NTM multipliers, the company’s stock price is leaning toward overvaluation. Better financial performance in the future may change these metrics and make a buy signal more impressive. The company’s financial results are the main reason for the hold rating.
Stock Price Performance
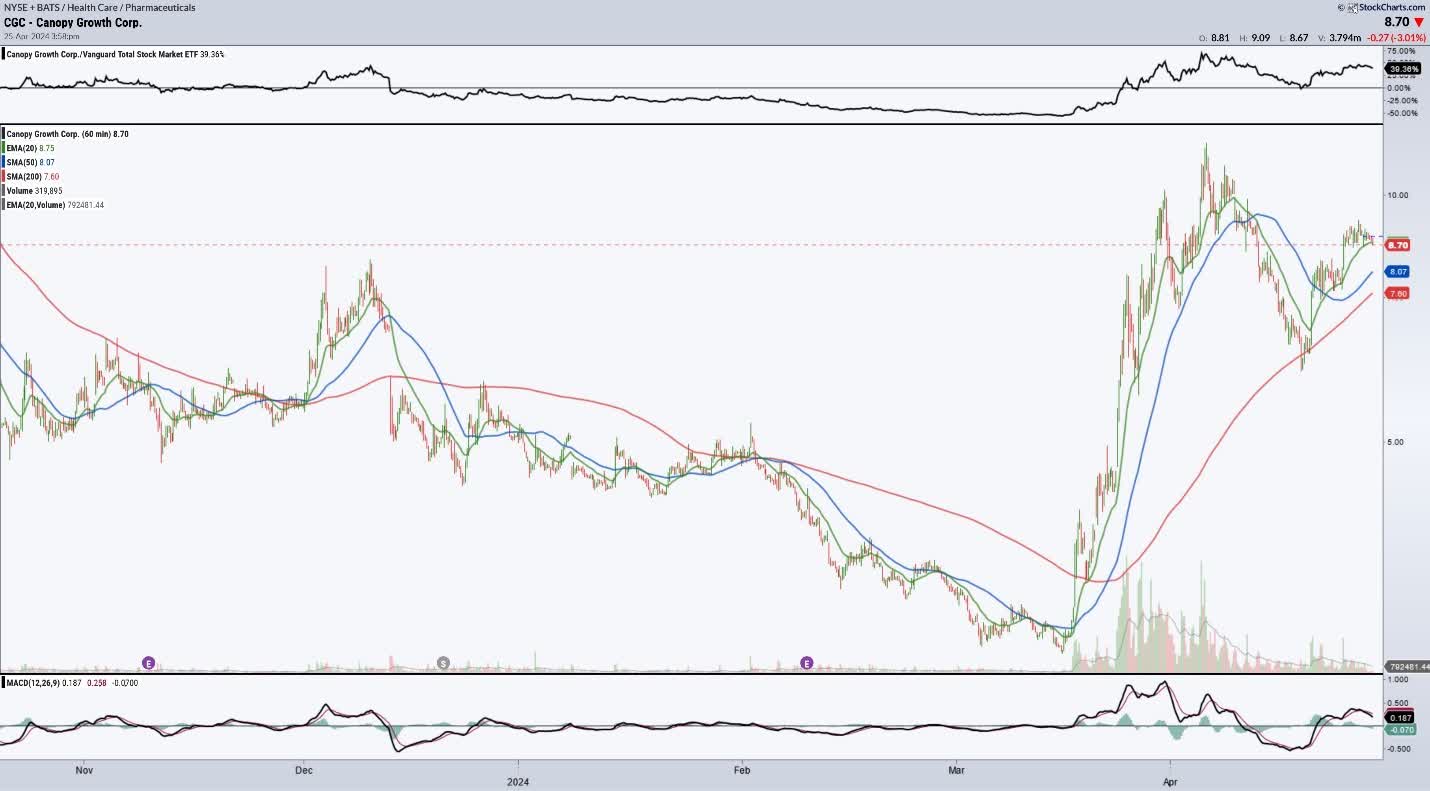
www.stockcharts.com
Six-month stock price chart from StockCharts.com
The company’s stock price has recently seen a mega rally, increasing 87% over the last three months and 50% over the last month. The stock is currently trading above its moving day averages. There is a risk that the rally will fizzle out, and the price will come back to its March lows. Although overvalued, Canopy Growth’s stock is currently at the head of the rally. The company stock is not undergoing short-squeeze conditions, and it has low institutional ownership (7%).
Momentum remains high for Canopy Growth’s stock, and there have been daily rallies. How long these rallies can go? The key events around the US cannabis markets may not happen anytime soon, thus the rally may end sooner rather than later. Caution is advised due to the company’s large quarterly net loss and recovering financial performance.
Risk and Investment
Canopy Growth is at moderate to low risk of poor financial performance. The company is well positioned within its operating segments for continued growth. If cannabis in the US undergoes legislative change, then the company’s business strategy becomes even more impressive.
A hold rating for Canopy Growth comes at a moderate to high risk. Most investors are holding on in anticipation of legislative change. The strategy is fine, but the stock price may begin a new long-term downtrend, if no other synergies occur. For now, I recommend a hold rating and that investors watch developments from the company and from the US legislatures.
Conclusion
With the recent decision from Canopy Growth’s shareholders, the company is set to enter the US THC markets earlier than expected. The company has worked long and hard at making such a deal happen. Canopy Growth has also had success in its right-sizing by divesting some of its operating segments. Financial performance for the company is not perfect, but it is improving. The company’s stock has been on an uptrend for a few months. There is high risk in buying at the top. I rate the company as a hold for now. One might refill positions when the price drops.
Analyst’s Disclosure: I/we have a beneficial long position in the shares of CGC either through stock ownership, options, or other derivatives. I wrote this article myself, and it expresses my own opinions. I am not receiving compensation for it (other than from Seeking Alpha). I have no business relationship with any company whose stock is mentioned in this article.
Seeking Alpha’s Disclosure: Past performance is no guarantee of future results. No recommendation or advice is being given as to whether any investment is suitable for a particular investor. Any views or opinions expressed above may not reflect those of Seeking Alpha as a whole. Seeking Alpha is not a licensed securities dealer, broker or US investment adviser or investment bank. Our analysts are third party authors that include both professional investors and individual investors who may not be licensed or certified by any institute or regulatory body.