Summary:
- Caterpillar has outperformed in the last 12 months, with a 52% increase in stock price as the broad market has worked off SVB-related lows.
- CAT sports strong earnings growth and a reasonable P/E ratio with optimism seen over the coming year and beyond.
- With decent EPS growth ahead and solid share-price momentum, I see continued upside ahead.
- I outline key price levels to monitor on the chart ahead of earnings due out next month.
AleMasche72
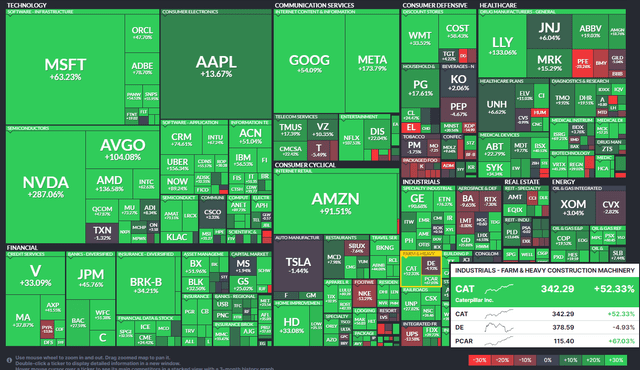
Remember that little old regional banking crisis in March 2023? The S&P 500 bottomed out precisely a year ago as of this writing. March 13th of last year was a period of systemic problems across cyclical areas of the market. While banks were the focus, many Industrials sector firms were seen as susceptible to a global economic slowdown, too. Alas, the crisis was short-lived, and the SPX has returned 36% in the last 52 weeks. Among the outperformers over the past 12 months has been Caterpillar (NYSE:CAT).
I reiterate my buy rating on a still-decent valuation amid favorable, though mildly stretched, technical trends. CAT has proven itself to be an earnings grower lately, and the P/E looking out to next year and beyond appears more than reasonable.
S&P 500 1-Year Performance Heat Map: CAT +52%
According to Bank of America Global Research, Caterpillar, the largest manufacturer/marketer of construction equipment worldwide, is also a leading manufacturer of engines and turbines for transport, energy, and industrial applications.
CAT reported a strong set of Q4 2023 results. Adjusted EPS rose 35% year-over-year, and the firm reported record EPS for the full year. Amid inventory rightsizing and solid execution, investors must still be aware of potentially slowing global economic growth that could bring about cyclical headwinds. Free cash flow is being prioritized, according to the call, but capex is expected to increase for the first time in about a decade over the coming quarters. Upside risks come from a potential turnaround in China and rising copper demand.
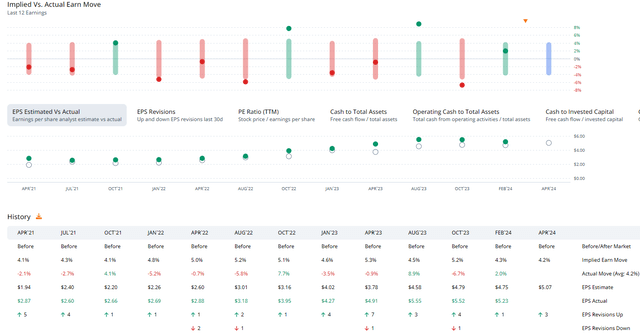
CAT has topped EPS estimates in each of the past 12 quarters, and shares traded higher post-earnings back in February. Looking ahead, data from Option Research & Technology Services (ORATS) shows a somewhat small 4.2% earnings-related stock price swing currently priced into the options market. $5.07 of per-share operating EPS is the forecast which would be a 3.3% increase from the same period a year ago.
CAT: A String of Bottom-Line Beats
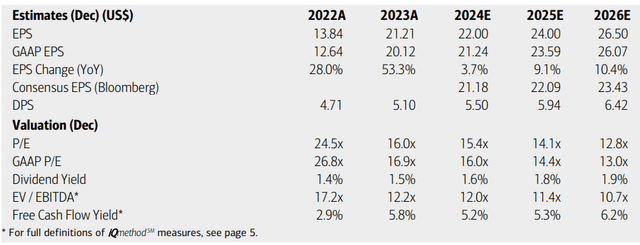
On valuation, analysts at BofA see earnings rising at a low clip this year, but then accelerating in the out year. Per-share profits are then seen jumping by 10% by 2026. The current Seeking Alpha consensus numbers show $21 of non-GAAP EPS in 2024 and more than $22 next year while revenue growth should hum along between 0% and 3%. Dividends, meanwhile, are forecast to rise at an impressive annualized rate through 2026, possibly lifting the yield from its current rate of 1.54%.
Caterpillar: Earnings, Valuation, Dividend Yield, Free Cash Flow Forecasts
If we assume $22 of normalized EPS and apply an earnings multiple of 17 given better growth trends ahead (compared to my previous analysis), then shares should be near $374, making the stock still undervalued despite the strong appreciation over recent quarters.
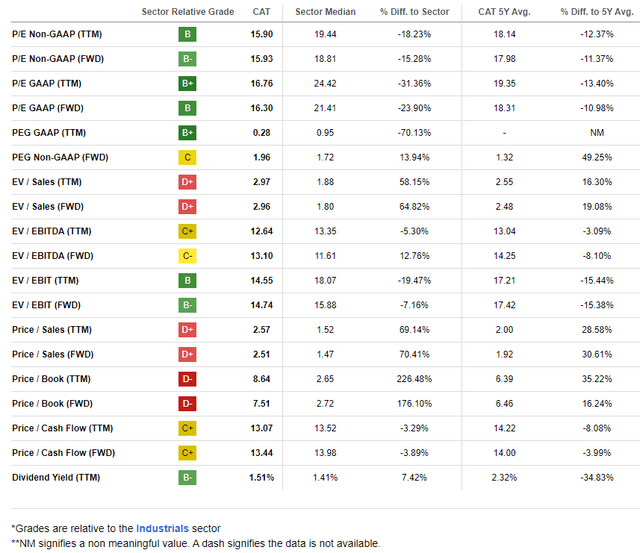
CAT: Compelling Earnings Multiples, More Pricey on Sales
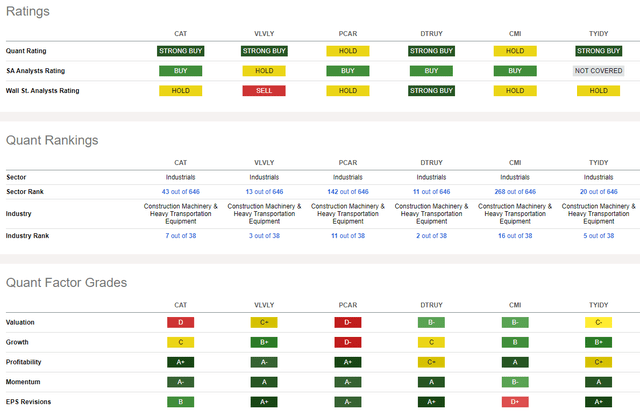
Compared to its peers, CAT sports a soft valuation rating, but compared to the stock’s 5-year average earnings valuation multiples, the current price is by no means lofty, in my view. Moreover, CAT features high share-price momentum – price action often seen in other high-growth industries, while EPS revisions have been to the positive side in the last three months. Finally, the growth outlook is not too impressive, but very healthy profitability trends is a strong point.
Competitor Analysis
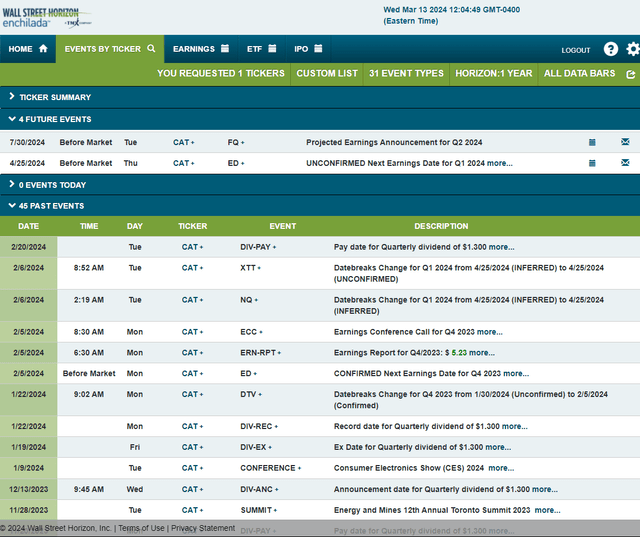
Looking ahead, corporate event data provided by Wall Street Horizon shows an unconfirmed Q1 2024 earnings date of Friday, April 26, before markets open. No other volatility catalysts are seen on the calendar.
Corporate Event Risk Calendar
The Technical Take
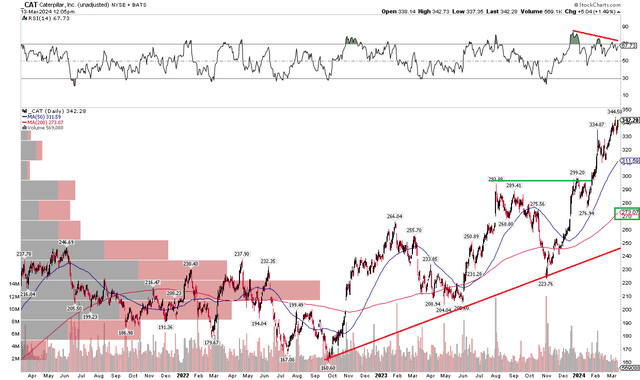
CAT appears mildly extended when inspecting the chart. Notice in the graph below that shares have rocketed higher after notching a low last November. The more than 50% increase in just four months came alongside increasing momentum, but that has since waned. The RSI momentum oscillator at the top of the chart has been printing a series of lower highs since the turn of the year. Support is seen between $294 and $299 while the long-term 200-day moving average is positively sloped, a bullish sign, but the $70 difference between today’s stock price and that trend indicator line is large.
Also, take a look at the volume profile on the left side of the graph. There’s obviously no overhead supply to halt the rally, but a significant amount of downside support is not seen until way down in the mid-$200s.
Overall, the trend is up, the weakening momentum and a significant gap down to the 200-day suggest that a near-term pullback could be in the works with support just under $300.
CAT: Powerful Uptrend, Weakening RSI Momentum
The Bottom Line
I reiterate my buy rating on CAT. The valuation appears of little concern given earnings growth and historical multiples. Technically, shares appear somewhat stretched, but we have key levels to monitor on the downside.
Analyst’s Disclosure: I/we have no stock, option or similar derivative position in any of the companies mentioned, and no plans to initiate any such positions within the next 72 hours. I wrote this article myself, and it expresses my own opinions. I am not receiving compensation for it (other than from Seeking Alpha). I have no business relationship with any company whose stock is mentioned in this article.
Seeking Alpha’s Disclosure: Past performance is no guarantee of future results. No recommendation or advice is being given as to whether any investment is suitable for a particular investor. Any views or opinions expressed above may not reflect those of Seeking Alpha as a whole. Seeking Alpha is not a licensed securities dealer, broker or US investment adviser or investment bank. Our analysts are third party authors that include both professional investors and individual investors who may not be licensed or certified by any institute or regulatory body.

