Summary:
- Caterpillar’s earnings growth is projected to be uninspiring, with a compound annual growth rate of 3.3% between FY 2024 and FY 2026.
- I see good reasons for such uninspiring projections, due to concerns about geopolitical conflicts and China’s softened demand.
- Yet, CAT stock is trading at a high valuation, with P/E and P/cash ratios far above historical averages.
MikeyGen73
Growth prospects
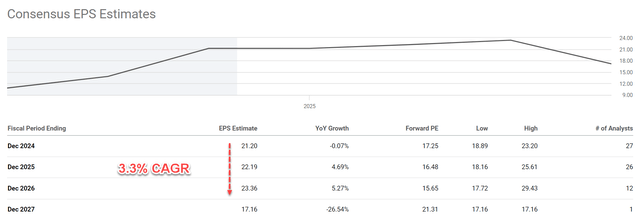
The chart below shows how uninspiring Caterpillar’s (NYSE:CAT) earnings growth is in the next 3 years according to analysts’ expectations. As seen, its EPS is projected to grow at a compound annual growth rate (“CAGR”) of 3.3% between FY 2024 and FY 2026. This translates to an EPS of $21.2 in 2024 to 23.36 in 2026. Then in 2027, a sizable decline is expected to bring its EPS back to $17.16.
I may not completely share the above consensus view (my growth projections are detailed later). But I am concerned for a couple of reasons. Besides the ongoing geopolitical conflicts (wars are never good for infrastructure projects), China’s softened demand is my main concern.
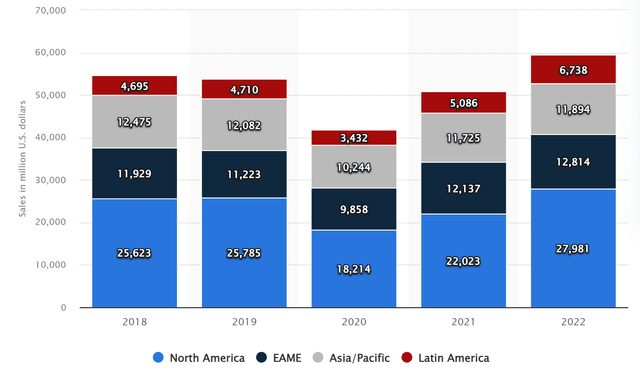
The chart below shows Caterpillar’s global sales and revenue between FY 2018 and FY 2022 by region. As seen, CAT derives more than half of its earnings from ex-U.S. markets. For example, in 2022, only about 47% of its revenue came from the North American region. The Asia/Pacific region was the third-largest market for Caterpillar as seen. CAT has reported that it expects its China sales to slow back in late 2022. In my view, the factors that caused the slowdown back then have gotten worse now and can persist longer than expected. Our thought process has been detailed earlier in another related article, and the gist is quoted below:
The real estate and infrastructure market in China kept struggling and its recent stimulus policy seems to have limited effect in my eyes so far. We are still concerned about China’s trouble in the real-estate sector, a large consumer of raw materials. We are seeing signs that these troubles are far from over, including slumping new home sales, potential default risks for heavy-weight developers, and hidden bad loan problems.
Valuation risk is too high
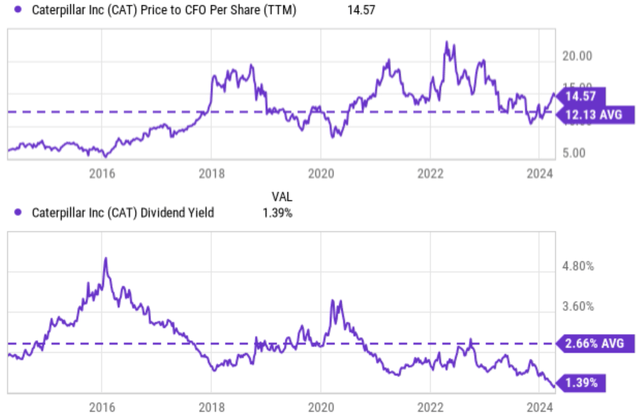
Despite the gloomy growth outlook, the stock trades at a high valuation. If you recall from the first chart above, its forward P/E ratio is estimated to be 17.25x based on 2024 estimated EPS. This then would further escalate to 21.3x in 2027 due to the earnings decline. To better contextualize things, CAT’s median P/E was around 16x only in the past decade. The valuation risks can be seen from other metrics as well. For example, as shown in the top panel of the next chart below, CAT’s current price-to-CFO ratio is 14.57x. This is also higher than its historical average of 12.13x by a sizable margin.
The most telling and extreme metric is its dividend yield in my view. As a dividend champion, it makes good sense to me to use its dividends as an approximation for its owners’ earnings. As seen in the bottom panel of the chart, CAT’s current dividend yield is 1.39%. It is only about half of its historical average of 2.66% and is at the lowest level in a decade.
Uninspiring return projections
The combination of low growth and high valuation multiple has resulted in an unfavorable return profile in my view. As just mentioned, CAT is a dividend champion, with consistent dividend increases for more than 25 years. Therefore, I think it is a good place to apply the discounted dividend model (“DDM”) to assess its return potential. To be on the more generous side, I will use a two-stage DDM model, with a higher growth rate in the first stage to capture its past growth record and the second stage to capture its terminal growth. As detailed in my earlier article:
There are a total of 3 key parameters in the 2-stage DDM: the discount rate, the growth rate in stage 1, and the terminal growth rate. For the discount rate, I relied on the so-called WACC, the weighted average cost of the capital model. The discount rate for CAT is about 9% on average in recent years following this model.
For the growth rate in the 1st stage, I will extrapolate its dividend growth in the past (see the chart below again because I regard its dividend as a reliable indicator of its true owners’ earnings).
As seen, CAT’s dividend growth has been around 8% in the past 10 years. To wit, over the past 3 years, the dividend growth rate has been lower at 7.37%. Looking further back, the dividend growth rate over the past 5 and 10 years has been 8.70% and 8.20%, respectively. To be on the generous side, I will assume it can continue growth at 8.7% for the next 10 years.
My method for estimating the terminal growth rates is also detailed in my other articles. The results are that:
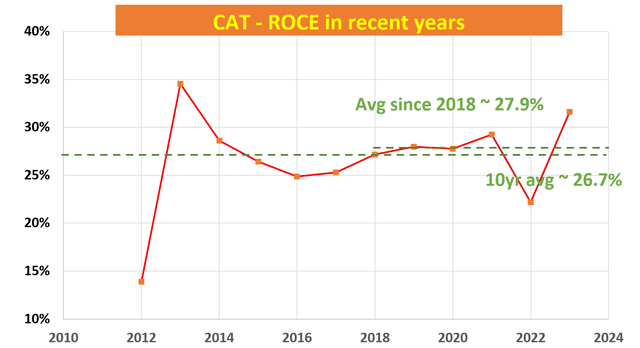
The method involves the return on capital employed (“ROCE”) and the reinvestment rate (“RR”). The ROCE for CAT has been around 27.9% in recent years as seen in the chart below. Its RR is about 10% on average. With these inputs, CAT’s perpetual growth rate would be ~2.8% (27.9% ROCE x 10% RR = 2.8%). Note this number is the real growth rate without inflation. To obtain a notional growth rate, one would need to add an inflation escalator. Assuming an average inflation of 2.5% would bring the terminal growth rate to 5.3%.
With all the inputs ready, the last table in this section summarizes the results from the 2-stage DDM. Here I used its FWD dividend of $5.2 per share. The bottom line is that this model shows that the fair price of CAT is around $199. Compared to its current price of $365, I am just seeing too much valuation risk here.
Other risks and final thoughts
The article won’t be balanced without mentioning the upside risks. The top upside risk in my mind is the U.S. government-funded infrastructure investments. The government’s emphasis on updating the country’s basic infrastructure could provide a healthy pipeline of projects in the domestic market. However, it is quite uncertain in my view and the U.S. market’s contribution to CAT’s revenue streams is limited. Another upside risk involves its Energy & Transportation segment. I expect this segment to be in good shape, with solid overall order levels from the gas and power generation categories. Readers familiar with my writing know that I am, in general, positive about the energy sector under current conditions. Finally, in the longer term, the company is working on digital capabilities, autonomous systems, and the next generation of heavy equipment, which might help to fuel growth and improve its margins.
All told, my overall view is that CAT may present a good case for short-term momentum traders. It also makes a good hold case for existing investors who are truly committed to the long term and wait for its fundamentals to catch up with valuation. As a potential investor, I think the valuation risks are too high under current conditions.
Analyst’s Disclosure: I/we have no stock, option or similar derivative position in any of the companies mentioned, and no plans to initiate any such positions within the next 72 hours. I wrote this article myself, and it expresses my own opinions. I am not receiving compensation for it (other than from Seeking Alpha). I have no business relationship with any company whose stock is mentioned in this article.
Seeking Alpha’s Disclosure: Past performance is no guarantee of future results. No recommendation or advice is being given as to whether any investment is suitable for a particular investor. Any views or opinions expressed above may not reflect those of Seeking Alpha as a whole. Seeking Alpha is not a licensed securities dealer, broker or US investment adviser or investment bank. Our analysts are third party authors that include both professional investors and individual investors who may not be licensed or certified by any institute or regulatory body.
As you can tell, our core style is to provide actionable and unambiguous ideas from our independent research. If you share this investment style, check out Envision Early Retirement. It provides at least 1x in-depth articles per week on such ideas.
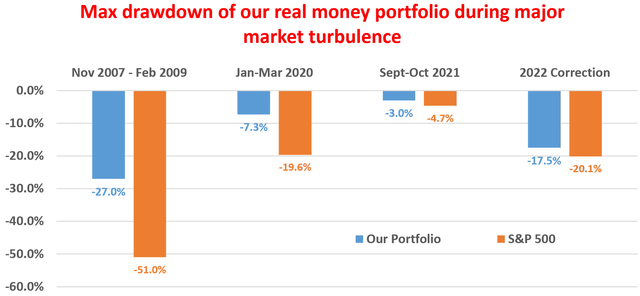
We have helped our members not only to beat S&P 500 but also avoid heavy drawdowns despite the extreme volatilities in BOTH the equity AND bond market.
Join for a 100% Risk-Free trial and see if our proven method can help you too.
