Summary:
- Historical downcycles for Caterpillar have lasted 3-7 quarters with average drawdowns of ~32% while consensus currently models flat YoY revenue for 24E.
- I see material downside to consensus as US construction activity normalizes, driven by weak recent billings and a restricting rate environment.
- Despite macro pressure, CAT is in a much stronger shape than during the last downcycle which should protect margins and ROCE. Buybacks to also support EPS by ~7% through 26E.
- With substantial downside risk I see an unfavorable risk/reward at current prices and initiate shares at Underweight and a YE24 price target of $280/sh.
David McNew/Getty Images News
Caterpillar (NYSE:CAT) is the premier global manufacturer of heavy machinery, making its topline highly sensitive to US and global macros, particularly in construction and mining. With the market expecting roughly flat sales for 24E/25E, I see downside potential to consensus, driven by an inflecting construction cycle, lowering capex in mining and a potential “higher for longer” rate environment. Downcycles for CAT have historically lasted 3-7 quarters, with average peak-to-trough sales declines of ~32%. Following initial negative quarterly sales growth in Q1, I estimate further weakening sales, potentially troughing by early-mid 25E. Lack of 2024 rate cuts could be a key downside catalyst, with interest rates historically correlated to US construction activity.
While I see sales coming under pressure in the coming quarters, the underlying business has seen significant structural improvements, which should help stabilize margins through the downturn. Share buybacks have historically also been a key instrument for CAT management to support EPS through cyclical downturns. Through YE26, I expect around $15B in buybacks at 100-80% FCF payout ratios to provide on average a ~7% uplift to EPS.
I initiate CAT shares at Underweight, with a price target of $280/sh, as I see a negatively skewed risk/reward, with plenty of downside catalysts, while upside seems limited. I do note however that this reflects a relatively short term view and in the long term, CAT will likely be a key benefactor of growing global infrastructure spending and relative scarcity value as a best-in-class pick in the construction industry.
[Note: Peers are Kubota (OTCPK:KUBTY) and Komatsu (OTCPK:KMTUY). All financial information from CAT’s most recent 10-K and Q1 24 earnings release.]
Key Investment Thesis
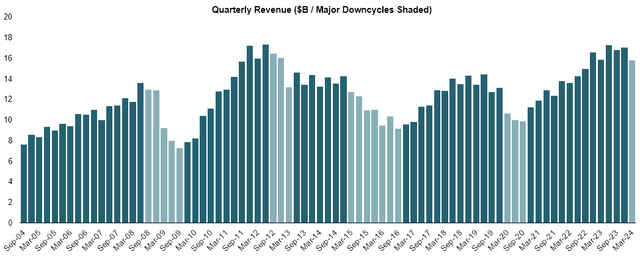
Previous downcycles have lasted 3-7 quarters with a peak-to-trough sales decline of ~32%, while consensus calls for flat 24E sales. Looking back to 2004, I find the average downcycle (start defined as two consecutive negative growth Qs) for CAT lasted 3-7 quarters. Large downturns occurred during the GFC (4 Qs) and from 2015 to 2016 (7 Qs) while 2012 and Covid saw shorter ones of 3 Qs. Average peak-to-trough (“P2T”) decline in quarterly sales was around 32%, with smaller losses during Covid and 2012 and a substantial almost 50% P2T following the GFC.
| Cycle | Length (Quarters) | Peak to Trough |
| Sep08 – Sep09 | 4 | -46% |
| Sep12 – Mar13 | 3 | -20% |
| Mar15 – Sep16 | 7 | -36% |
| Mar20 – Sep20 | 3 | -25% |
| Average | 4 | -32% |
With negative QoQ growth for Q1 24 and assuming a historical downcycle pattern, CAT could see negative growth rates well into early 2025. Consensus meanwhile remains highly optimistic, projecting sequential growth in Q2 and a full year decline of just 1% for full year 24E.
Company Filings, WSR Estimates
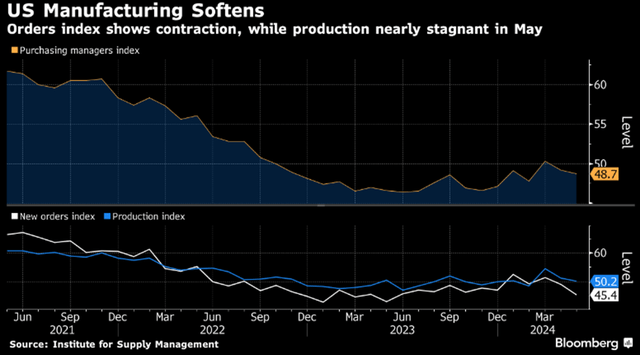
I see a downside to the consensus, as the PMI went back into contraction territory in April and continued its downward trend in May. Further deceleration in manufacturing orders could put pressure on CAT’s topline, as the US remains its most exposed end market.
Consensus further looks optimistic, considering that construction industry researcher Off-Highway Research expects a global 8% fall in construction equipment revenues for 2024, followed by a flat 2025, as China gains offset weakness in other regions. For North America specifically, the agency projects a ~10% drop in 2024 sales.
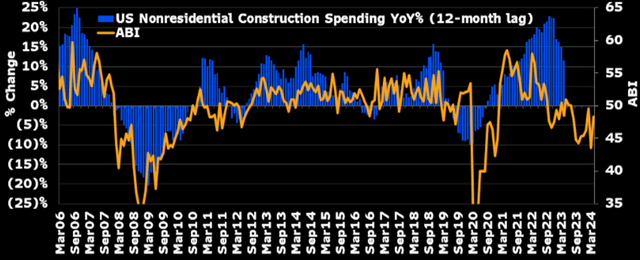
US construction spending remains elevated vs pre-Covid, billings and potential “higher for longer” rates suggest downside. I also see downside to consensus estimates coming from a weakening/normalizing growth in US domestic construction spending. In March, the Architecture Billings Index (“ABI”) dropped to its lowest since Dec 20. It climbed in April, but the index continued to be in <50 contraction territory for the 9th consecutive month. With the ABI usually being a 3-4 quarter forward indicator for nonresidential construction spending, I see a substantial negative downside to construction spending growth.
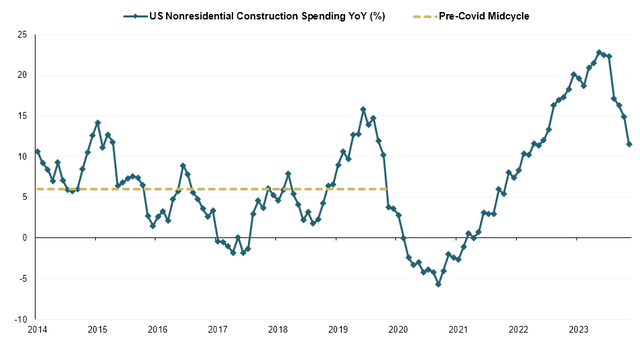
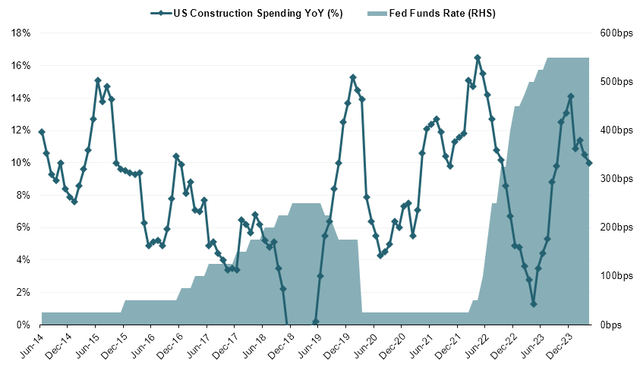
Following an unprecedented run following the Covid trough, US nonresidential construction spending seems to have rolled over in early 2024, after making a record high for the decade at ~23% YoY growth in late 2023. Despite the recent declines however, I note that spending growth continues to remain elevated relative to the pre-Covid period from 2014 to 2020. Estimating a midcycle growth of ~6% annually, current LTM growth of 12% remains almost double that of historical levels, which, against a weakening macro backdrop and with billings in clear contraction territory, appears elevated.
I also see a downside coming from the interest rate environment. At over 500bps, the Fed Funds Rate remains unchanged for almost a year and clearly above previous decade levels. I note that US total (resi+nonresi) construction spending and interest rates have historically been negatively correlated (-0.19), as higher financing costs are typically a drag on private residential and public infrastructure projects. While widely anticipated by the market, the Fed currently remains open as to whether it will cut rates during 2024, holding rates at steady levels following the June FOMC meeting. Should rates remain elevated in a “higher for longer” scenario, I can see substantial pressure on construction spending, which should rerate forward expectations for the construction equipment OEMs.
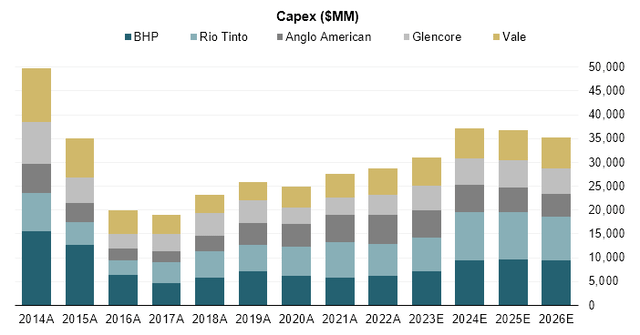
Mining capital spending seen slowing down at all majors, and industry-wide post 24E. Being a significant contributor to CAT’s topline at ~20%, lower projected capital expenditures in the mining industry are also a headwind. While projecting a 20% growth in 24E capex across the major miners, consensus sees spending weakness from 25E onwards, with a largely flat 25E and a 4% anticipated drop in 26E. Driven by strong copper prices, BHP and Rio are estimated to contribute the majority in 24E capex expansion, while Vale and Glencore are expected at MSD-HSD. Anglo is a net negative contributor, with capex seen falling by 1%.
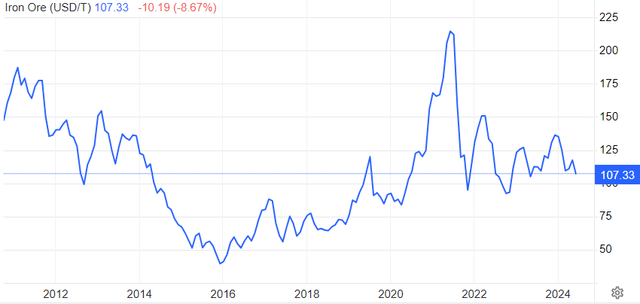
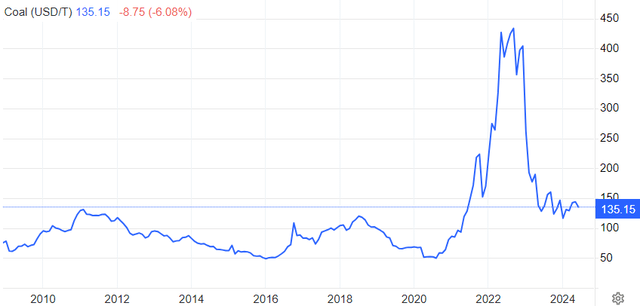
Notably, as copper boosts spending at the international majors, overall 24E industry capex is projected to grow at a slower pace (6%), before retreating by 2% and 6% during 25E and 26E, as lower prices for many base materials (iron ore/coal) deter large investments. With a slowdown in capex for miners, I see substantial downward pressure on the Resource Industries segment in the near term, following the run-up post 2020.
Bloomberg Tradingview Tradingview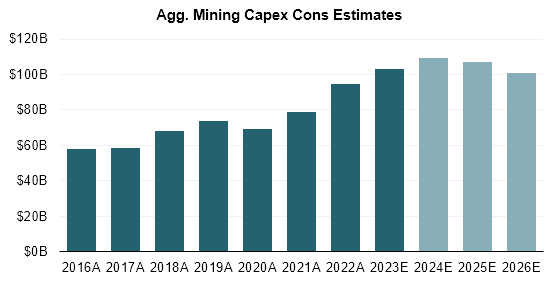
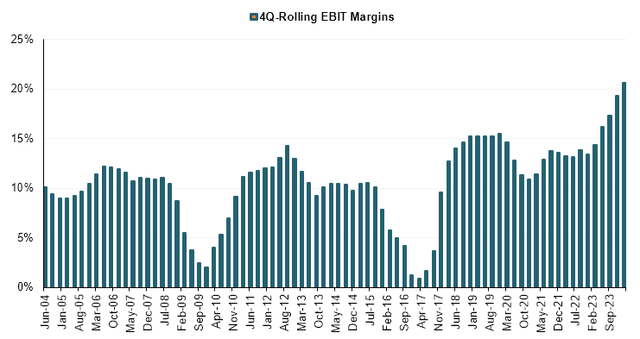
Despite topline risks, recent structural improvements should support margins vs prior cycles. While I see downside to consensus for CAT’s sales over the coming Qs, I note that the business has fundamentally improved significantly since the last major downcycles in 2009 and 2017. Both times, LTM operating margins fell from ~10% to almost breakeven, dragging Returns on Capital Employed (“ROCE”) into negative territory. Compared to 2011/2012 which saw comparable amounts of sales, recent quarterly margins have been on average 500-1000bps higher, due to both a rising mix of higher-margin service revenues and overall structural improvements in headcount, efficiencies and technology adoption.
This has also been visible in ROCE which, since around 2017, has continued to expand vs. broadly flat competitors. While historically being roughly in line with Komatsu and Kobuta, in recent times CAT has significantly outperformed on capital efficiency, with trailing ROCE almost 2x of peers (~50% vs ~15%). I estimate that this profitability gap, together with unmatched size (mkt cap of ~$160B vs. peers at ~$25B) underlines CAT’s scarcity value for investors seeking exposure to the global construction industry, driving a significant ~40% premium on forward P/E (15.1x vs 10.8x peer average).
Company Filings Company Filings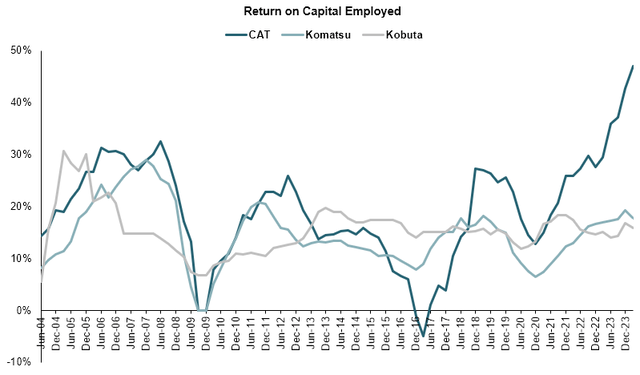
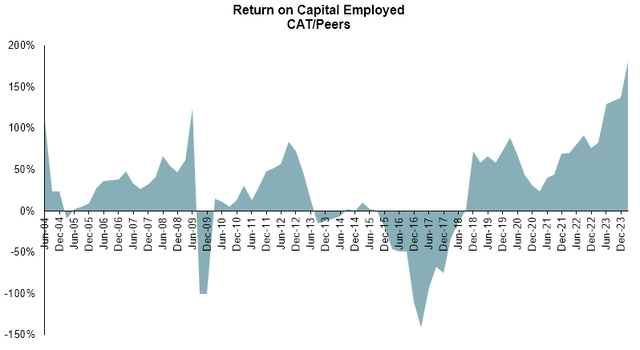
Even as sales might come under pressure, I believe those structural improvements in margins and capital efficiency should support CAT through an eventual downcycle. While both margins and ROCE are likely to fall from current record levels, should sales deteriorate, a fundamentally much stronger business should provide a significantly higher base profitability vs. previous cycles.
Capital allocation remains a key competitive advantage, buybacks to provide ~7% uplift to EPS over 24-26E. Similar to Deere (see my note here), one of CAT’s key strengths and competitive advantages is its highly shareholder-friendly capital allocation. While sales and margins remain exposed to volatile economic conditions, substantial share buybacks and stable dividend growth have greatly supported earnings and shareholder returns through the cycle. Looking back the past 20 years, CAT generated $125B in CFO and $66B in FCF, of which it allocated $30B towards dividend and spent $32B on buybacks. At $62B in total, this implies ~93% of FCF and ~49% of CFO have been used towards distribution to shareholders, ratios similar to Deere and comparable with current policies at the US supermajors.
I estimate those $32B in buybacks to have, on average, supported EPS by MDD over the past 20 years, rising to 20% in the past decade, with FY23 actual EPS of ~$20 roughly 34% above constant share EPS of ~$15.
Company Filings, WSR Estimates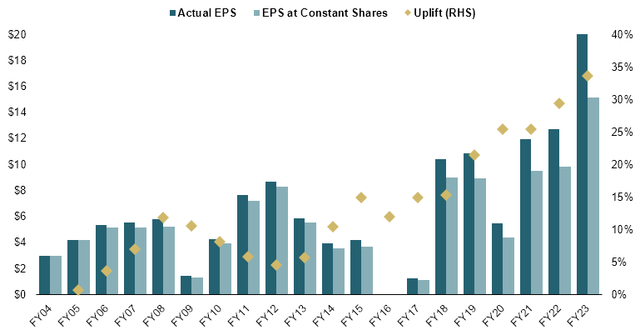
On June 12, the company also boosted its outstanding buyback authorization by $20B to a total of $21.8B. Management also announced earlier that during 24E, the entirety of ME&T free cash flow would be distributed to shareholders.
I estimate $8.4B/$8.0B and $9.1B in ME&T free cash and assume payout ratios of 100%/90%/80% through 26E, as well as gradually rising dividend payments. This implies ~$15B of buybacks, well in the scope of the current authorization and with potential upside through higher expected cash flows. Through YE26 I therefore model ~9% in share count reduction, which lifts EPS over the period by 7% on average.
Company Filings, WSR Estimates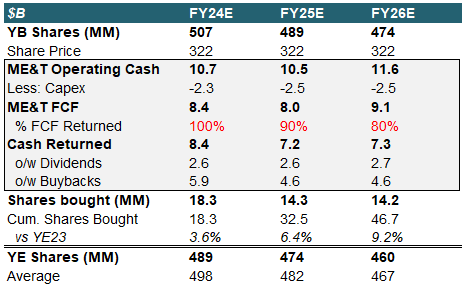
Valuation
I value CAT based on a 1Y-forward multiple on 25E EPS which, I believe, is appropriate relative to my belief that we might be in the very early innings of an eventual downcycle, and thus cannot see a valuation on 26E as I assumed for Deere.
On financials, I model a modest -3% decrease in group level revenue for 24E, followed by a flat 25E. This is largely driven by 10% and 5% decline estimates for Construction, in line with my assumption of a broadly weakening macro backdrop. I also estimate a gradual decrease in Resources, driven by tightening capital spending expected across the mining majors and the wider sector. Energy & Transportation is the only segment where I see positive near term growth, as oil prices and demand remain elevated. I also see margins contracting broadly, albeit remaining well above FY21/22 levels, highlighting structural improvements in the underlying business. At constant tax rates and minority interests as well as incorporating my assumptions for share count, I estimate 24E EPS down ~8% to $18.5, up marginally for 25E to $18.7.
CAT Model (Company Filings, WSR Estimates)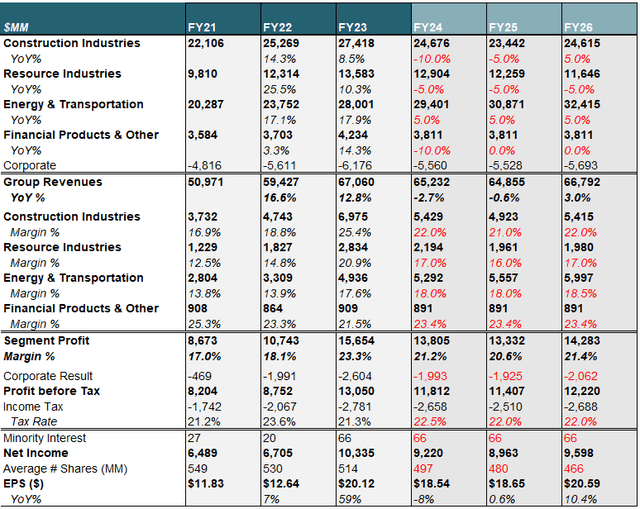
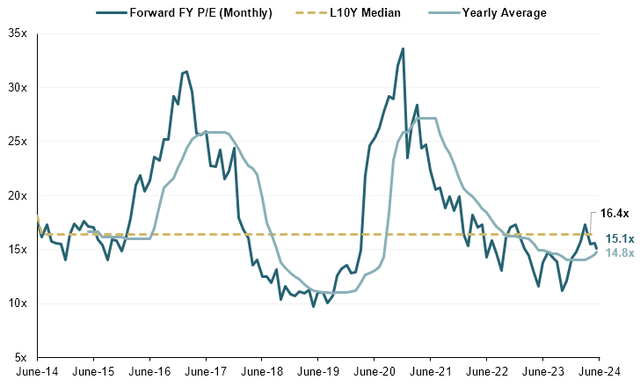
I value shares at a 15x multiple, which is roughly where shares currently trade at on a 1Y forward basis and also in-line with yearly averages. I note that median multiples since 2014 were around 16.4x, however I believe that those are slightly skewed to the upward, given overextended multiples during cyclical troughs.
Applying a 15x forward P/E multiple to my $18.65 in 25E EPS estimate, I calculate a YE24 price target of $280/sh, implying ~13% downside from current levels.
Editor’s Note: This article discusses one or more securities that do not trade on a major U.S. exchange. Please be aware of the risks associated with these stocks.
Analyst’s Disclosure: I/we have no stock, option or similar derivative position in any of the companies mentioned, and no plans to initiate any such positions within the next 72 hours. I wrote this article myself, and it expresses my own opinions. I am not receiving compensation for it (other than from Seeking Alpha). I have no business relationship with any company whose stock is mentioned in this article.
Seeking Alpha’s Disclosure: Past performance is no guarantee of future results. No recommendation or advice is being given as to whether any investment is suitable for a particular investor. Any views or opinions expressed above may not reflect those of Seeking Alpha as a whole. Seeking Alpha is not a licensed securities dealer, broker or US investment adviser or investment bank. Our analysts are third party authors that include both professional investors and individual investors who may not be licensed or certified by any institute or regulatory body.
