Summary:
- Cisco is a high-quality, investment-grade company, an excellent addition to any portfolio.
- The company is undervalued based on Cash Flow Returns on Investments valuation and conventional PE valuation.
- Cisco has a long history of improving margins, share buybacks, and returning value to shareholders.
- We initiate with a buy rating.
Alexander Koerner
Cisco Systems, Inc. (NASDAQ:CSCO) can be an excellent anchor to any portfolio. It has a long history of strong and improving returns, along with a dividend yield of over 3%. It is currently looking undervalued using Cash Flow Returns on Investments based on DCF valuation. We initiate with a buy rating.
We use a unique Cash Flow Returns on Investments-based perspective to identify and examine companies. More information on how Cash Flow Returns on Investments are calculated, including gross cash, gross assets, and returns can be found in Bartley Madden’s paper “The CFROI Life Cycle“. Bartley Madden has contributed significantly to the Cash Flow Returns on Investment methodology.
The Company
CSCO reports operations under two categories, Products and Services. 76% of its revenues come from its Products segment and 24% from services. Of the $57bn in revenues, 58% is generated in the Americas, 27.5% from the EMEA, and the remaining 14.5% from Asia. Half of the total revenues are from their core networking offerings related to switching, enterprise routing, wireless, and computing. R&D expense as a ratio of revenues was over 13% for the year ending July 2023 and 2022.
Financials
CSCO is not a high-growth company, but it is highly productive and cash-generative. This is achieved by being the dominant player in the network products segment.
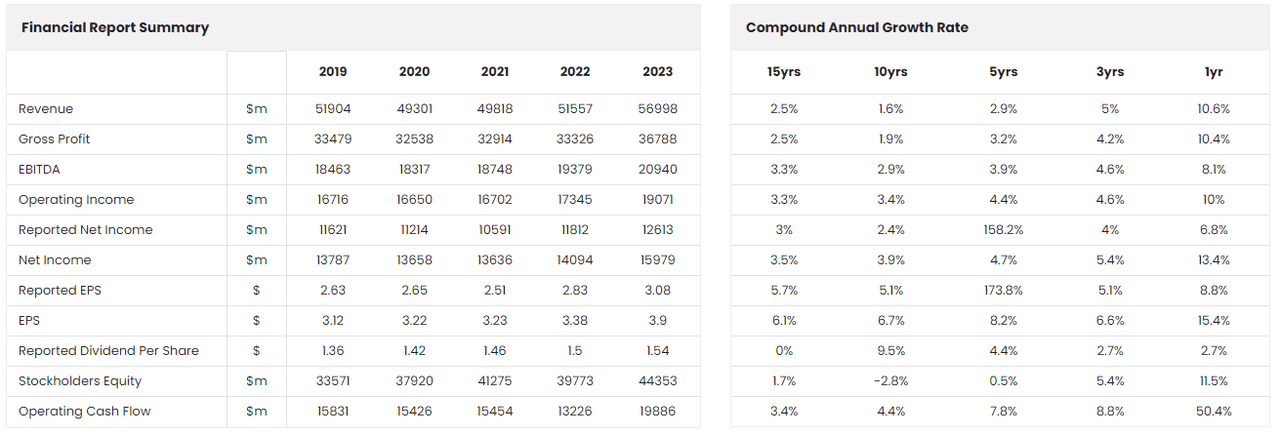
CSCO Financial Report Summary (ROCGA Research)
The 15-year CAGR for revenue has been a respectable 2.5%, but net income grew slightly higher by 3.5%, and EPS grew by 6.1%. This points to improving margins and share buybacks.
CSCO & S&P 500 Performance (ROCGA Research)
The modest growth and improving margins enabled CSCO to outperform the S&P500 over the past 10 years.
Let us now turn to the financial dynamics that help create value. We will attempt a DuPont-like breakdown by splitting the key drivers of value: growth, margins, are returns. We will have a look at how these components contribute to Returns On Cash Generating Assets (an economic measure based on the same methodology as Cash Flow Returns On Investments). Asset turnover is the amount of assets (investment) required to generate revenues. Higher asset turnover means that more revenues were generated using less invested capital.
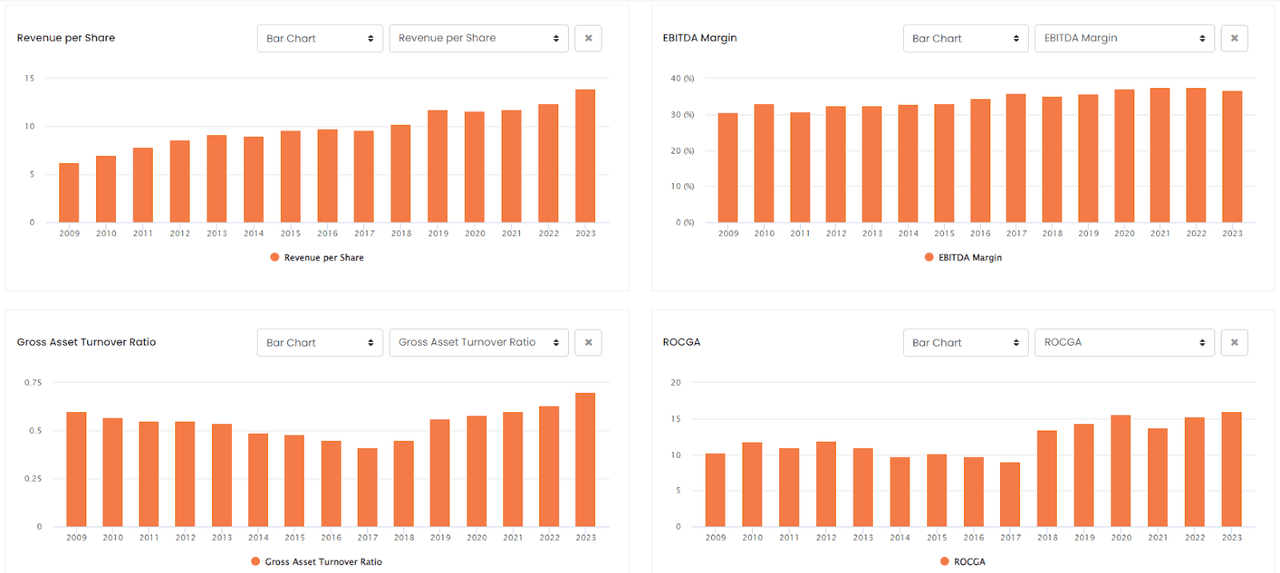
CSCO Value Drivers (ROCGA Research)
Revenue per share grew steadily from $6.2 in 2009 to $13.9 in 2023, and EBITDA margins steadily increased from the lower end of 30% to the high-30s. Gross assets improved from 0.6x to 0.7x and the resulting returns (ROCGA) have improved over time.
Over the past 15 years, the company has also reduced the shares outstanding by an average of 2.5% year after year while dividend yields have also been a respectable 2%-3%. Via share buybacks and dividends, as much as $69bn over the past 5 years and $113bn over the past 10 years have been returned to shareholders. The share price 10 years ago in 2013 traded in a range of $25.9 to $15.7. $21.2 per share has been returned to shareholders since 2013.
The company has also managed to strengthen its balance sheet. Total debt stood at $16.2bn, in 2013, and as of July 2023, total debt was down to $9.4bn and also had $26bn cash on hand, leaving it with a net cash position of $16.7bn. Let us not forget this has been accomplished while $113bn was returned to shareholders. 2023 debt to EBITDA stood at a very comfortable 0.4x and net debt to EBITDA of -0.8x.
The year ending July 2023 saw revenues increase at a faster rate of 10.6%. Margins also increased and EPS increased 15.4%. In our opinion, the strong revenue increase was due to the built-up demand over the Covid lockdown period. Revenue from 2018 to 2022 saw very little increase, from $49.3bn to $51.6bn, a total of only 4.5% over 4 years.
Q1 results ending Oct 2023 saw revenues increase 8% to $14.7bn and non-GAAP EPS up 29% to $1.11. However, share prices closed down 10% with shareholders disappointed with the reduced FY24 guidance. Revenue guidance was lowered from $57.0bn – $58.2bn to $53.8bn – $55.0 and EPS from a midpoint of $3.25 to $3.02.
Cisco saw a slowdown in new product orders in the first quarter of fiscal 2024 and the main reason given by management was that customers were installing and implementing products that were delivered over the last couple of quarters. The orders placed post-Covid are still being integrated. We believe this is transitory and does not affect the long-term prospects of the company. Consensus also expects revenues and earnings growth to resume.
In September 2023, CSCO announced the acquisition of Splunk for approximately $28bn in equity value. The acquisition is expected to be cash flow positive, help improve gross margin in the first year, and be on-GAAP EPS accretive in the second year. Together, they can help clients better detect and prevent threats. With cash and investment of $23.5bn and very little leverage, the acquisition will not have a negative impact on CSCO’s balance sheet.
Some basic risks exist, predominantly growth may remain sluggish for longer than expected. A macroeconomic slowdown will prolong the low growth period. With the pending acquisition of Splunk, integration risks exist as synergies might not be fully realized or integration does not go to plan.
Cash Flow Returns On Investments Valuation
Going back to our value drivers: growth, margins, and efficiency, and how they interact to affect returns can be seen below. The ROCGA graph below includes the company’s outlook for FY24 and the consensus estimates of EPS for the following years. For the forecast years, we can see returns will remain high.
CSCO Returns On Cash Generating Assets (ROCGA Research)
Higher growth, better margins, and improving asset turnover, particularly from 2018 onwards help increase returns significantly.
To value a company, we use our affiliate ROCGA Research’s quantitative Cash Flow Returns On Investments based on DCF valuation tools. The first step involves modeling the company, back-testing the valuation for correlation with the historical share prices, and once confident, using that same model to forecast forward.
Value is a function of returns a company achieves, the rate of fade of those returns to the cost of capital, and growth. The company’s total value is the present value of existing assets and the present value of growth. For mature companies, most of its value is in the existing assets, and for high-growth companies, the value is in the present value of growth assets.
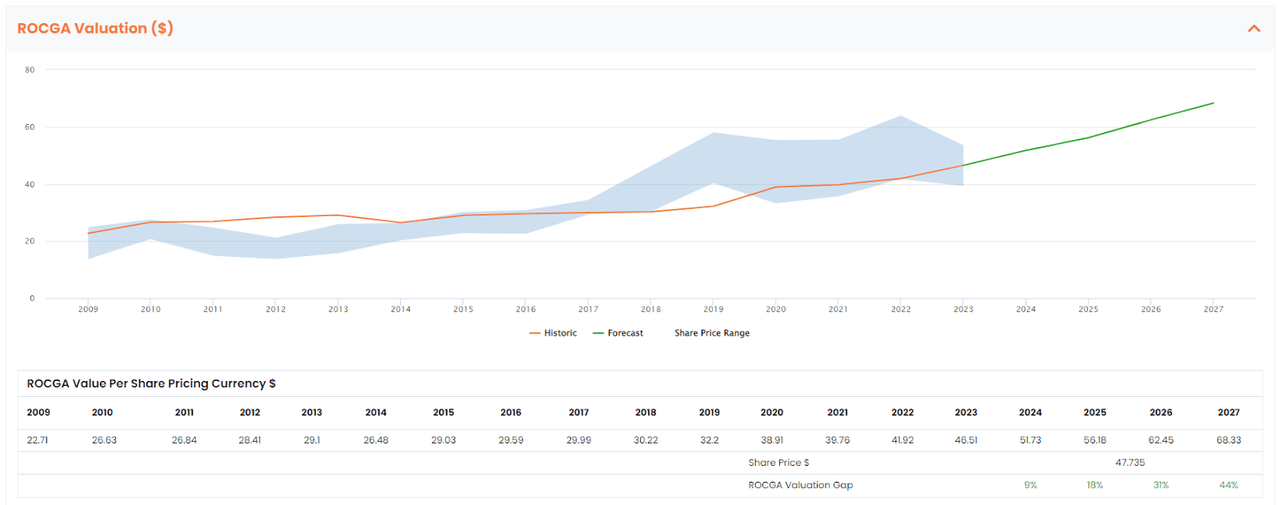
Default ROCGA Valuation (Chart created by the author using ROCGA Research platform)
The blue band above represents the share price highs and lows for the year, and the orange line is the DCF model-driven historic valuation. The green line is the forecast warranted value derived using the same model along with consensus earnings and default self-sustainable organic growth. Self-sustainable organic growth is a ratio of investible free cash to gross assets.
With constant growth, strong margins, and improving efficiency, historically, the warranted value per share has increased regularly. Given the consensus outlook, we expect the warranted value per share to improve further. We expect a warranted value to be $52 per share for FY24 increasing further to $56 for FY25.
We come to the same outcome using a more conventional PE valuation ratio. FY24 PE is 12.3x and given the current share price, CSCO is trading at a discount to the 10-yr average PE ratio of 13.6x. If we use 13.6x as a guide, the target price should be $52.7, with a potential upside of 10%.
Conclusion
The default valuation and returns chart both highlight CSCO as a quality company with a strong history. It is trading at a discount to its historic PE averages and from cash flow returns on investments based on DCF analysis. We initiate with a buy rating.
Analyst’s Disclosure: I/we have no stock, option or similar derivative position in any of the companies mentioned, and no plans to initiate any such positions within the next 72 hours. I wrote this article myself, and it expresses my own opinions. I am not receiving compensation for it (other than from Seeking Alpha). I have no business relationship with any company whose stock is mentioned in this article.
Seeking Alpha’s Disclosure: Past performance is no guarantee of future results. No recommendation or advice is being given as to whether any investment is suitable for a particular investor. Any views or opinions expressed above may not reflect those of Seeking Alpha as a whole. Seeking Alpha is not a licensed securities dealer, broker or US investment adviser or investment bank. Our analysts are third party authors that include both professional investors and individual investors who may not be licensed or certified by any institute or regulatory body.
