Summary:
- When compared to other well-established tech companies shares of Cisco look undervalued as they trade at 12.13x FCF.
- CSCO hasn’t sacrificed profits for growth and, over the past decade, has grown its annualized revenue by $6.3 billion (12.94%) and its net income by $1.49 billion (14.9%).
- The company has rewarded shareholders through a robust capital allocation program and repurchased 24.83% of the shares outstanding since the end of 2013.
- CSCO has also provided shareholders with 11 years of annualized dividend growth and currently yields 3.13%.
Alexander Koerner/Getty Images News
Cisco Systems (NASDAQ:CSCO) is the quintessential example of past performance not being indicative of future gains when it pertains to stocks. During the dot-com era, CSCO was leading the charge, and Credit Suisse First Boston analyst Paul Weinstein called Cisco “potentially the first trillion-dollar market cap company” as it rose to the 2nd largest company behind Microsoft (MSFT). It’s now 23 years later, and shares of CSCO never recaptured their previous prestige or reached their previous highs. CSCO never reached the $1 trillion mark, and shares of CSCO trade for well under the $80 they reached in March of 2000, despite growing its revenue by $35.97 billion (190%) and its Free Cash Flow (FCF) by $12.23 billion (265.34%). To many, CSCO is a boring old-school tech company, but I see it as a cash cow. CSCO may not be at the forefront of AI or create captivating headlines, but it’s the backbone of many organization’s network infrastructure, and the fundamentals are captivating. I think CSCO is worth another look, as it has a fortress for a balance sheet, throws off a 3.13% yielding dividend, allocates capital to buybacks, and trades at P/FCF valuation.
Put the hype and headlines aside, as there is an opportunity in shares of CSCO
I am not knocking the AI train. I am directly benefiting from shares of Palantir (PLTR) appreciating and indirectly benefiting from NVIDIA (NVDA) through ETFs. Sometimes when one aspect of the market becomes a focal point, there are opportunities that fly under the radar. CSCO may not be plastered throughout the headlines as it once was, but it’s delivering billions in profits in addition to growth. I think there is an opportunity in CSCO that is being overlooked.
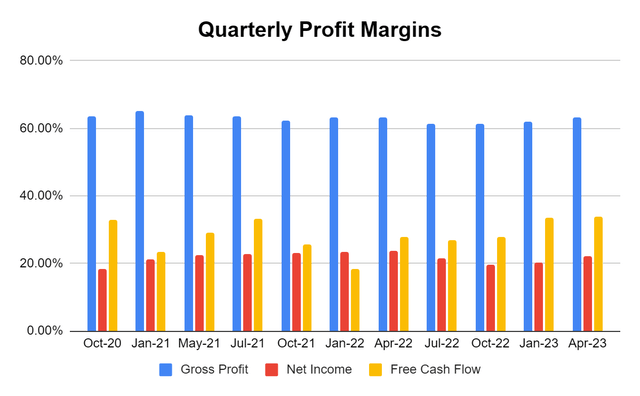
Looking at CSCO from a quarterly perspective during inflation, supply chain issues, economic uncertainty, and unpredictable market dynamics, CSCO has grown its top and bottom lines. This is a testament to the strength and validity of CSCO’s underlying products and services. Over the previous 10-quarters, CSCO has grown its quarterly revenue by $2.64 billion (22.15%), gross profit by $1.65 billion (21.78%), net income by $1.04 billion (47.75%), and its FCF by $1.02 billion (26.09%). Put aside where CSCO traded in 2000, despite the top and bottom-line growth, CSCO is off its 2021 highs by roughly -21.63%. What also gets overlooked is the fact that CSCO’s margins have actually improved overall. In an era where inflation has caused the cost of doing business to drastically increase, CSCO has maintained roughly the same gross profit margin since its Oct-20 quarter as it decreased by -0.19% to 63.6%, but its profit margin increased 3.82% to 22.04%, and its FCF yield increased 1.06% to 33.96%.
Steven Fiorillo, Seeking Alpha Steven Fiorillo, Seeking Alpha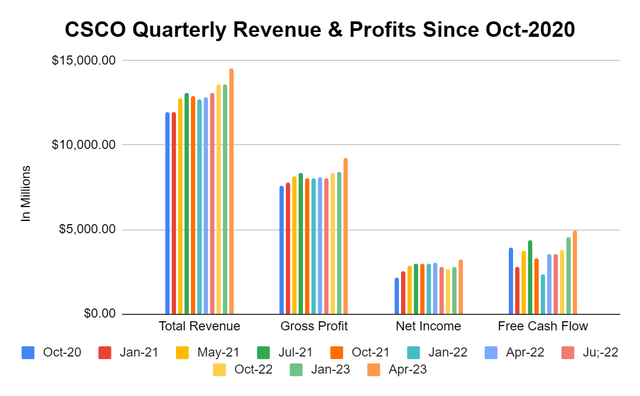
Looking at CSCO from an annualized methodology, it’s very enticing as well. At the close of 2013, CSCO generated $48.61 billion in annualized revenue and drove $29.44 billion in gross profit, $9.98 billion in net income, and $11.73 billion in FCF. In the trailing twelve months (TTM), CSCO has delivered $54.9 billion in revenue, $34.03 billion in gross profit, $11.47 billion in net income, and $16.84 billion in FCF. Over the past decade, CSCO’s annualized revenue has grown 12.94% ($6.29 billion), while its gross profit increased $4.59 billion (15.59%), net income by $1.49 billion (14.9%), and its FCF by $5.11 billion (43.53%). Over this period, CSCO’s gross profit margin increased 1.42%, its profit margin increased 0.36%, and its FCF yield grew by 6.54%.
Steven Fiorillo, Seeking Alpha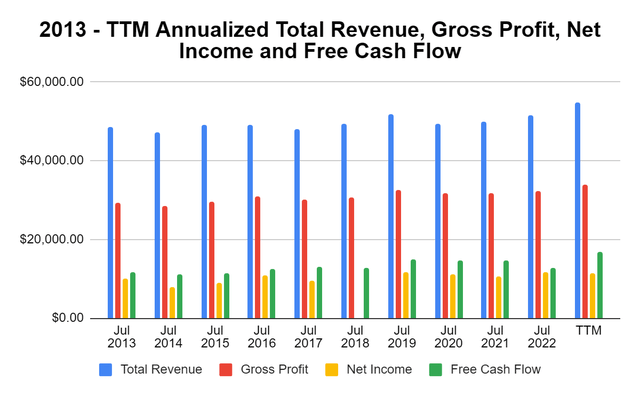
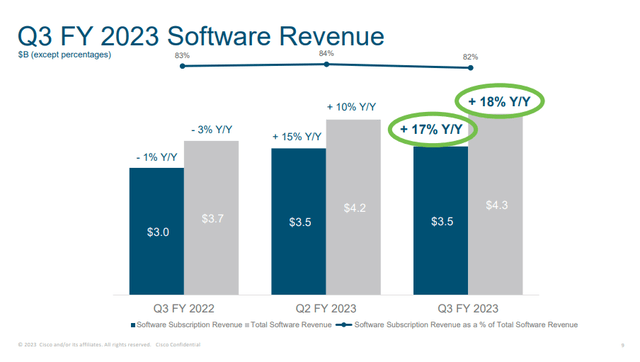
From a business perspective, CSCO is firing on all cylinders. In Q3 2023, CSCO’s revenue increased 14% YoY, and its GAAP EPS increased 7% YoY. CSCO has transformed from predominantly being a hardware company to diversifying into the software and subscription businesses. CSCO’s software revenue increased 18% YoY, and its subscription revenue increased 17% YoY in Q3 2023. I am focused on this because these businesses help diversify CSCO’s revenue mix, as clients are unlikely to upgrade their firewalls, switches, and access points annually. The hardware is a segway into software and subscriptions, which becomes reoccurring revenue. In Q3 2023, subscriptions grew 11% YoY to $6.1 billion, of which software subscriptions increased 17% YoY to $3.5 billion, and non-software subscription revenue increased 4% YoY to $2.6 billion. CSCO still has a strong pipeline as there is $16.9 billion of remaining performance obligations which will be recognized as revenue over the next 12 months, which is up 4% YoY.
Shares of CSCO are undervalued, and there is an opportunity
I have a specific methodology that I use to determine if I should look further into an established company when looking for value plays. I establish a baseline valuation by taking the total equity on the books and combining it with a multiple of FCF to determine what I think the company is worth. In this case, I compared CSCO to International Business Machines (IBM), Broadcom (AVGO), Alphabet (GOOG) (GOOGL), Salesforce (CRM), Apple (AAPL), Meta Platforms (META), and Microsoft (MSFT).
I am creating an expanded peer group of big tech companies to compare CSCO against. I will take the average price to FCF that each company trades at, multiply each company’s current TTM FCF by that multiple, and add it to the total equity to determine a fair market value. If the market cap is under this number, I consider it to be undervalued. For anyone who is interested, this is why I use FCF rather than EBITDA or net income as my measure of profitability. FCF represents a company’s cash after accounting for cash outflows to support operations. I like to use this metric rather than net income because FCF is a measure of profitability that excludes the non-cash expenses and includes spending on equipment and assets. It’s also a harder number to distort or manipulate due to how companies account for taxes, and other interest expenses. This is also the pool of capital companies utilize to pay back debt, reinvest in the business, pay dividends, buy back shares, and make acquisitions.
Steven Fiorillo, Seeking Alpha
The average price to FCF of the peer group is 26.64x, with a range of 12.13x to 43.12x. CSCO has the lowest P/FCF at 12.13x, while MSFT trades at 42.12x. CSCO and IBM are the only 2 companies trading below a 20x P/FCF. When I assign the per group average P/FCF of 26.64x to the peer group and add this to their equity, 5 companies look undervalued, and 3 companies look overvalued. There looks to be an opportunity in CSCO, as my fair value would be a $490.95 billion market cap compared to the current market cap of $204.22 billion. Today, CSCO’s market cap is undervalued by -58.40% based on my methodology, and shares would need to appreciate by 140.4% to reach fair value based on where the peer group trades. If you stripped out equity and did everything on a strictly P/FCF methodology, shares of CSCO would need to appreciate by 120% for its P/FCF to equal the peer group average of 26.64x.
The dividend and buybacks are the icing on top
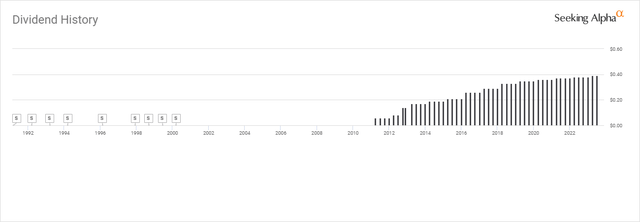
While shareholders aren’t being rewarded in CSCO’s share price, they are being rewarded through a robust capital allocation program. CSCO implemented its dividend program in 2011, with its first dividend being paid on 4/20/11. Shares of CSCO traded for $20.97 at the start of 2011. Since then, CSCO has returned $13.10 in dividend income which is 62.47% of its January 2011 share price. Since the initial dividend, CSCO has provided shareholders with 11 consecutive years of dividend growth and has grown its initial quarterly dividend by 550% from $0.06 to $0.39. Today, CSCO is paying an annual dividend of $1.56, which is a 3.13% dividend yield with a 42.86% payout ratio. There is more than enough room in CSCO’s EPS for future dividend increases.
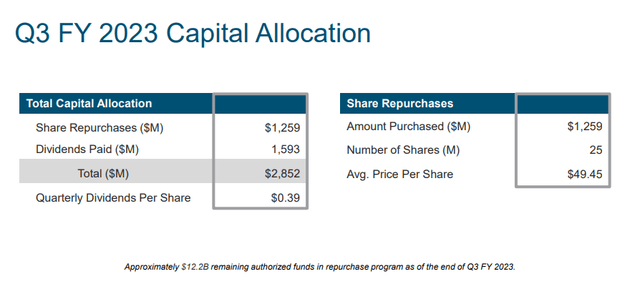
CSCO is also buying back shares at a quick pace. At the close of 2013, CSCO had 5.39 billion common shares outstanding. Over the last decade, CSCO has repurchased 1.31 billion shares and reduced the number of shares outstanding by -24.83%. In Q3 2023, CSCO repurchased 25 million shares at an average price of $49.45 and has $12.2 billion remaining on its authorized repurchase plan. On the Q3 conference call, Scott Herren (CSCO CFO) indicated that CSCO has allocated $7.7 billion between dividends and buybacks in the current fiscal year and that this should reinforce the confidence management has in the stability of CSCO’s ongoing cash flow.
Conclusion
I feel there is an opportunity for both capital appreciation and dividend growth by investing in CSCO. Based on where big tech trades, CSCO trading at 12.13x its FCF is inexpensive. CSCO is valued as if it was being put out to pasture, yet it’s still growing and generating $10 billion-plus in profits annually. CSCO has strong margins and, over the years, has proven it can grow the top line without sacrificing profitability. CSCO should be celebrated, as its repurchased 24.83% of the company over the previous decade, yet it’s looked over. I plan to add to my position in CSCO as shares look undervalued, and management is committed to its strong capital allocation program while delivering growth throughout its business segments.
Analyst’s Disclosure: I/we have a beneficial long position in the shares of CSCO, AAPL, GOOGL, META either through stock ownership, options, or other derivatives. I wrote this article myself, and it expresses my own opinions. I am not receiving compensation for it (other than from Seeking Alpha). I have no business relationship with any company whose stock is mentioned in this article.
I am not an investment advisor or professional. This article is my own personal opinion and is not meant to be a recommendation of the purchase or sale of stock. The investments and strategies discussed within this article are solely my personal opinions and commentary on the subject. This article has been written for research and educational purposes only. Anything written in this article does not take into account the reader’s particular investment objectives, financial situation, needs, or personal circumstances and is not intended to be specific to you. Investors should conduct their own research before investing to see if the companies discussed in this article fit into their portfolio parameters. Just because something may be an enticing investment for myself or someone else, it may not be the correct investment for you.
Seeking Alpha’s Disclosure: Past performance is no guarantee of future results. No recommendation or advice is being given as to whether any investment is suitable for a particular investor. Any views or opinions expressed above may not reflect those of Seeking Alpha as a whole. Seeking Alpha is not a licensed securities dealer, broker or US investment adviser or investment bank. Our analysts are third party authors that include both professional investors and individual investors who may not be licensed or certified by any institute or regulatory body.


