Summary:
- Cisco’s history of maintaining high profitability and generating strong free cash flow underscores its financial strength despite modest revenue and net income growth.
- Undervaluation persists despite forecast revisions, with potential upside of 30%-40%. Risks include continued downward forecasts and market sentiment, but the outlook supports a strong buy rating.
- Cisco can miss estimates in 2023-2026 and still be undervalued in case it beats earnings in 2027-2029.
- Investors are presented with an attractive opportunity to capitalize on Cisco’s undervaluation, since its stock price has stayed almost flat in the past 5 years.
NurPhoto/NurPhoto via Getty Images![]()
Thesis
In my previous article about Cisco Systems, Inc. (NASDAQ:CSCO), published prior to Q1 2024 earnings, I rated Cisco as a “strong buy,” and suggested an upside of approximately 47.5%. However, following the release of Q1 2024 earnings on November 15, the stock experienced a decline as Cisco reduced its FY 2024 forecast due to a slowdown in the creation and extension of network contracts. This situation has repeated in Q2 2024 and has made it impossible for the stock to adjust to the fair price estimated by my models.
Nevertheless, Cisco remains a strong buy for several reasons. Firstly, according to my DCF model based on market trends, Cisco could miss estimates for years 2024, 2025 and 2026, and it would still be undervalued if it managed to beat estimates from 2027 to 2029. Secondly, the stock has displayed an excellent resistance to these downward revision, because the stock price has remained flat when observed on a 5 year basis. Finally, Cisco’s main reason for lowering its forecast is that customers are delaying the implementation of the equipment they purchased in previous quarters; it could be assumed that when the implementation process is finished, orders will start kicking in and the stock would finally achieve the targets suggested by my models.
Overview
Market
Secure, Agile Networks is the largest segment of Cisco. In Q4 2023, it represented around 51% of total revenues, which means that Cisco would be impacted by any movement in this segment. Furthermore, the services segment represented around 24% of revenues in Q4 2023, and if networks represents the largest segment, then the services segment must be considerably dependent on networks.
The networking segment is part of the data center market. Networking can be categorized in embedded and enterprise. Embedded refers to the equipment, while enterprise refers to the platform that contains company data and programs. The networking segment of the Worldwide Data Center Market is expected to grow at an annual CAGR of 6.88% throughout 2028.
Statista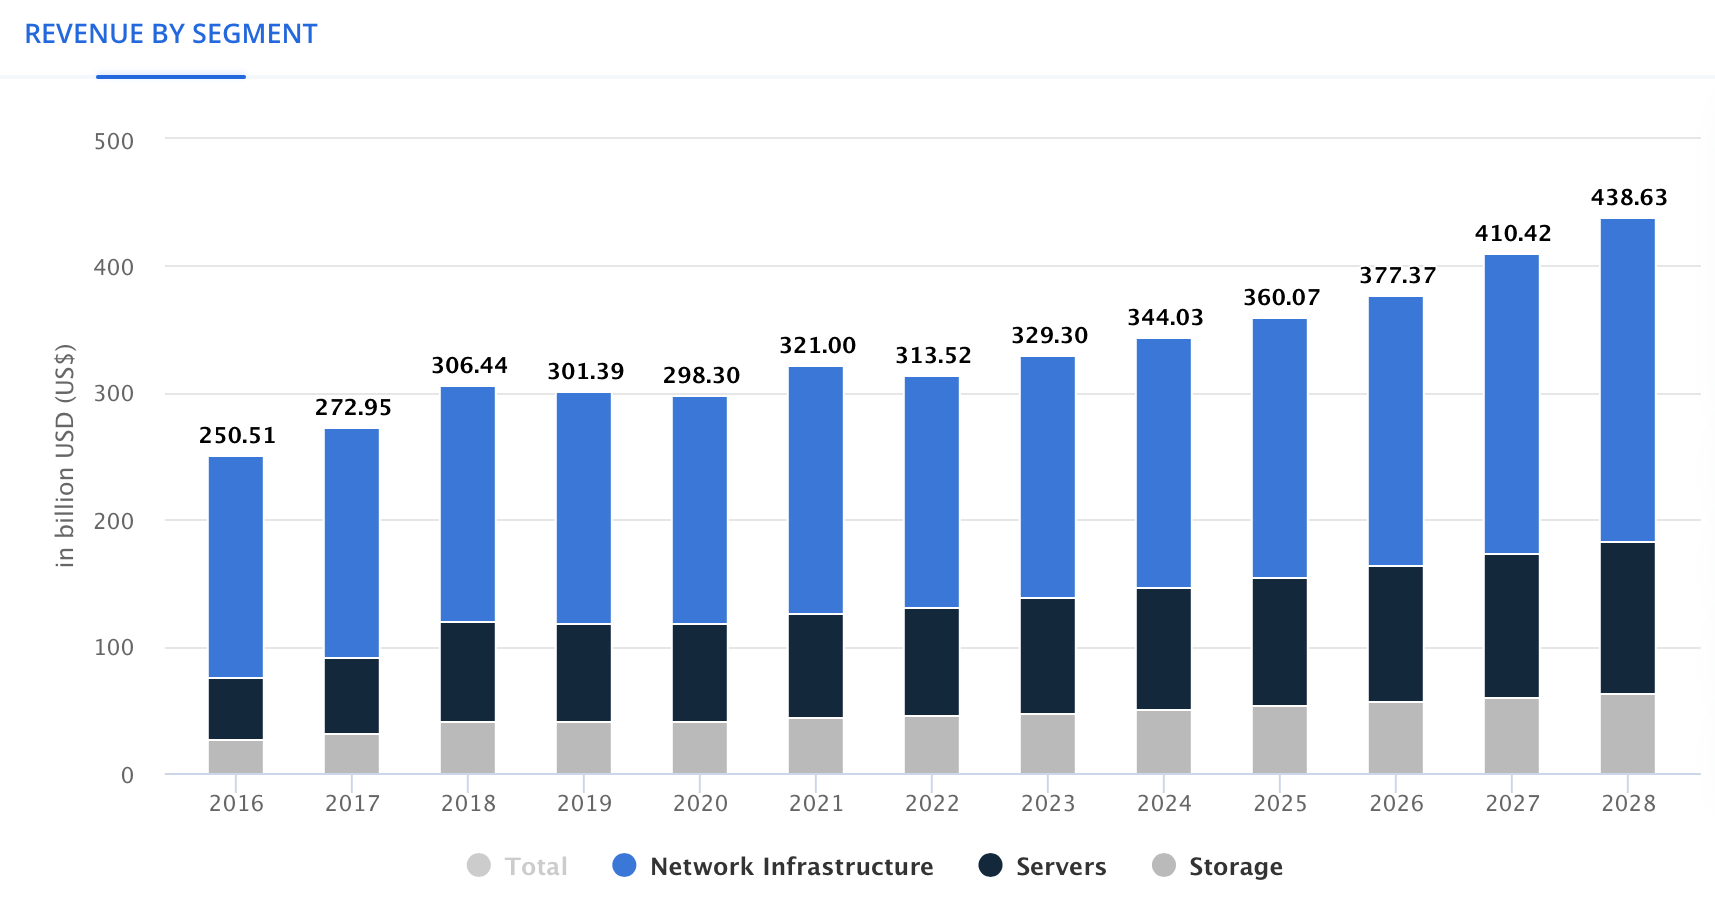
Cisco’s “internet of the future” segment aims to facilitate the connection between the cloud and interconnected devices (such as a local enterprise network). Cisco mainly sells optic connectivity and its Silicon One, something that is necessary for all the networks. With this in mind, and Observing the graph below, you can see that Cisco can basically serve all the sectors, be it automotive, consumer, finance, etc. This means that Cisco’s addressable market is nearly all these markets since it does not depend on any particular sector to allow this segment to perform well.
Furthermore, available estimates indicate that this market will grow by a substantial CAGR of 13.6% annually throughout 2028, a very decent double-digit growth rate.
Statista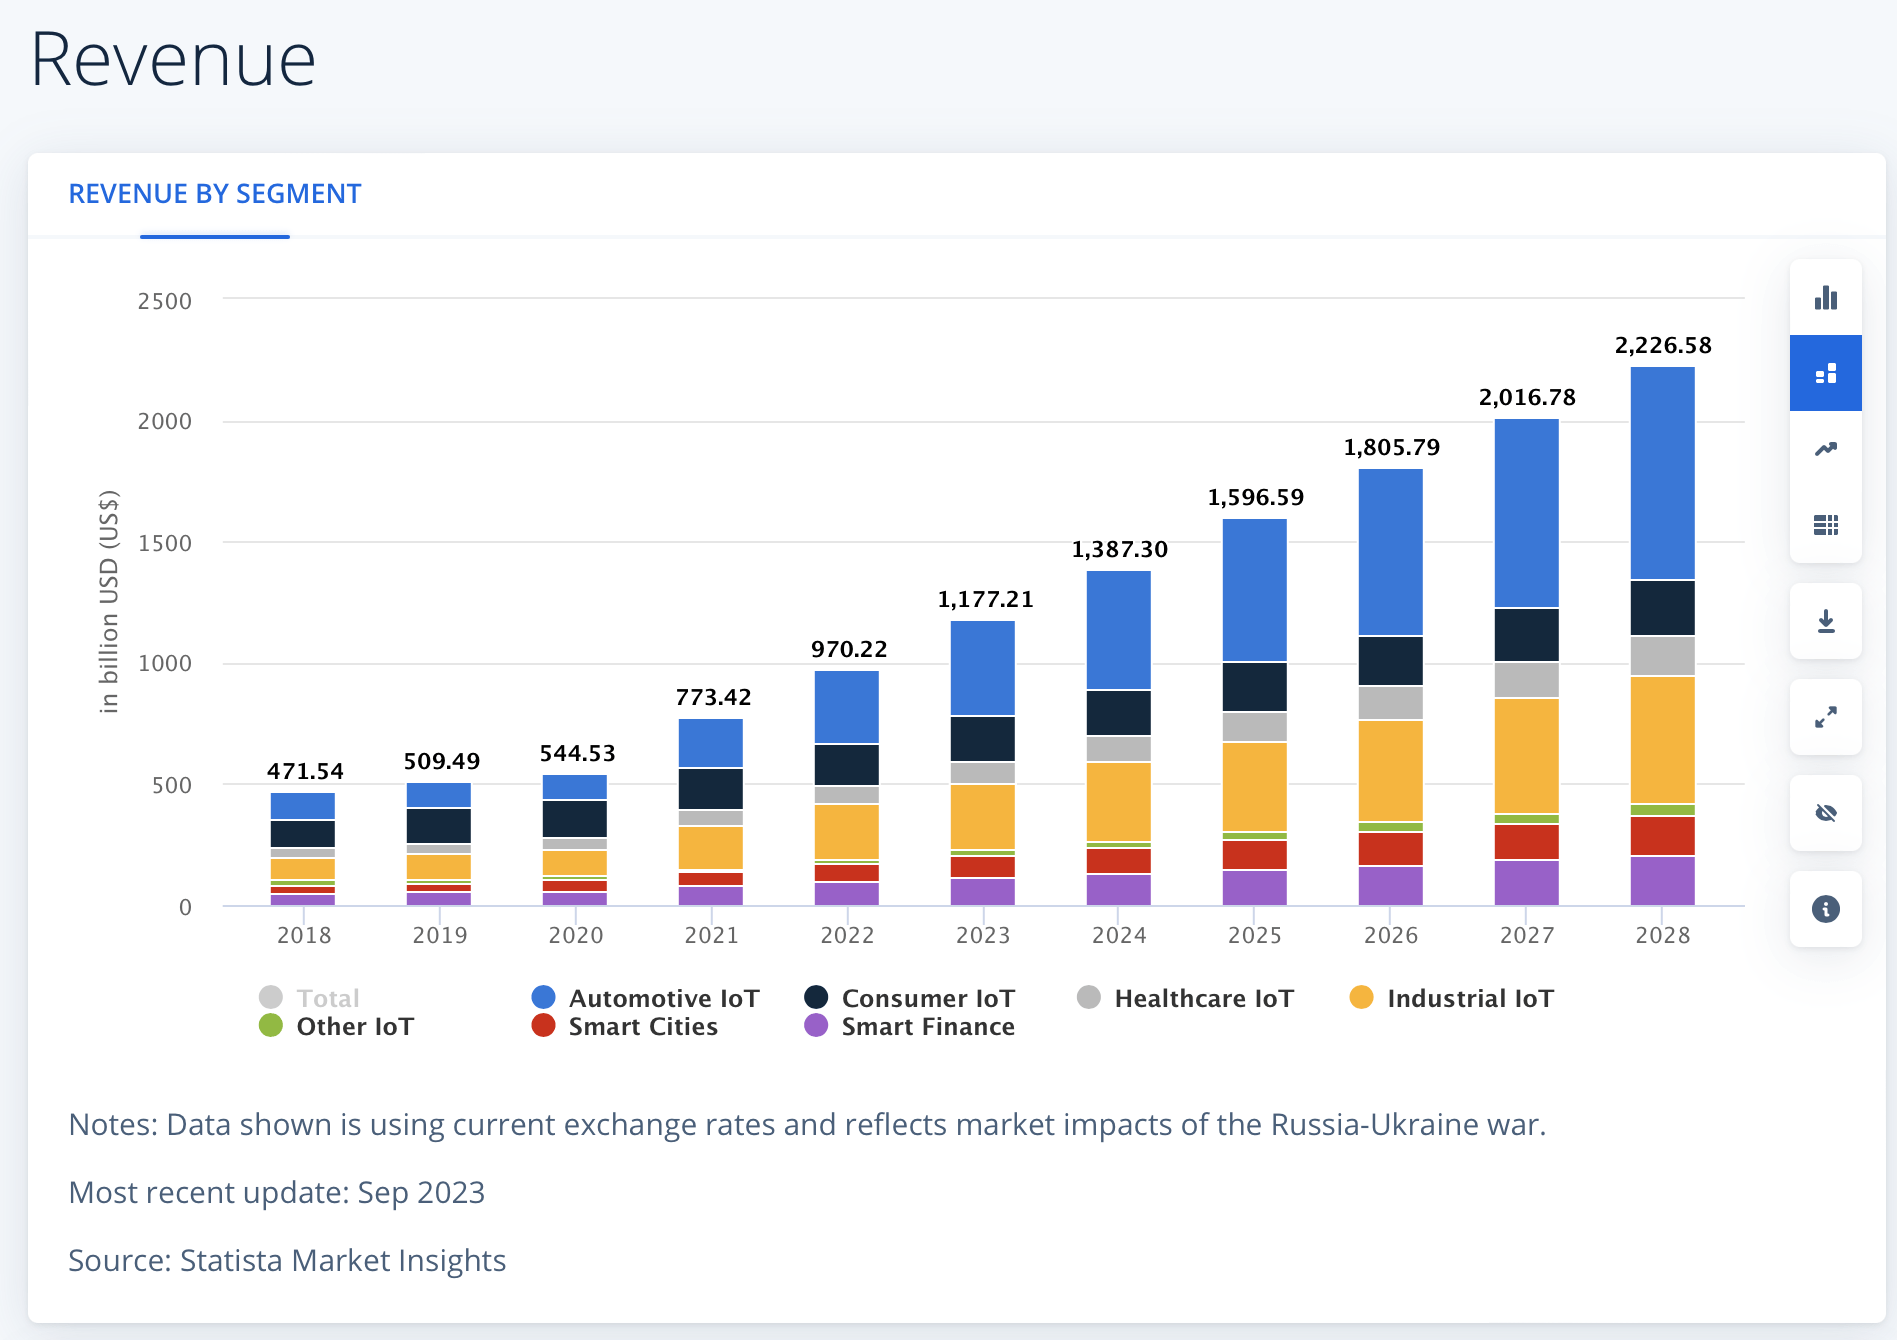
However, one of Cisco’s main problems starting to loom is its segments that are in some way influenced heavily by networking, for example, its end-to-end security segment is focused on offering security to cloud, applications & networks. This means that this segment is also linked to networking (Cisco’s largest segment).
The revenue of the Worldwide Cybersecurity market is expected to grow at a rate of 10.48% throughout 2028. However, there are two different segments inside this market: cyber solutions and security services. Cyber solutions is expected to significantly outperform Security Services, since it’s estimated that it will grow at a CAGR of 17.16% through 2028.
Statista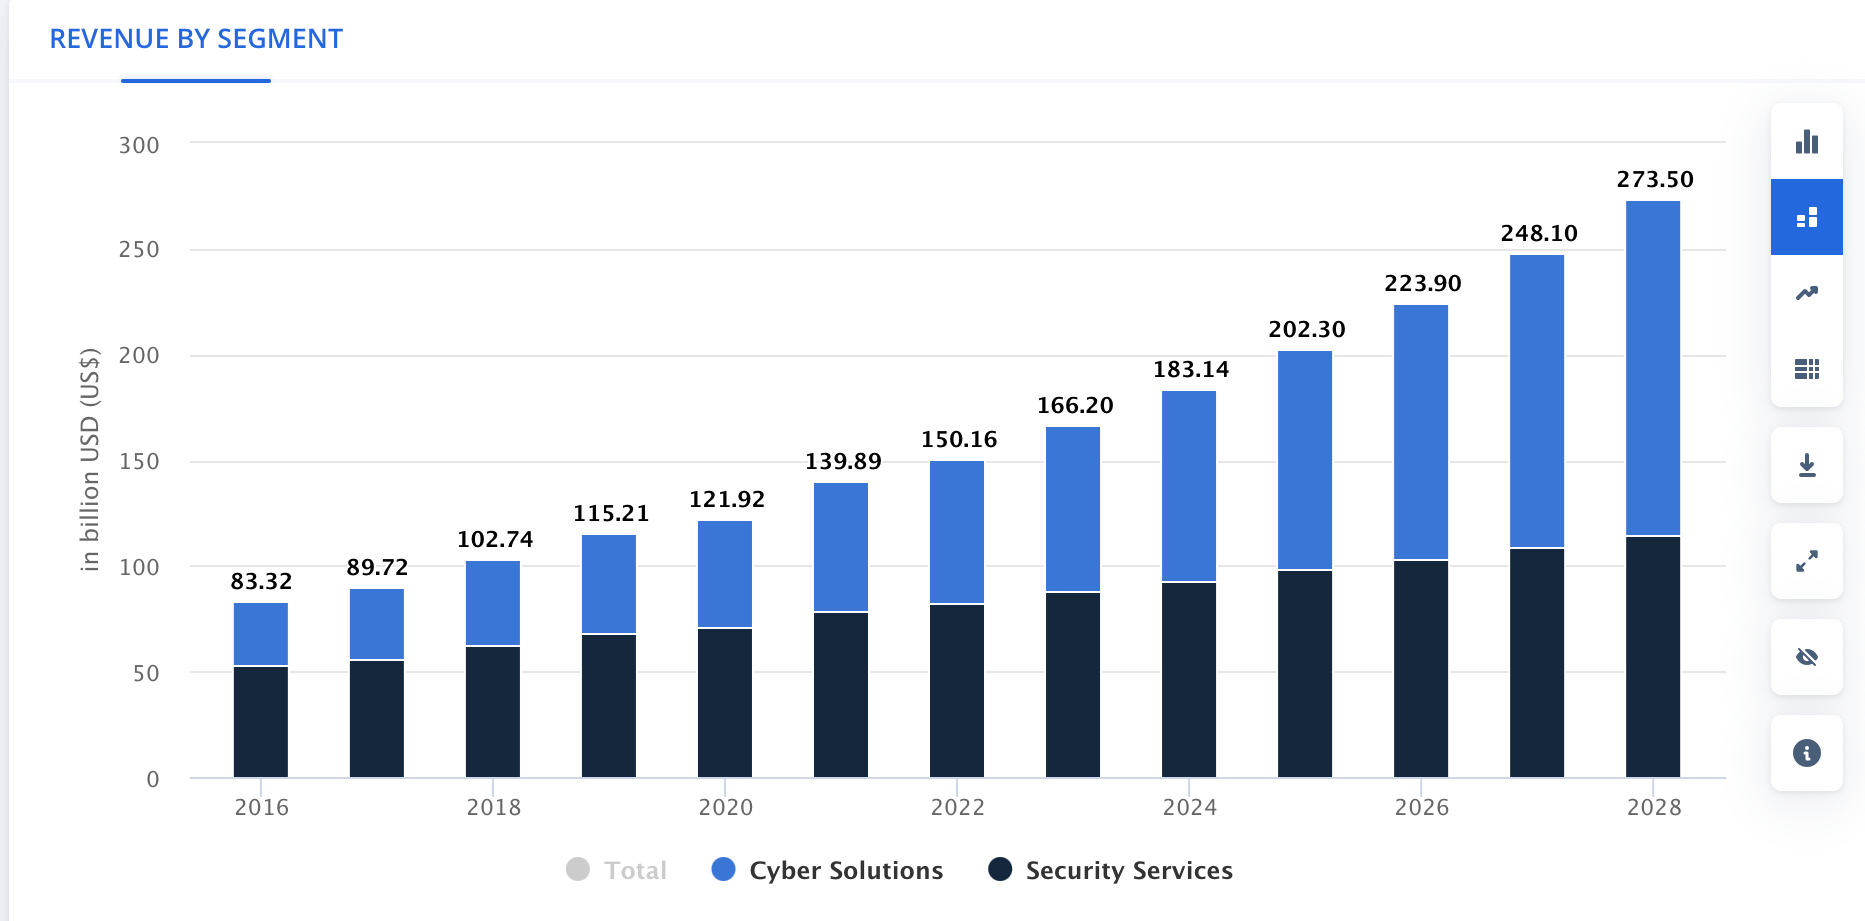
Throughout this segment, Cisco offers a consolidated collaboration platform whose main objective is to accelerate workflows. It offers video calls, calling center, and communication platform as a service. This one is not connected to the other segments however competition must be brutal since there is Skype, Zoom Video Communications, Inc. (ZM), and any other startup that decides to enter this market. The business and productivity market is expected to grow at a CAGR of 13.5% throughout 2031. Cisco has a good advantage here because of the network effect it has built, however that’s also a double-edged in my opinion, because if companies decide to not go with Cisco’s networking, then other segments will be affected.
Nevertheless, in the valuation section I will not take this problem into account, and I will assume every segment will grow at their respective market CAGRs just to see how much (in theory) Cisco could generate, and also because it wouldn’t matter to the DCF since what mostly affects free cash flow is net income, not revenue.
Stratis Research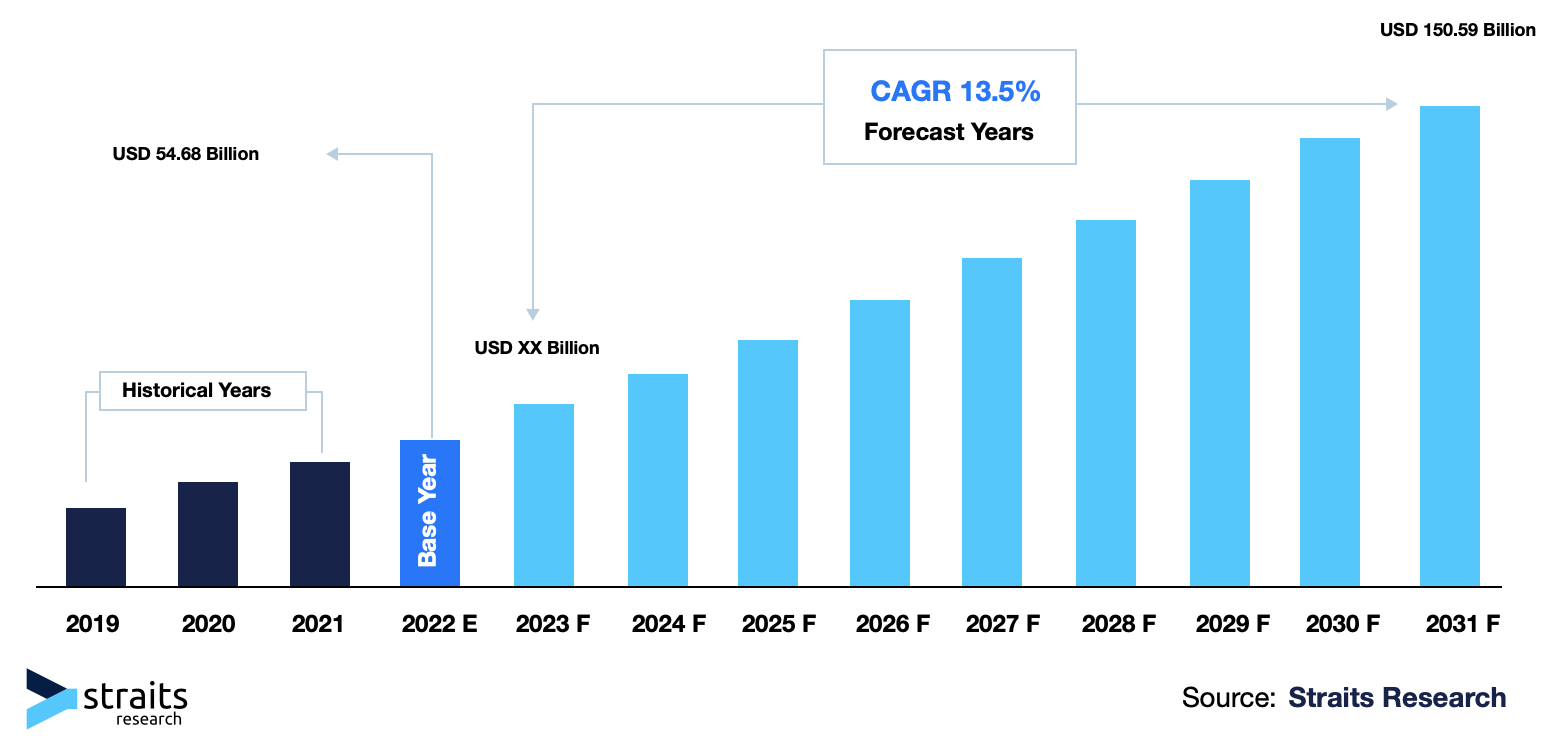
What do these market trends mean for Cisco?
What you can observe is that networking, which is Cisco’s most important segment, is operating in a market that is expected to grow relatively slow when compared to the other markets with double-digit growth. Nevertheless, this shows that Cisco has the potential for a decent revenue growth, but it hasn’t unlocked it yet. Cisco is underperforming relative to the market in which it operates. Cisco is in a favorable position because they are a market leader, they have a pricing power advantage, and they have a reputation. So, how are these trends supposed to help the company? Well, when the market displays double-digits growth, it’s very easy for a company to grow, for example, Alphabet Inc. (GOOGL) (GOOG) has been losing market share, however since the market has been expanding, Alphabet’s gradually smaller market share has been appreciating in value.
In order to see if Cisco can grow its revenue at this pace we would need to see how it performs during a spike in orders, which is the growth period for Cisco and could start in Q3 or Q4 2024, since there have already been two quarters of slow growth in an environment where AI utilization is growing.
Financials
Cisco reported Q2 2024 earnings on February 14, and beat quarterly estimates in EPS after reporting $0.87 vs the expected $0.84. It also beat on revenue by reporting $12.79 billion vs the expected $12.71 billion. However it lowered its forecast again because of the same reason: Delayed implementation time of the equipment shipped to customers in previous quarters. The new full year estimates is set at $3.68 – $3.74 EPS, lower than the previous forecast of $3.87 – $3.93. Meanwhile, Cisco expects full year revenue in between $51.5 – $52.5 billion, also lower than the forecast given in Q1 2024 of $53.8 – $55 billion.
These two continuous lowered forecasts are reflected in the variation of the income statement since Q4 2023, that is when my previous article was released. Since then, revenue has fallen by 1.32%, operating income by 2.37% and net income by 1.10%. This is concerning, since it makes me think if I have gotten it wrong with my previous strong buy rating on Cisco.
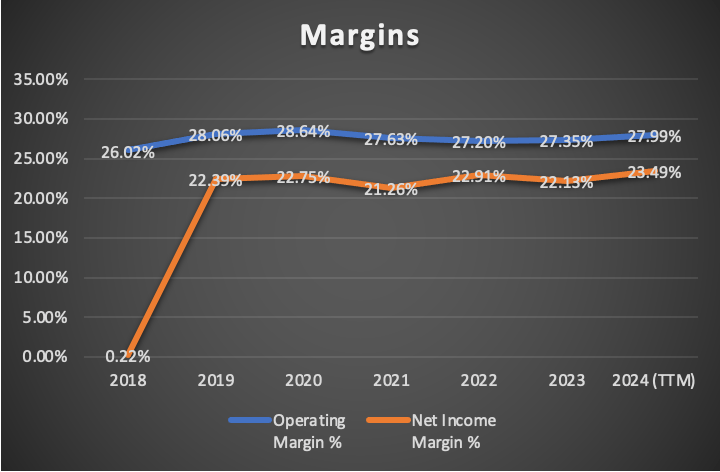
The bright spot in the income statement is that operating margin increased from 27.35% in Q4 2023 to 27.99%, and net income margin from 22.13% to 23.49%.
This is concerning, however if we expand the picture and observe estimates revisions since 2020, we would be able to see that EPS remain almost flat therefore the situation is not currently that bad. The pattern is usually one year down and one year up.
Seeking Alpha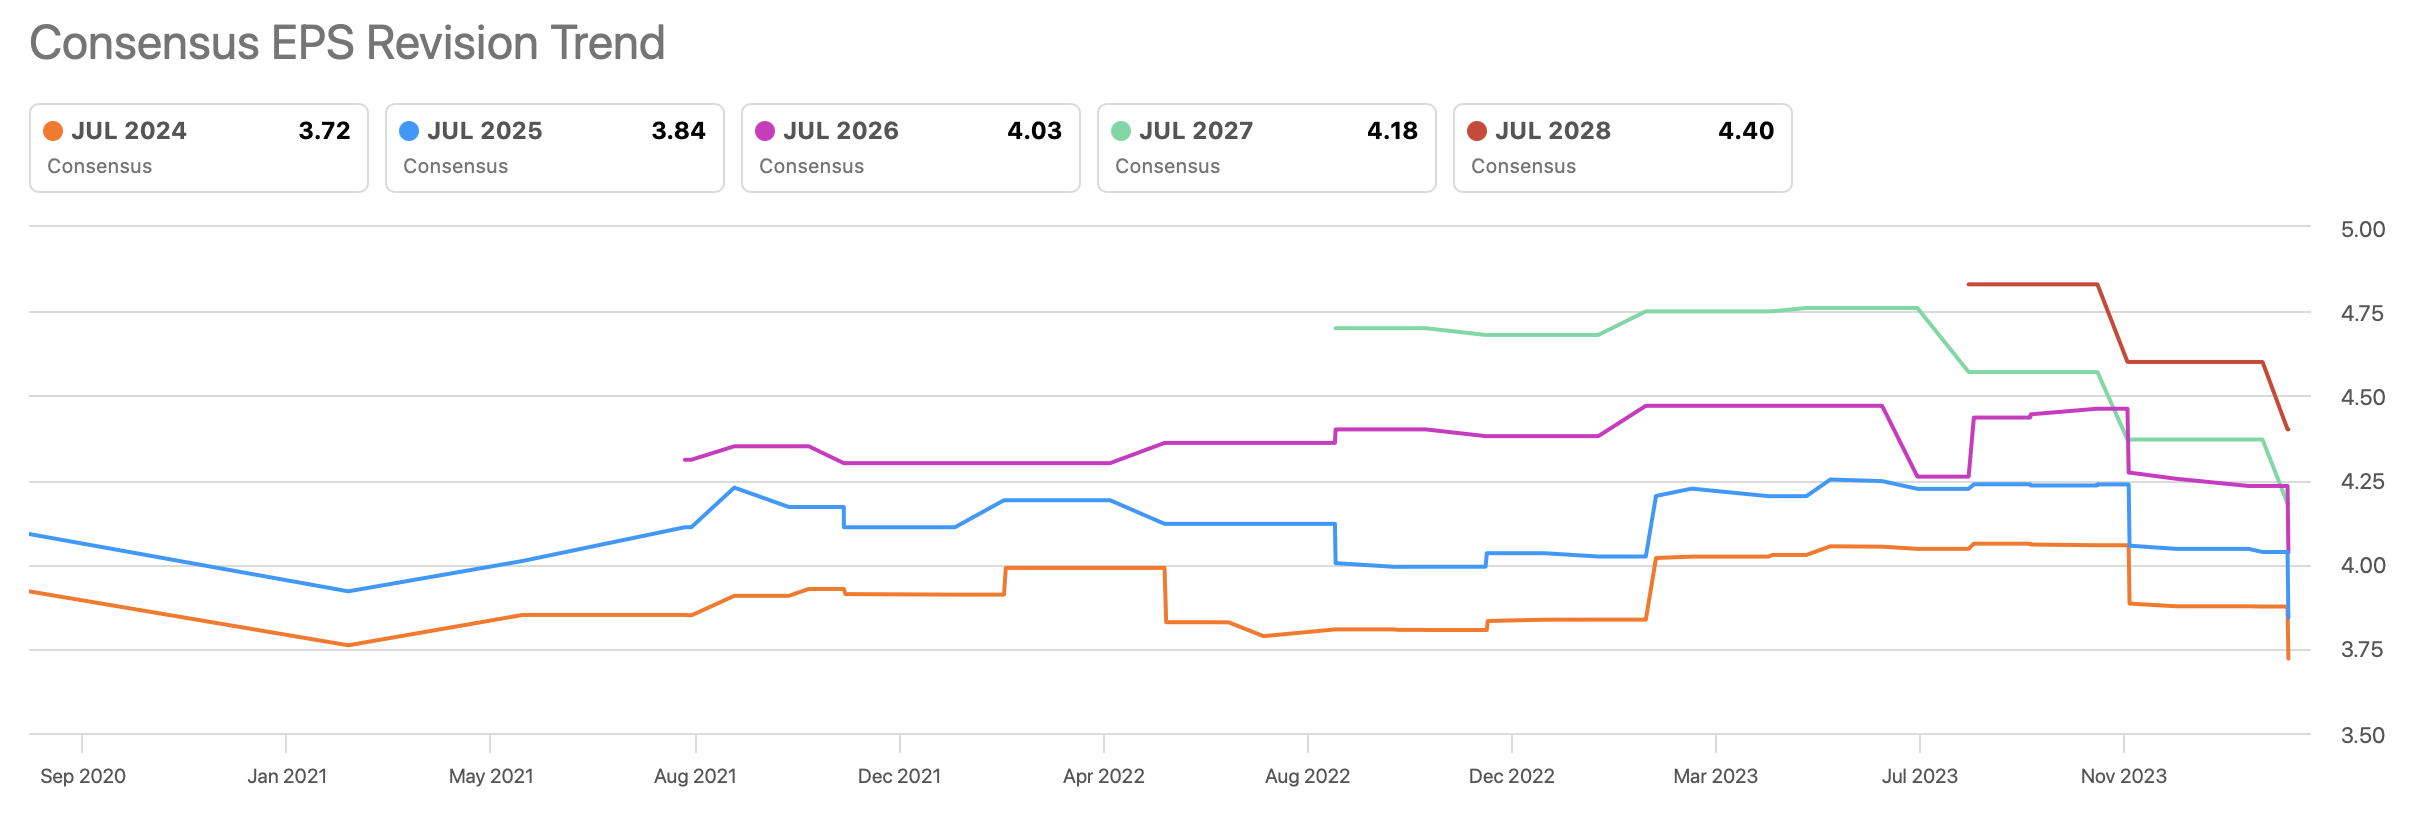
This trend can be better observed by observing the income statement where we can see that revenue increased for 2019, and then decreased in 2020 and stayed flat for 2021, then in 2022 with the start of the AI mania, revenue has been increasing for 3 years in a row. Nevertheless, the overall growth is very low, which should give confidence that Cisco’s stock shouldn’t be moving by huge percentages. This is further reinforced by the beta of Cisco at 0.93, which indicates that it’s slightly less volatile than the market.
Author’s Calculations 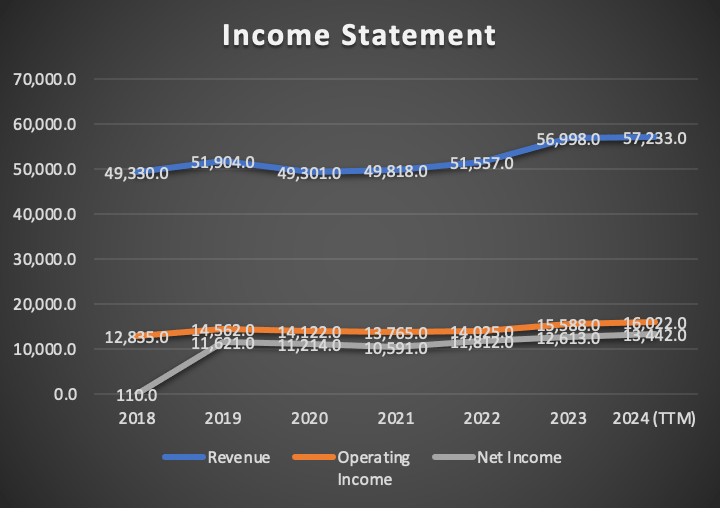
The balance sheet has displayed a slight deterioration, since cash reserves passed from $26.3 billion to $25.6 billion. Meanwhile short-term debt increased from $2.77 billion to $4.93 billion. Lastly, long-term debt stayed almost unchanged and now stands at $6.66 billion, lower than the previous $6.68 billion.
Author’s Calculations 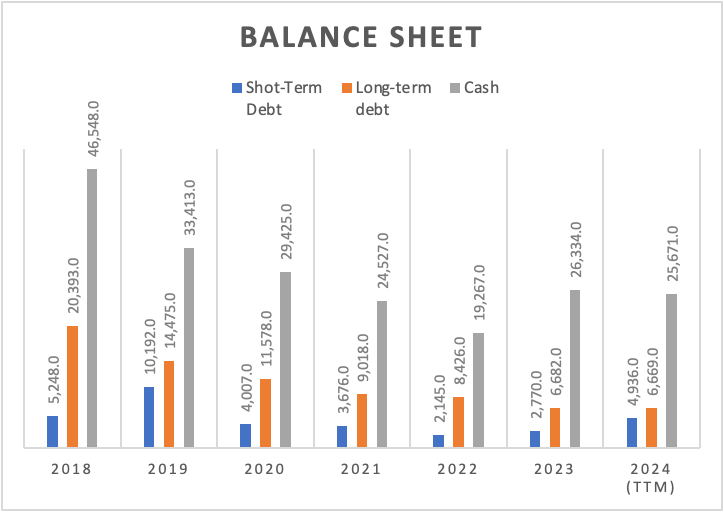
Finally, where things got ugly is in free cash flow, since for FY2023, the free cash flow was $16.75 billion, and now it stands at $11.4 billion, a 31.9% contraction. This means that the FCF margin decreased from 29.4% to 11.4%. This contraction in free cash flow was due to a reduction in cash from operations which passed from $19.8 billion to $14.3 billion.
Author’s Calculations 
Author’s Calculations 
Valuation
In this article, I will make two valuation models. The first one will be based on average analysts’ estimates and the second one on current market trends.
In the table below, you can see all the current financial data available for Cisco. The WACC for Cisco stands at 9.72%. Meanwhile, D&A, interest expenses and CapEx will be calculated with margins tied to revenue performance.
Finally, the future value will be calculated by taking the cash flows previous to the discounting process and then calculating equity by assuming that the metrics conforming it will evolve at the pace displayed in 2018-2024. This means that short-term debt will decrease by around 1% annually, long-term debt by 11.2%, cash by 7.5%, and current assets by 7.7%.
| TABLE OF ASSUMPTIONS | |
| (Current data) | |
| Assumptions Part 1 | |
| Equity Market Price | 204,310.00 |
| Debt Value | 11,605.00 |
| Cost of Debt | 3.89% |
| Tax Rate | 16.15% |
| 10y Treasury | 4.207% |
| Beta | 0.93 |
| Market Return | 10.50% |
| Cost of Equity | 10.06% |
| Assumptions Part 2 | |
| CapEx | 807.00 |
| Capex Margin | 1.41% |
| Net Income | 13,442.00 |
| Interest | 451.00 |
| Tax | 2,589.00 |
| D&A | 670.00 |
| Ebitda | 17,152.00 |
| D&A Margin | 1.17% |
| Interest Expense Margin | 0.79% |
| Revenue | 57,233.0 |
Analysts’ estimates
As previously said, I will calculate Cisco’s fair price based on current analysts’ estimates on EPS and revenue. These estimates can be found on Seeking Alpha. Starting with EPS, Cisco is expected to continue its sluggish earnings growth rate. For 2024, the average estimates suggest an EPS of $3.72, and for 2025 an EPS of $3.84. In the DCF model, I will be multiplying each EPS by the amount of shares outstanding in order to get the net income projections.
Seeking Alpha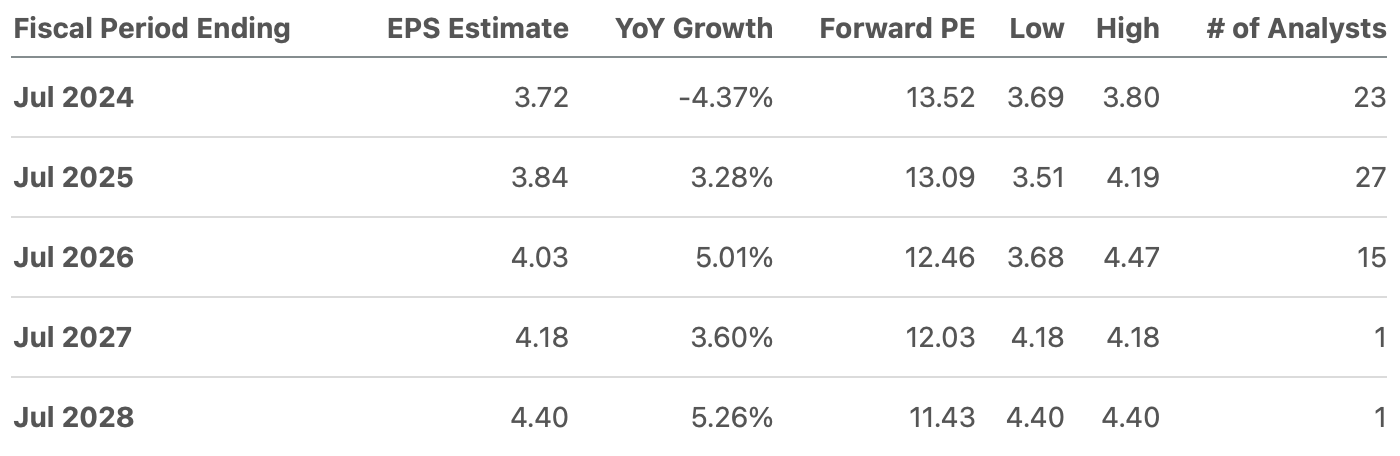
Next, it’s revenue, where the growth rate is even lower than in net income. For 2024, the average estimates indicate that Cisco will bring in around $52.19 billion, and $53,55 billion for 2025, roughly a 2.6% increase.
Seeking Alpha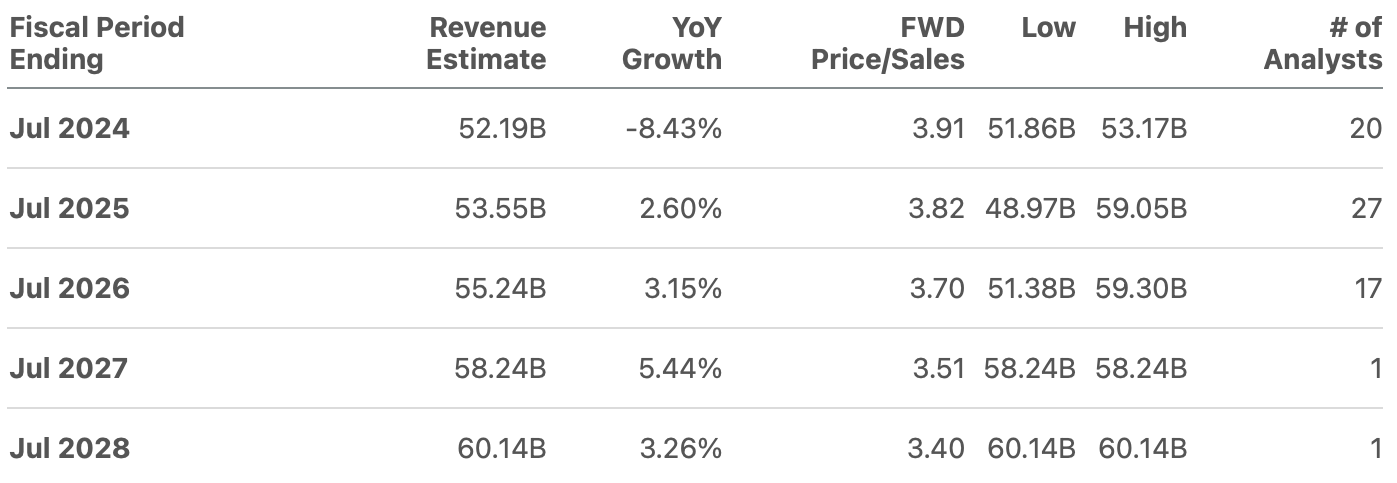
| Revenue | Net Income | Plus Taxes | Plus D&A | Plus Interest | |
| 2024 | $52,170.0 | $15,044.05 | $17,473.66 | $18,084.39 | $18,495.49 |
| 2025 | $54,390.0 | $15,773.95 | $18,321.44 | $18,932.17 | $19,343.27 |
| 2026 | $55,880.0 | $16,544.40 | $19,216.31 | $19,870.47 | $20,310.81 |
| 2027 | $58,240.0 | $16,949.90 | $19,687.30 | $20,369.09 | $20,828.03 |
| 2028 | $60,140.0 | $17,842.00 | $20,723.48 | $21,427.51 | $21,901.41 |
| 2029 | $61,775.8 | $18,687.71 | $21,705.77 | $22,428.95 | $22,915.75 |
| ^Final EBITA^ |
Author’s Calculations 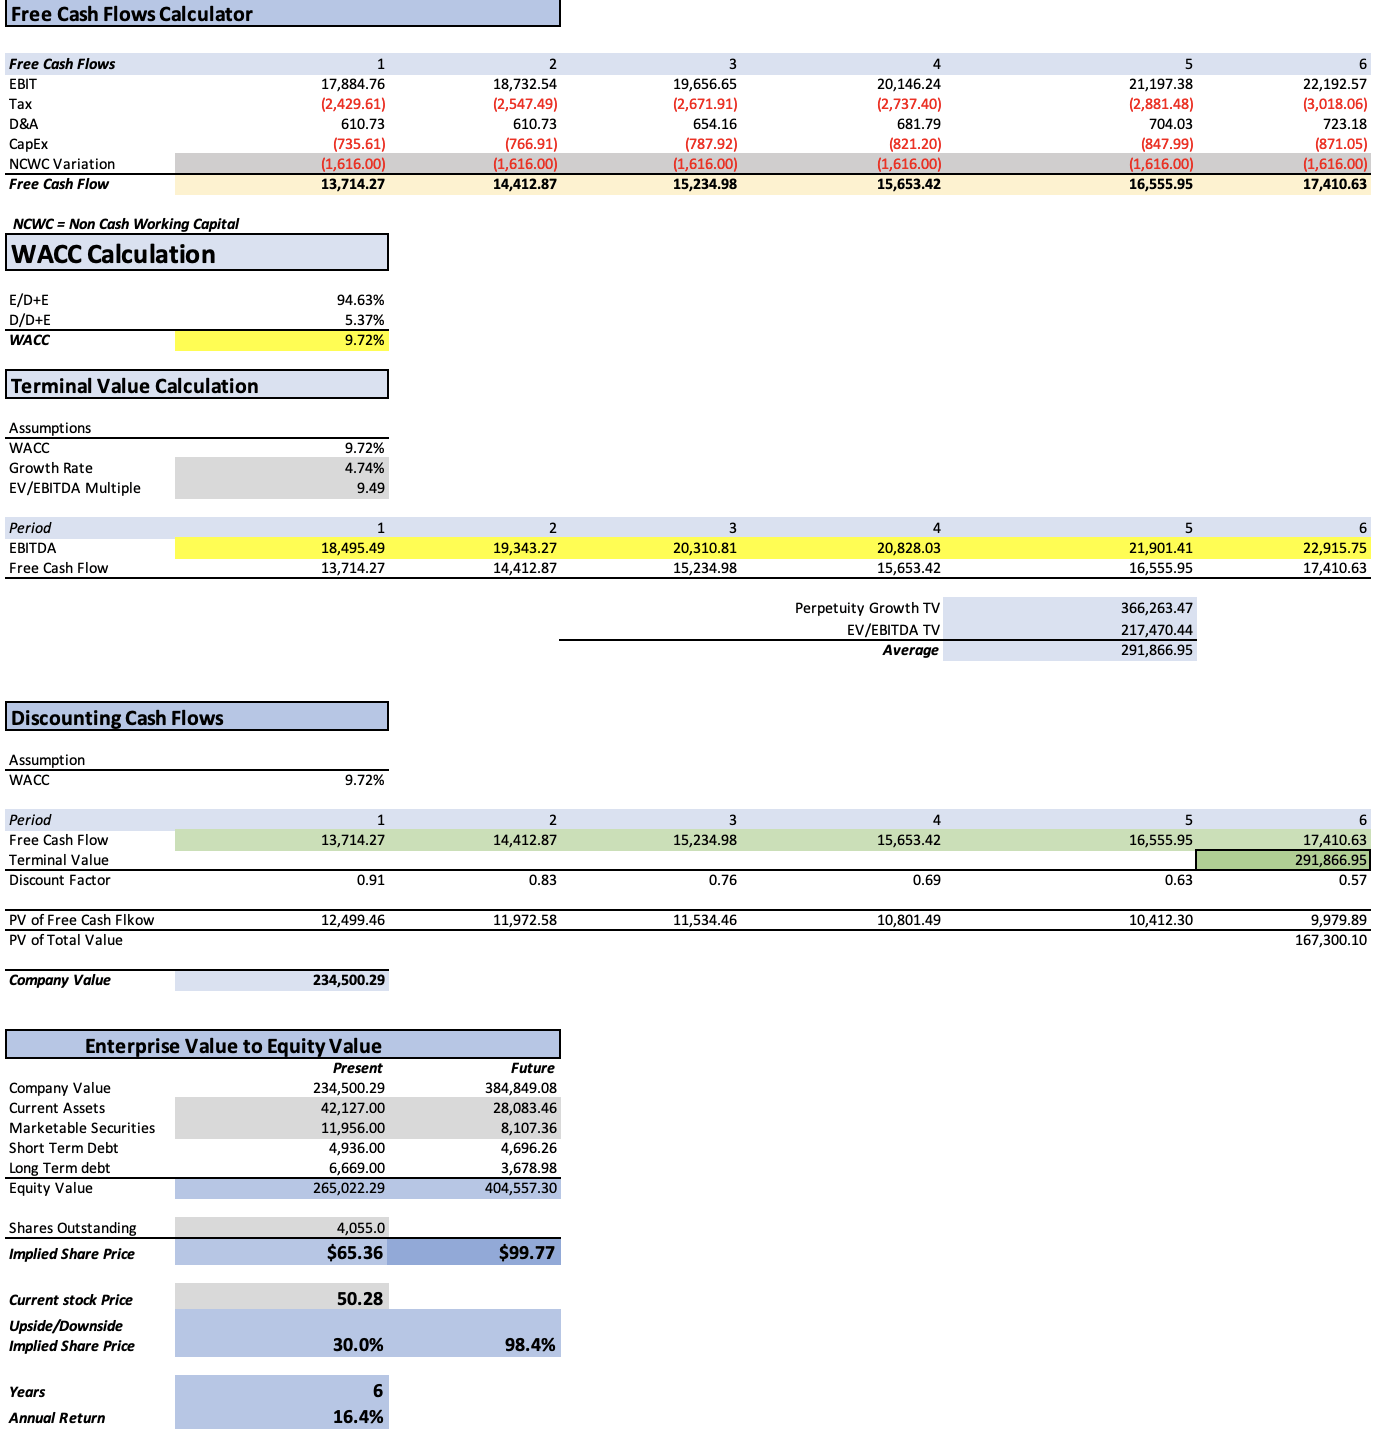
Despite this, the estimated fair price of Cisco is $65.36 which is a 30% upside from the current stock price of $50.28. For year 2029, the expected stock price is $99.77, which translates into 16.4% annual returns. This means that Cisco would finally pass the $77 stock price peak it registered at the peak of the dot-com bubble in the 2000s.
My estimates
For this second model, I will project the revenue of each segment by their respective market CAGR, discussed in the overview section. Secure, Agile, Networks will grow at 6.68% as well as services and optimized application experience. Meanwhile Internet of the Future and collaboration will grow by 13.6% annually. Lastly, End-to-End Security will grow at a 10.48% rate throughout 2029.
It’s important to clarify that I decided to use the segments in the way Cisco reported them previous to Q1 2024, since I consider that this is a better way to display a more accurate result, since now Cisco reports Networking, and IoT as a single segment, but they are two separate markets.
Cisco Q2 2024 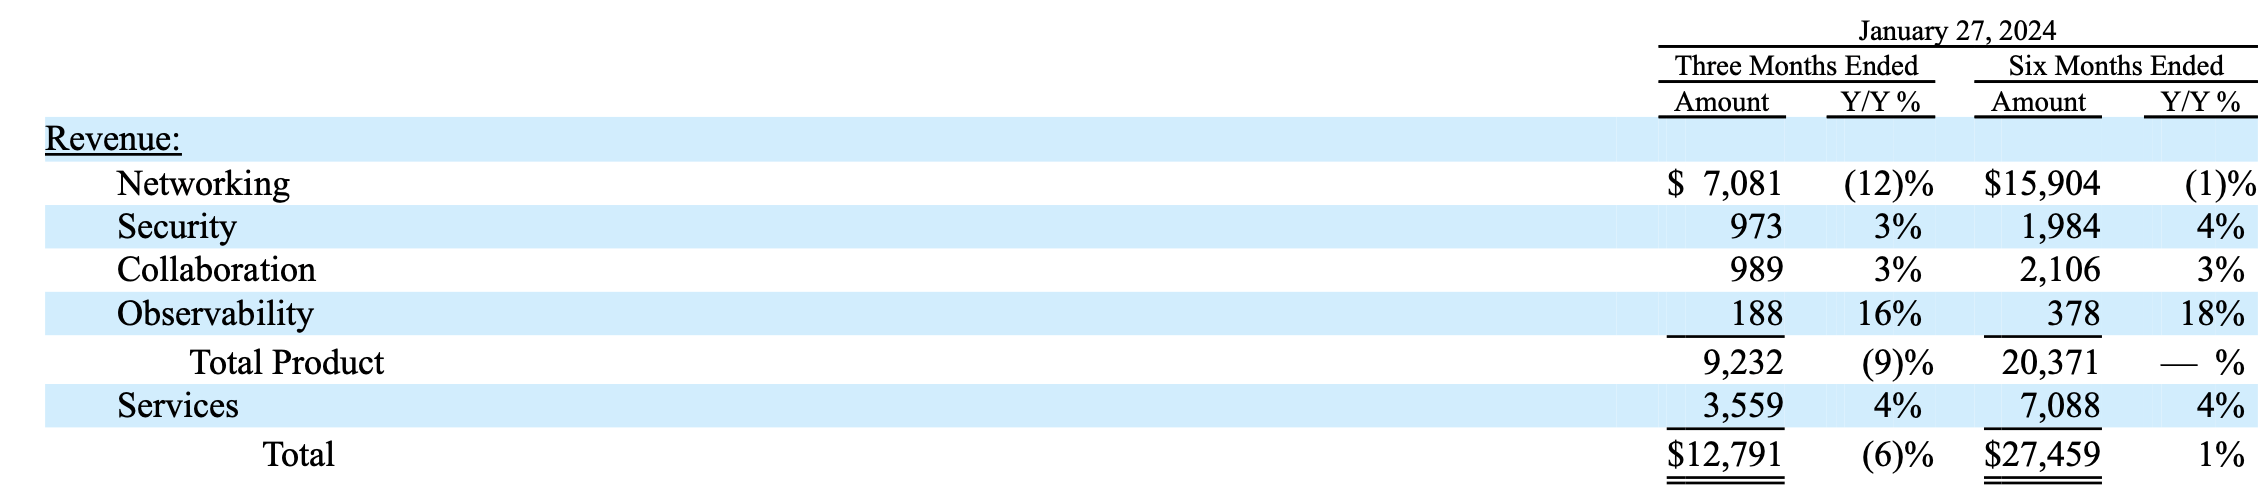
| Secure, Agile Networks | Services | Internet for the Future | End-to-End Security | Collaboration | Optimized Application Experience | |
| 2023 | 29,188.8 | 13,735.9 | 5,151.0 | 4,006.3 | 4,006.3 | 572.3 |
| 2024 | 31,197.0 | 14,681.0 | 5,851.5 | 4,426.2 | 4,527.1 | 611.7 |
| 2025 | 33,343.4 | 15,691.0 | 6,647.3 | 4,890.0 | 5,115.7 | 653.8 |
| 2026 | 35,637.4 | 16,770.5 | 7,551.3 | 5,402.5 | 5,780.7 | 698.8 |
| 2027 | 38,089.3 | 17,924.4 | 8,578.3 | 5,968.7 | 6,532.2 | 746.8 |
| 2028 | 40,709.8 | 19,157.6 | 9,745.0 | 6,594.2 | 7,381.4 | 798.2 |
| 2029 | 43,510.6 | 20,475.6 | 11,070.3 | 7,285.3 | 8,340.9 | 853.1 |
| % of Revenue | 51.00% | 24.00% | 9.00% | 7.00% | 7.00% | 1.00% |
Then, in order to project net income, I will use the average net income margin registered in 2019-2024TTM, which is around 22.49%. I will use this margin, because Cisco’s net income margin has stayed mostly flat, there is the possibility that it surpasses the 23.49% TTM net income margin, and that would be a good thing.
| Revenue | Net Income | Plus Taxes | Plus D&A | Plus Interest | |
| 2024 | $61,294.5 | $13,785.13 | $16,011.42 | $16,728.97 | $17,211.97 |
| 2025 | $66,341.2 | $14,920.13 | $17,329.72 | $18,047.27 | $18,530.27 |
| 2026 | $71,841.3 | $16,157.10 | $18,766.46 | $19,607.48 | $20,173.59 |
| 2027 | $77,839.7 | $17,506.14 | $20,333.37 | $21,244.60 | $21,857.99 |
| 2028 | $84,386.1 | $18,978.44 | $22,043.45 | $23,031.32 | $23,696.29 |
| 2029 | $91,535.9 | $20,586.42 | $23,911.12 | $24,982.69 | $25,704.00 |
| ^Final EBITA^ |
Finally, you can see how the EPS estimates derived from this model compares with the average analysts’ estimates from the previous model. You can see that for years 2024, 2025 and 2026 EPS is expected to be lower than what analysts are estimating, however after 2026, EPS is higher than the average estimates. For 2029, there is currently no available estimates for Cisco at Seeking Alpha.
Author’s Calculations 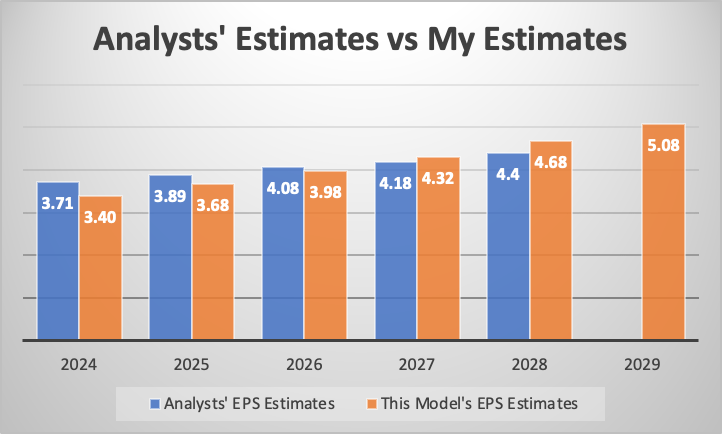
Author’s Calculations 
As you can see, this model suggests that Cisco’s fair price is around $70.39, which is a 40% upside from the current stock price of $50.25, and for 2029, the stock price should be of around $108.78, implying higher annual returns of 19.4%.
What do these results indicate?
These results suggest that Cisco is growing nearly at par with the markets in which it operates. The margin of error is therefore, slimmer than in companies growing faster than their market. Nevertheless, even though earnings forecasts have been lowered by the company, the stock is still 30% undervalued, and according to the second model, Cisco could potentially lower the forecast further (which is important) and still be undervalued. However, this would be the case if after 2026, Cisco starts reporting higher than expected earnings. This is important because this buys the company a time of 3 years in which we could wait for something interesting to happen. In the worst of cases, Cisco stays flat as it has done since the past 5 years. This means that Cisco is not as risky as it’s being perceived in my view.
If Cisco is so undervalued, why hasn’t it adjusted yet?
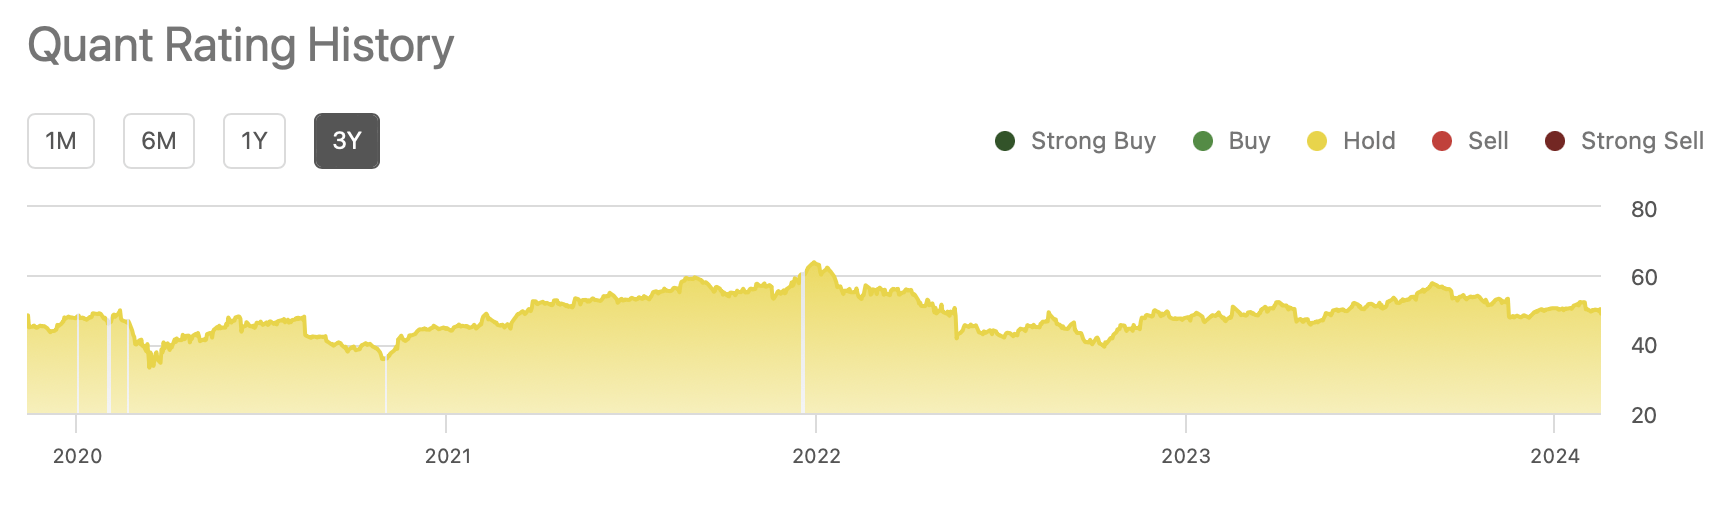
The main reason is market sentiment and the lowered forecasts, since Cisco has everything else in its favor for its stock price to jump. Valuation, according to Seeking Alpha, stands at a B-, growth at a not so good but not so bad C-, profitability at an excellent A+ grade, however in momentum and revisions it scores a D+ and F.
Those two aspects have been affecting Cisco since the whole 3 year valuation available from the Seeking Alpha Quant rating, and as you can see on the stock performance graph, the stock has moved accordingly to Seeking Alpha’s ratings.
Seeking Alpha Seeking Alpha
Risks to thesis
The main risk associated with Cisco is the possibility that after lowering its forecast for 2024, 2025 and 2026, it continues to lower it throughout 2029. Let’s remember that in the second model, Cisco could miss on EPS by a wide margin for those three years, but after 2026 it must start reporting higher than expected earnings. Therefore 2027 is the turning-point if Cisco does not report the $4.32 EPS suggested by the second model, then my whole thesis is at risk.
Furthermore, Splunk represents a risk if it does not adds as much value to the company as estimated in the acquisition process. This would leave Cisco with a $28 billion debt burden.
Finally, there is the risk of market sentiment, because Cisco is not a fast-growth company as NVIDIA Corporation (NVDA) or Advanced Micro Devices, Inc. (AMD) therefore, if it continues to lower their forecast, which is what happened in Q1 and Q2 2024, the stock could continue to underperform, as it has done since the past 5 years, where the stock has remained flat.
Conclusion
In conclusion, Cisco, despite lowering its forecast for a second consecutive time, remains a very profitable opportunity. The two models indicate a fair price range of $65.36 – $70.39 and a future price for 2029 range of $99.77 – $100.78.
Nevertheless, momentum and downward earnings revisions remain a strain on Cisco’s stock price, and according to the second DCF model, Cisco could miss 2024, 2025 and 2026 EPS estimates by 8.3%, 5.41% and 2.34% respectively and it would still be undervalued by 40%. However Cisco would need to beat estimates in 2027-2029. This gives investors time to wait for Cisco to do a turnaround or enter a new market, or whatever idea they have, in order to beat estimates for 2027-2029.
Taking this into account, I reiterate my strong buy rating for Cisco, and I will set a fair price target of $67.87 and a future price for 2029 of $104.25, which is the average calculated from the results of both DCF models.
Analyst’s Disclosure: I/we have no stock, option or similar derivative position in any of the companies mentioned, but may initiate a beneficial Long position through a purchase of the stock, or the purchase of call options or similar derivatives in CSCO over the next 72 hours. I wrote this article myself, and it expresses my own opinions. I am not receiving compensation for it (other than from Seeking Alpha). I have no business relationship with any company whose stock is mentioned in this article.
Seeking Alpha’s Disclosure: Past performance is no guarantee of future results. No recommendation or advice is being given as to whether any investment is suitable for a particular investor. Any views or opinions expressed above may not reflect those of Seeking Alpha as a whole. Seeking Alpha is not a licensed securities dealer, broker or US investment adviser or investment bank. Our analysts are third party authors that include both professional investors and individual investors who may not be licensed or certified by any institute or regulatory body.