Summary:
- Coca-Cola’s Q1 earnings beat expectations, with adjusted per-share earnings of $0.72 and revenues of $11.3 billion.
- Demand for Coca-Cola’s soft drinks contributed to the positive results.
- Coca-Cola’s stock trend is reaching an exhaustion point and may face resistance, which could cause further downside retracements in the months ahead.
pjohnson1
Coca-Cola (NYSE:KO) shares are seeing some lift after the classic beverage producer reported first-quarter earnings results that surpassed analyst expectations. For the period, Coca-Cola generated adjusted per-share earnings results of $0.72 (beating expectations of $0.70) on $11.3 billion in revenues (beating expectations of $11.01 billion). Net income for the period rose to $3.18 billion ($0.74 per share), which marked an improvement from the $3.11 billion ($0.72 per share) that was recorded during the same period last year and organic revenue guidance for the full-year period was also increased to 8-9% (relative to the company’s prior expectations of 6-7%).
Strong portions of these positive quarterly results were driven by an increase in demand for the company’s Fairlife and Fanta soft drinks, and it should also be noted that Coca-Cola reported Bodyarmor impairment charges (non-cash) of $760 million. Sports drink maker Bodyarmor was purchased for $5.6 billion in 2021 to enable Coca-Cola to maintain a more competitive edge in the rapidly growing markets of sports and energy drinks, and the company explained that this impairment charge resulted from projection revisions and changes in the discount rate following the Bodyarmor purchase. Overall, the earnings report marked a positive surprise for Coca-Cola, and we will next take a look at the long-term and short-term price charts to see how this new information might impact share prices going forward.
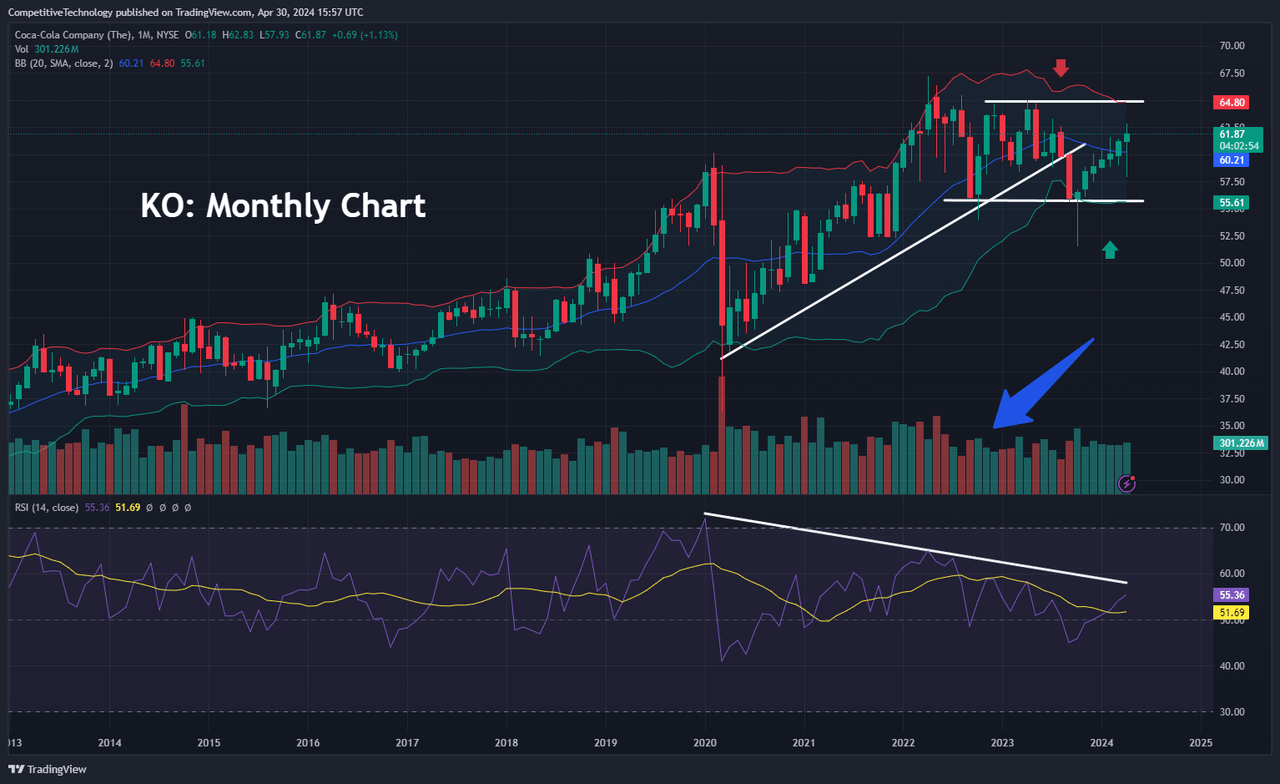
KO: Monthly Chart (Income Generator via TradingView)
On the monthly charts, we can see that KO shares are caught in a broad, long-term uptrend, with dominant highs of $67.20 posted in April 2022. However, bull trend activity is starting to become a bit erratic at this stage – and we do have some evidence here which suggests that this uptrend might be reaching a period of exhaustion.
Specifically, the stock failed to re-test those April 2022 highs after experiencing the initial declines to $54.02 in October 2022. Furthermore, KO shares broke that support zone to the downside during the spike lows to $51.55 in October 2023 and are not attempting to make a recovery back above $60. Unfortunately, indicator readings in the Relative Strength Index (RSI) are not aligning in support of this recovery, as the bearish trend (which started near the beginning of 2020) remains fully in place and currently has additional room to extend to the downside.
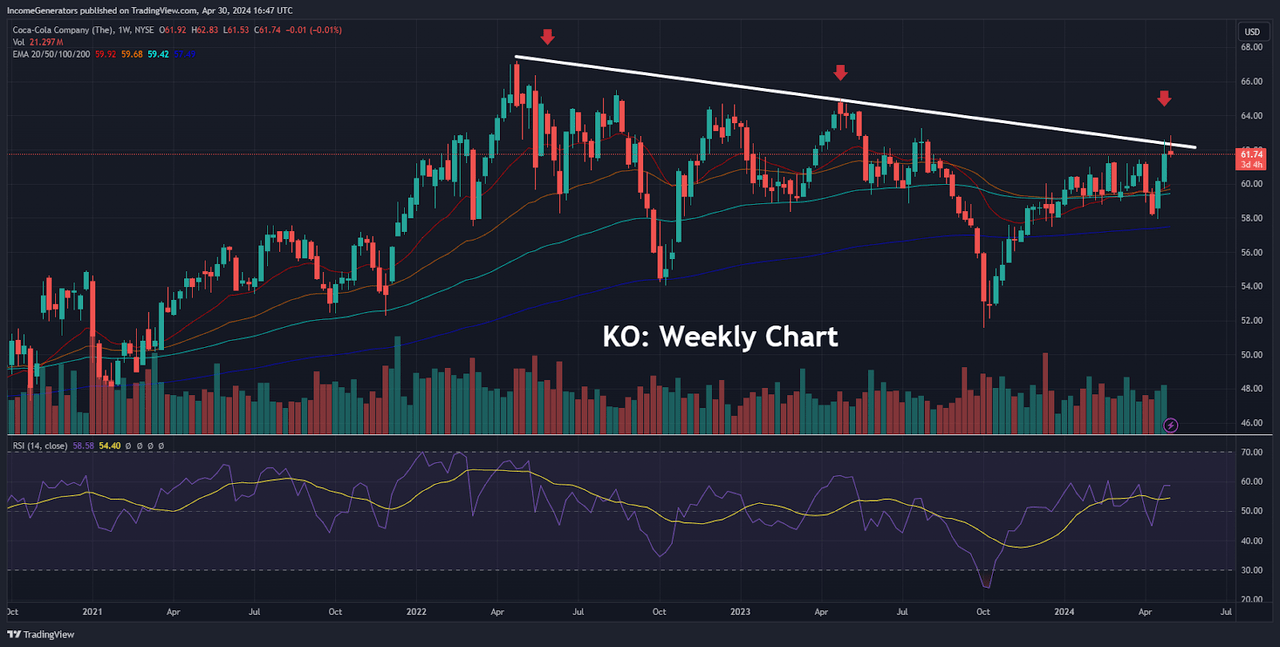
KO Weekly Chart: Lower Highs (Income Generator via TradingView)
On the weekly charts, KO shares are much more top-heavy, and it is important to note the proximity of the stock’s exponential moving average cluster with respect to market prices themselves. Specifically, the 20-week, 50-week, 100-week, and 200-week exponential moving averages are all aligning just below the $60 handle and any further declines would then create a scenario in which each of those exponential moving averages would be expected to work as resistance containing bullish price action.
On the positive side, we can say that RSI indicator readings are nowhere near overbought levels (even with all of the buying activity that has occurred since the October 2023 lows). But the series of lower highs that has been recorded during the move lower from $67.20 makes it even more likely that RSI indicator readings will begin to fall in the bearish direction – and a movement like this would have plenty of room to extend downward because RSI values are currently hovering near the mid-point of the histogram.
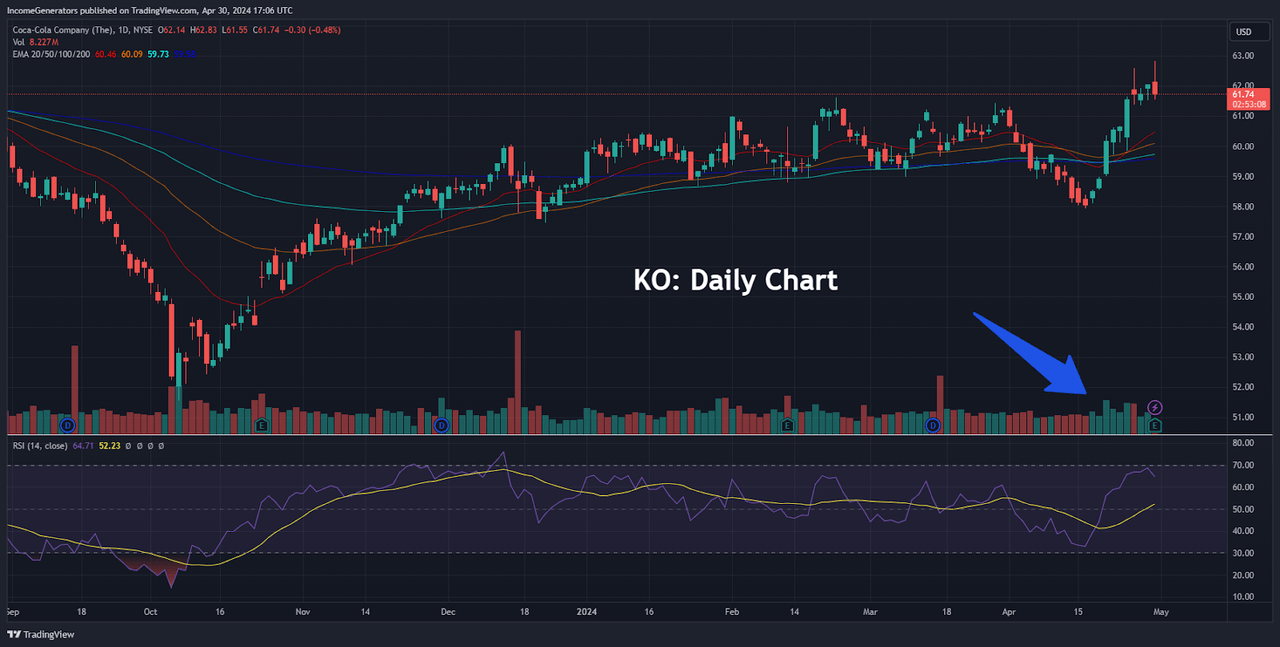
KO Daily Chart: Moderately Positive (Income Generator via TradingView)
Staying with the theme of RSI indicator readings, we can see that the daily chart does offer a bit more evidence supporting the bullish side of the argument. Specifically, recent rallies above the $60 mark have not actually forced the RSI into overbought territory (although it is currently holding quite close to this region). Daily charts also show that the market price is holding KO above its 20-day, 50-day, 100-day, and 200-day exponential moving average cluster, so this aspect of the longer-term analysis readings is faring a bit better than the price structures shown on the weekly and monthly charts.
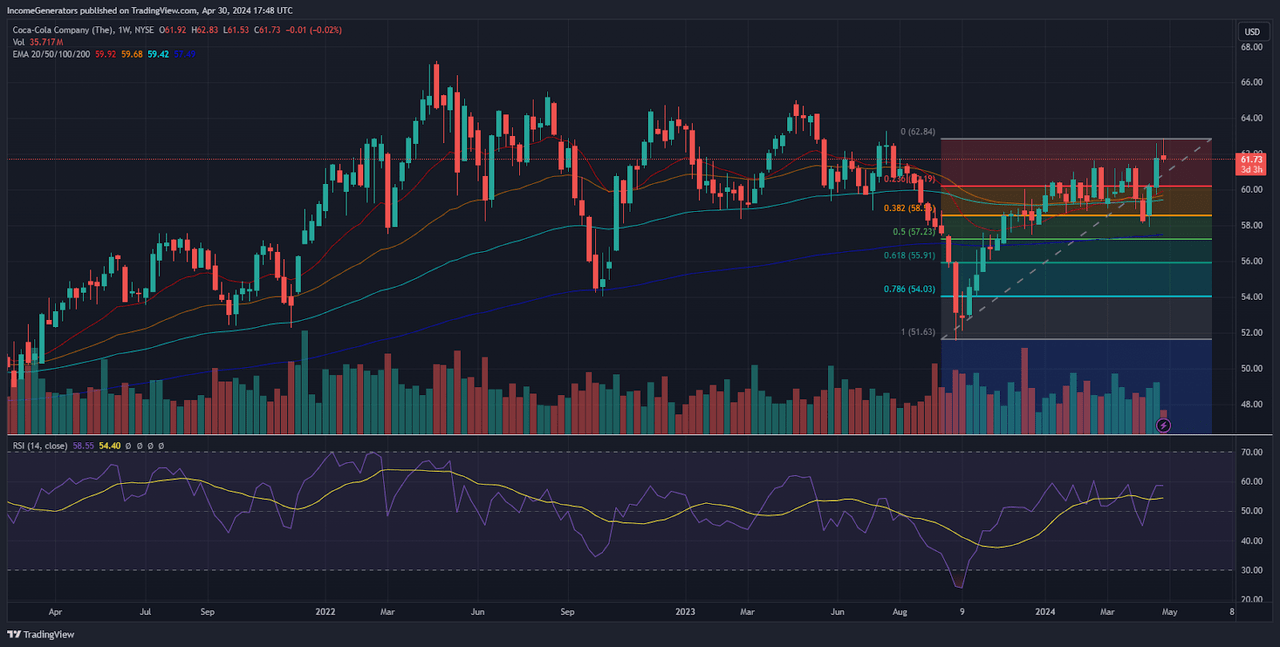
KO: Fibonacci Retracement Levels (Income Generator via TradingView)
All of that said, however, we must lend greater credence to the longer-term timeframes as the evidence displayed on the weekly and monthly charts appears to be much more impactful than the relatively weak evidence for a rally that is currently showing on the daily charts. If Coca-Cola’s recent earnings figures are not enough to force stock prices through resistance levels just below $65 per share, our bias will remain bearish, and we will begin to target new support zones at lower levels. Using Fibonacci retracement analysis, we can see that the dominant price move from the lows of $51.55 to the recent highs of $62.83 gives us a 23.6% Fibonacci retracement level near $60.20. Remember, this region closely aligns with the cluster of exponential moving average levels that can be found on the weekly charts, so there is a confluence of technical indicators in this region which adds to its validity as a downside price target.
Given this collection of technical signals, it stands to reason that a downside break through the $60 could see continued follow-through until the market is able to establish another level of support to the downside. Below $60.20, the 38.2% Fibonacci retracement of the aforementioned move can be found just above $58.50 in a price region that aligns within close proximity to the closing price candle recorded on April 8th, 2024. Extending downward from here, the 50% retracement of this near-term price move can be found just above $57.20 and the 61.8% Fibonacci retracement of this move can be found just above $55.90.
Overall, Coca-Cola’s most recent earnings report revealed more positives than negatives – but it is not entirely clear that these results will be strong enough to propel share prices much higher from here. Unfortunately, the stock has had a great deal of difficulty in generating upward momentum after posting its long-term highs in April 2022 and there does not seem to be much in the way of fundamental catalysts that will have the potential to change these trends during the first-half of 2024. Our bearish bias would be invalidated if KO is able to make a decisive break above the $65 level – but, if this does not occur, we believe it makes more sense for investors to set price targets in favor of renewed downside retracements.
Analyst’s Disclosure: I/we have no stock, option or similar derivative position in any of the companies mentioned, but may initiate a beneficial Short position through short-selling of the stock, or purchase of put options or similar derivatives in KO over the next 72 hours. I wrote this article myself, and it expresses my own opinions. I am not receiving compensation for it (other than from Seeking Alpha). I have no business relationship with any company whose stock is mentioned in this article.
Seeking Alpha’s Disclosure: Past performance is no guarantee of future results. No recommendation or advice is being given as to whether any investment is suitable for a particular investor. Any views or opinions expressed above may not reflect those of Seeking Alpha as a whole. Seeking Alpha is not a licensed securities dealer, broker or US investment adviser or investment bank. Our analysts are third party authors that include both professional investors and individual investors who may not be licensed or certified by any institute or regulatory body.
