Summary:
- Comcast is a global media company and a broadband leader.
- The Company has a strong balance sheet and free cash flow.
- The revenue and earnings growth is slow but stable.
- The share price seems fair under the free cash flow valuation model.
Joe Raedle/Getty Images News
Comcast Corporation (NASDAQ:CMCSA) is the market leader in very large and profitable markets. A strong balance sheet and a great ability to convert earnings into free cash flow enable Comcast to compete and grow in a very competitive arena.
The capital is used to remunerate shareholders in terms of dividends and buybacks. Based on the fundamentals, it seems that the dividend is financially sustainable also for the future quarter. The management also claims to prefer capital spending in investments for the network growth (without foreseeing M&A) but comparing the growth data with the competitors and analyzing the trend of the CapEx it seems that this strategy is struggling to take off. This last aspect together with the increasingly fierce competitive arena represents, in my opinion, the main elements of risk.
The share price seems fair if based on the cash flow and based on the earning power value valuation. My rating is Buy.
General Overview
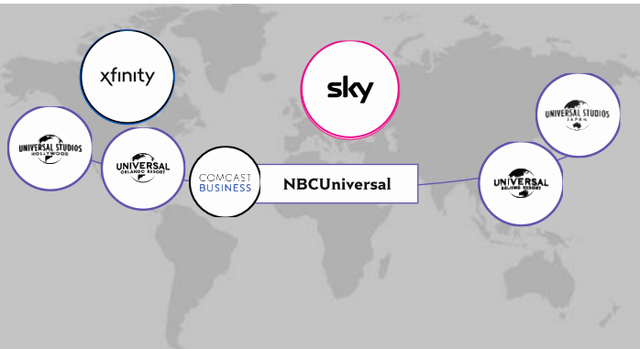
Comcast Corporation is a worldwide media company with 3 macro businesses: Comcast Cable, NBCUniversal, and Sky.
- Comcast is referred to cable communications segment and under the Xfinity brand is the main service provider of broadband, wireless, video, and voice to consumers in the US. Comcast represents 53% in revenue terms.
- NBCUniversal represents 31% in revenue terms and is referred to 3 sub-segments:
- Media: is a television and streaming platform with the NBC and Telemundo and Peacock networks
- Studios with tv movies and entertainment studio production
- Theme Parks with 4 Universal theme parks in the US (Orlando e Hollywood), in Japan (Osaka), and in China (Beijing).
3. Sky is referred to video, broadband, wireless, and voice services provided in Europe. Sky represents 16% in revenue terms.
The company was born in 1963 with cable system operations, was incorporated in 2001 under the laws of Pennsylvania, and grew also by acquisition: NBCUniversal in 2013 and Sky in 2018.
Financial & Highlights
Revenue and Profitability
Comcast Form 10-K + Author Graph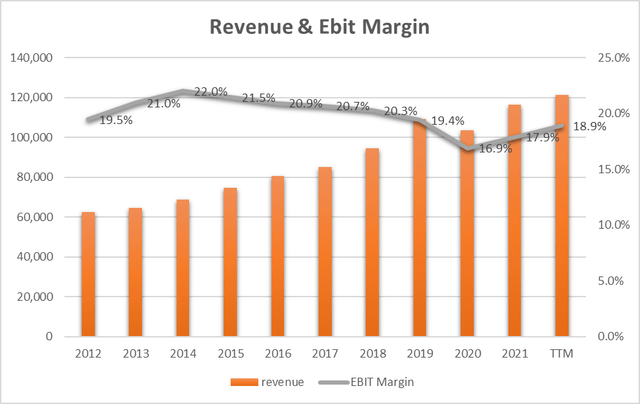
Revenue (orange bars) grows at a compound annual rate of 6.8% doubling (from $62.5B to $121.2B) over 10 years. The EBIT Margin, on the other hand, is not growing and is struggling to match the pre-pandemic value. Today it stands at 18.9%, growing in the last two years but at a lower level than in all the years from 2012 to 2019. The latest acquisition of 2018 (SKY) brought a benefit in Revenue but not in the margins in terms of EBIT.
Comcast Form 10-K + Author Graph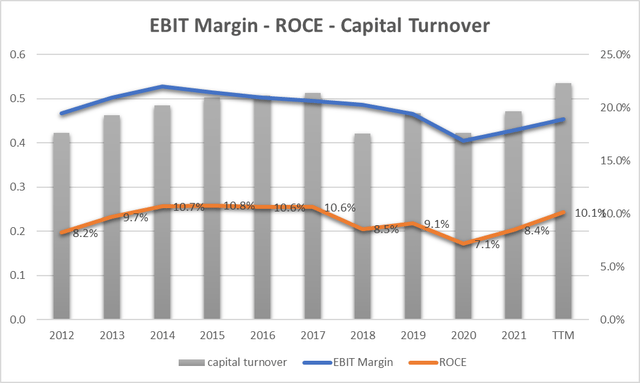
If we instead look at the ROCE – Return on Capital (yellow line) we can see how this ratio in 2022 (10.1%) returned to pre-pandemic values. This is mainly due to the company’s ability to grow Capital Turnover (grey bars) equal to $0.54 (TTM) or the highest value in the last 10 years. The company today produces $0.54 for every $1 employed. The growing trend is mainly due to the sustained growth of Revenue without greater use of assets which have instead decreased.
We can therefore underline an increase in profitability in terms of capital employed while an almost descending (except the last 2 years) trend of margins in operational terms.
Free Cash Flow – EPS – Dividend – CapEx
Comcast Form 10-K + Author Graph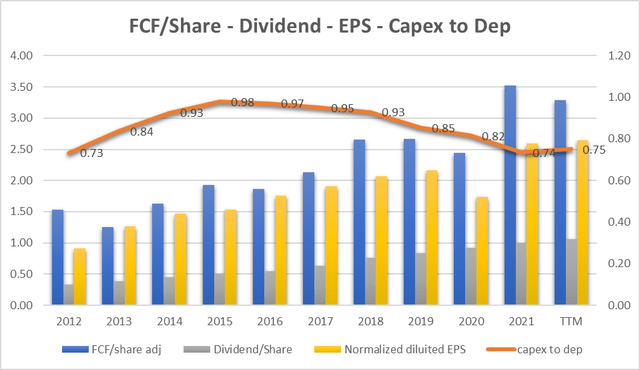
EPS (yellow bar) grew from $0.91 to $2.64 by 11.2% (CAGR) – outpaced the EBIT margin in part due to the company’s share buyback.
Free Cash Flow per share (blue bars) grew 8% (CAGR) less than EPS and this is mainly due to slower growth in Operating Cash Flow. We can see from the graph how earnings manage to constantly generate Free Cash Flow even if with slightly slower growth.
The dividend (grey bars) increased from $0.33 to $1.06 with annual growth (CAGR) of 12.4%. From the graph, we can see how the dividend is largely covered by the EPS and the FCF and the growth trend is essentially stable. This could ensure sustainability in future years. The higher rate of growth also identifies a tendency on the part of the company to use the funds mainly for a return of capital to shareholders.
The management underlines the strategy in the last Earning call:
We pay nearly $5 billion in dividends per year and we bought back $9.5 billion of our shares year-to-date through the third quarter. We have a great business including a fantastic team.
The orange line represents the ratio between CapEx and Depreciation. A figure close to one represents an ideal use of capital in CapEx. We can see how this value was close to one in the years from 2014 to 2018 after which we see a decreasing trend up to 0.75. This could indicate that the company has underestimated funds used in asset maintenance investments and in the long run could mean that additional funds will need to be invested in CapEx.
This trend highlighted in the Cap to depth Ratio seems to be in slight contrast with what was stated by management (last Q3 call):
We had record profits in the Theme Parks business and record profits in the Studio businesses, so just to call out a few examples. And those are the result of us putting tremendous energy and effort and capital back in our businesses. So, when we talk about the formula that we’ve got, it’s always with the view to have growth opportunities in our existing businesses, so we can put capital to work and in the future get the kind of results we’ve had now on the back of the investments that we have had in the past. So, priority one right now is to invest in the network.
It seems that the strategy is to put all the capital in the network but the data sheet shows a little bit different trend.
Valuation
Earnings Power Value Model
Assuming that the cash profit remains constant over the long term, I use the EPV (earnings power value) method to calculate the share price.
The method starts with EBIT. The second step is to add depreciation and amortization and then subtract stay-in-business CAPEX.
The result is the Cash Trading Profit.
I then subtract the taxes by calculating the amount using the actual tax rate that the company pays.
The result is the After-Tax Cash Trading Profit.
At least to calculate the total company enterprise value I divide the After-Tax Cash Profit by the interest Rate I define as fine for this kind of Company (Comcast is a medium-risk company so I decided to use 10%).
The result is the Total Company Earnings Power Value. Dividing the result by the total number of shares we find the value per single share.
The table below shows the calculation for CMCSA:
|
EBIT |
22,915.00 |
|
Dep & amort |
13,931.00 |
|
CAPEX |
-10,462.00 |
|
Cash Trading Profit |
26,384.00 |
|
TAX |
47.00% |
|
TAX |
-12400.48 |
|
After TAX cash profit |
13,983.52 |
|
Interest Rate |
10% |
|
EPV |
139835.2 |
|
Share in issue |
4,323.40 |
|
EPV per share |
32.3 |
$32.3 represents the share price valuation using the EPV method. If we compare the data with the current market price ($35) we see that the current price could be seen as fair.
FCF/Share Model
To define a maximum buying price, I use also a formula based on FCF/Share and interest rate.
The formula is:
Maximum buying price = Cash profit per Share/interest rate – 20% (safety discount)
If TTM Cash Profit per share is $3.29
Interest Rate=inflation Rate = 7.1%
Maximum price before Safety discount = 3.29/7.1%= $43.9
The maximum price at 20% discount = $36.6
Under the FCF/Share analysis, it seems that the actual price of $35 is fair.
Both valuation models converge on a share intrinsic value between $32 and $36 and this represents an interesting element in terms of investment in the long run.
Peers Comparison
To compare CMCSA with similar companies in terms of market capitalization in the Cable and Satellite industry I have defined the following peers:
Charter Communications, Inc. (CHTR)
Sirius XM Holdings Inc. (SIRI)
Shaw Communications Inc. (SJR)
The Liberty SiriusXM Group (LSXMK)
Liberty Broadband Corporation (LBRDK)
Using Seeking Alpha’s Quant Ratings we have a ‘Hold’ verdict related to the ‘Hold’ and ‘Buy’ and ‘Strong Buy’ ratings of the other company.
From the Quant Factor Grades point of view, we can see how Comcast is outstanding in Profitability and this factor represents one of the most important reasons to invest in CMCSA. In Momentum and EPS Revision, the grade is not outstanding but is a respectable ‘B’ and ‘B-‘. Valuation and overall Growth represent the main negative factors of grades in comparison with peers.
This comparison allows us to understand how at this moment Comcast is experiencing positive momentum in Profitability and although the growth is not up to the peers we can certify that the company is stable and growing in absolute value. The management also underlines the concept (Q3 Earnings call):
I firmly believe that Comcast is in a very strong position relative to our peers and most other companies.
Risks
Broadband competition
Although the Company thinks that its leadership position is strong enough (Q3 Earnings call):
We have a distinct competitive advantage that goes beyond just fast and consistent speeds. We provide a differentiated and superior experience within the home, which is the foundation of our ARPU growth. For example, we offer reliable WiFi coverage in every room, device control and cybersecurity features, and a world-class entertainment platform as well as other complementary solutions like Xfinity Mobile that increase the value and utility of our broadband product even more.
We have seen as competitors are growing faster than Comcast and I think that ARPU could be affected not only by an inflationary environment but also by competition in the broadband arena where also mobile providers such as AT&T (T) and Verizon (VZ) are ready to compete.
CapEx
Related to the competition I have to underline also the investing strategy. Although the management claims to use all the capital to invest in the network, in reality, a large part of the funds is destined for the remuneration of the shareholders in terms of dividends and the repurchase of common shares. The CapEx trend seems to be decreasing compared to depreciations and this could be an element of risk with a view to the sustainability of future growth.
Final Thought
Comcast’s revenue is growing by 6.8% annually, EPS and dividend are growing in double-digits while the Free Cash flow is at 8%. The data underline a stable and sustainable trend. The EBIT margin appears to be flat in the long run but still stands at 18.9%, a respectable figure. The risks at the moment seem to be quite contained and a fair market valuation with a good 3% dividend yield pushes me to invest in Comcast with a long-term perspective. My rate is Buy.
Disclosure: I/we have a beneficial long position in the shares of CMCSA either through stock ownership, options, or other derivatives. I wrote this article myself, and it expresses my own opinions. I am not receiving compensation for it (other than from Seeking Alpha). I have no business relationship with any company whose stock is mentioned in this article.

