Summary:
- Nike just reported earnings and revenue that exceeded the consensus expectations.
- The outlook for EPS growth is muted and the valuation is quite high relative to current earnings.
- The Wall Street consensus outlook continues to be a buy, but the consensus price target has been substantially reduced.
- The market-implied outlook (calculated from options prices) is slightly bullish for 2023.

Joe Raedle
Nike (NYSE:NKE) just reported solid results for FY 2023 Q2, beating expectations on earnings and revenues. Revenue was up 17.3% YoY. While the shares have risen about 12% for the day, they’re down almost 26% over the past 12 months. It’s also notable that the forward P/E, 34.59, continues to be quite high. The substantial earnings beat was relative to a modest consensus prediction.

Seeking Alpha
12-Month price history and basic statistics for NKE (Source: Seeking Alpha)
Including the most recent quarter, NKE has beaten expectations on EPS for 10 successive quarters. Over this period, there’s essentially no earnings growth, which has probably contributed to negative sentiment on the stock. The consistent expectation-beating performance reflects a muted consensus outlook. Earnings growth is a significant concern, and the consensus outlook is for a modest 7.49% compound annual EPS growth over the next three to five years. Seeking Alpha’s Growth Grade for NKE is a D.

ETrade
Trailing (3 years) and estimated future quarterly EPS for NKE. Green (red) values are amounts by which EPS beat (missed) expectations (Source: ETrade)
I last wrote about NKE on Jan. 19, 2022. While the valuation was a concern, the Wall Street consensus rating was a buy and the consensus 12-month price target was 22.5% to 27% above the share price at that time. The market-implied outlook, a probabilistic price forecast that represents the consensus view from the options market, was slightly bullish to the middle of 2022, but slightly bearish for the full year. I upgraded NKE from a hold to a buy because of the bullishness of the Wall Street consensus and the near-term market-implied outlook. I planned to revisit the situation near mid-2022, but I did not do so. From the January 19th closing price, NKE has returned -19.4% vs. -13.1% for the S&P 500 (SPY) over the same period.
For readers who are unfamiliar with the market-implied outlook, a brief explanation is needed. The price of an option on a stock is largely determined by the market’s consensus estimate of the probability that the stock price will rise above (call option) or fall below (put option) a specific level (the option strike price) between now and when the option expires. By analyzing the prices of call and put options at a range of strike prices, all with the same expiration date, it’s possible to calculate a probabilistic price forecast that reconciles the options prices. This is the market-implied outlook. For a deeper explanation and background, I recommend this monograph published by the CFA Institute.
With 11 months since my last analysis, I have calculated updated market-implied outlooks and compared these with the current Wall Street consensus outlook in revisiting my rating on NKE.
Wall Street Consensus Outlook for NKE
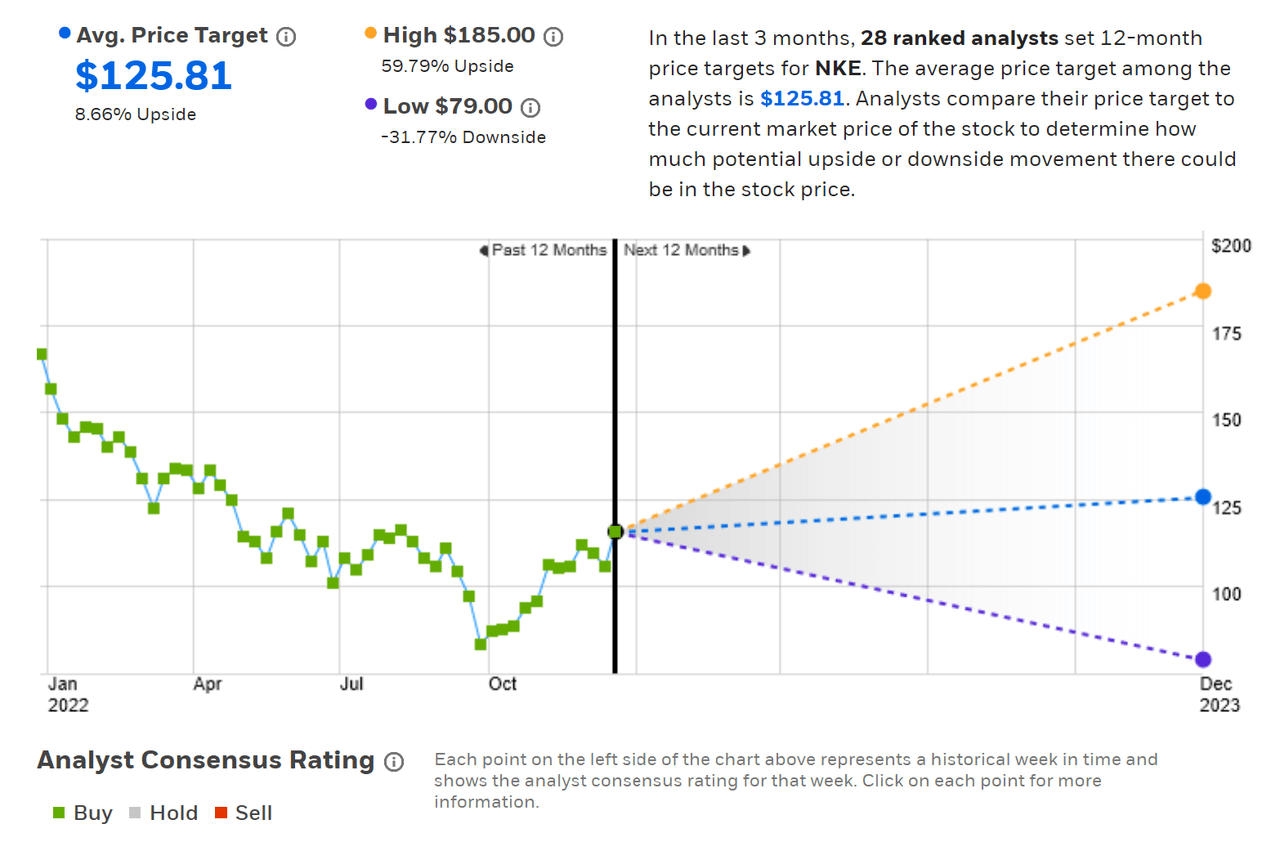
ETrade calculates the Wall Street consensus outlook for NKE using the views of 28 ranked analysts who have published ratings and price targets within the past three months. The consensus rating is a buy, as it has been for all of the past year, and the consensus 12-month price target is $125.81, 8.66% above the current share price. The consensus price target has been reduced dramatically, at which time it was $187.60. It’s also notable that the spread among the individual analyst price targets has increased substantially. Back in January, the highest and lowest price targets were $202 and $170, from a group of 20 ranked analysts. Today, the highest and lowest price targets are $185 and $79, from a group of 28 ranked analysts. While we expect that this spread will increase as the number of analysts gets bigger, this change is dramatic. The larger the spread among the individual price targets, the lower the predictive value. As a rule of thumb, I strongly discount the consensus when the ratio of the largest and smallest price targets exceeds 2. Back in January, this was not the case. Today, the ratio is 2.34.
ETrade
Wall Street analyst consensus rating and 12-month price target for NKE (Source: ETrade)
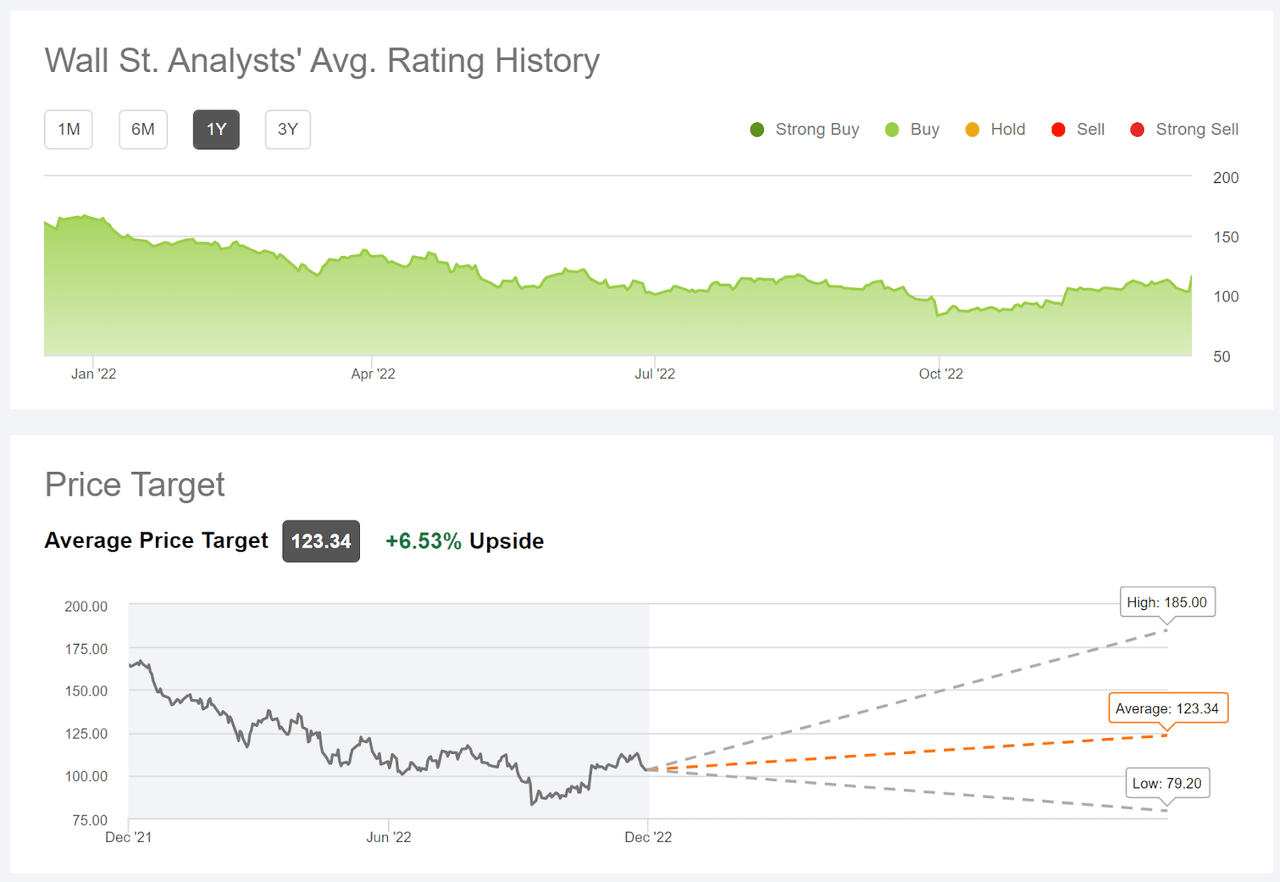
Seeking Alpha’s version of the Wall Street consensus outlook is calculated using price targets and ratings from 37 analysts who have published their views over the past 90 days. The results are consistent with those from ETrade. The consensus rating is bullish and the consensus 12-month price target is $123.34, 6.53% above the current share price. The highest and lowest price targets from this larger sample of analysts are the same as in the ETrade results.
Seeking Alpha
Wall Street analyst consensus rating and 12-month price target for NKE (Source: Seeking Alpha)
While the Wall Street consensus rating continues to be a buy, there are two obvious areas of concern. First, with the reduced 12-month price target, the expected upside is low. Second, there’s a high level of disagreement among the analysts, such that I have little confidence in the predictive value of the consensus.
Market-Implied Outlook for NKE
I have calculated the market-implied outlook for NKE for the 5.8-month period from now until June 16, 2023, and for the 12.9-month period from now until January 19, 2024, using the prices of call and put options that expire on these dates. I selected these specific dates to provide a view to the middle of 2023 and through the full year.
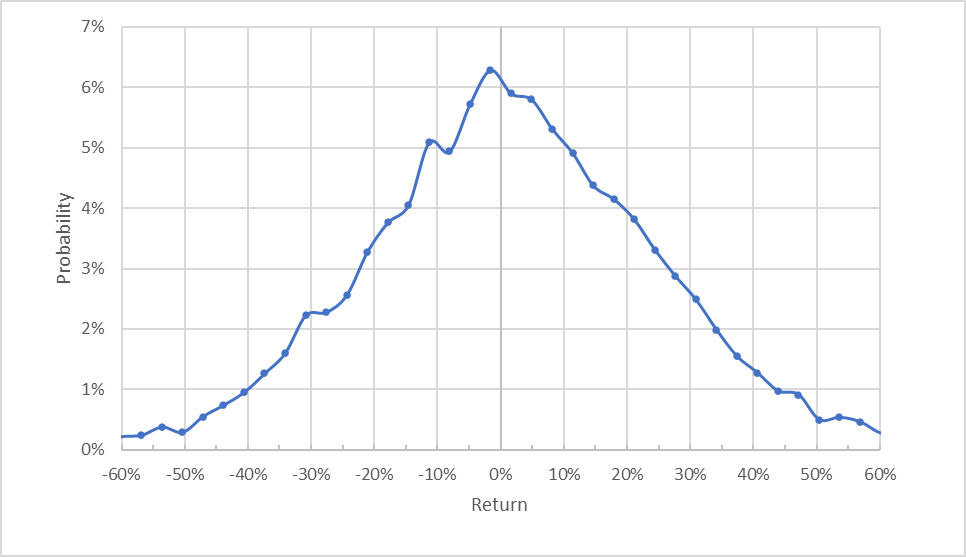
The standard presentation of the market-implied outlook is a probability distribution of price return, with probability on the vertical axis and return on the horizontal.
Geoff Considine
Market-implied price return probabilities for NKE for the 5.9-month period from now until June 16, 2023 (Source: Author’s calculations using options quotes from ETrade)
The market-implied outlook to the middle of 2023 is generally symmetric, with comparable probabilities of positive and negative returns of the same magnitude. The peak in probability corresponds to a price return -1.63%, not meaningfully different from zero given the spread in the distribution. The expected volatility calculated from this distribution is 36%.
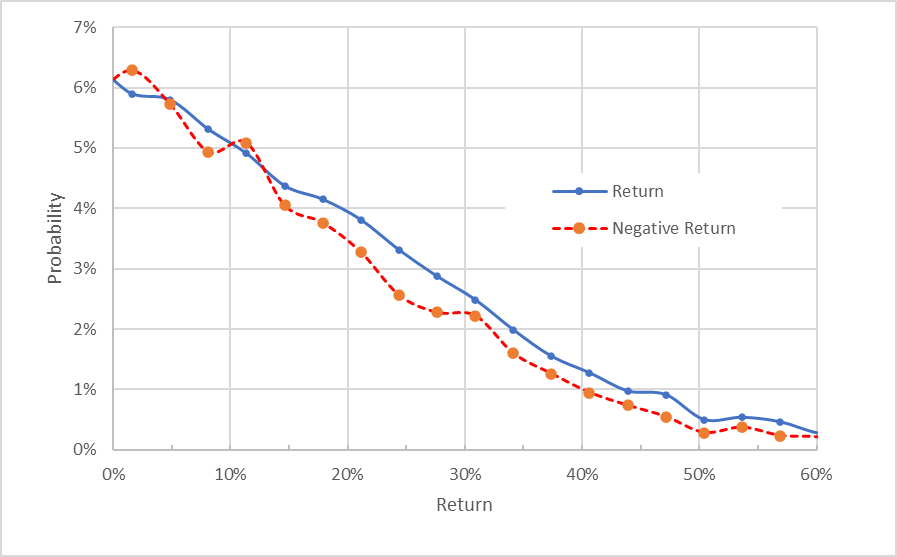
To make it easier to compare the relative probabilities of positive and negative returns, I rotate the negative return side of the distribution about the vertical axis (see chart below).
Geoff Considine
Market-implied price return probabilities for NKE for the 5.9-month period from now until June 16, 2023. The negative return side of the distribution has been rotated about the vertical axis (Source: Author’s calculations using options quotes from ETrade)
This view shows that the probabilities of positive returns are, in fact, slightly higher than those for negative returns of the same magnitude, across almost the entire range of possible outcomes (the solid blue line is at or above the dashed red line over the majority of the chart above). This is a bullish tilt to the outlook.
Theory indicates that the market-implied outlook is expected to have a negative bias because investors, in aggregate, are risk averse and thus tend to pay more than fair value for downside protection. There’s no way to measure the magnitude of this bias, or whether it is even present, however. The expectation of a negative bias reinforces the bullish interpretation of this outlook.
The outlook for the next 12.9 months also has similar probabilities of positive and negative returns. For the highest-probability outcomes, negative returns appear a bit more likely (the dashed red line is above the solid blue line over the last one-fourth of the chart below). The probabilities of larger-magnitude price returns slightly favors positive returns (the solid blue line is above the dashed red line over the right ¾ of the chart). Given that theory suggests that the market-implied outlook will tend to have a negative bias, I interpret this outlook as slightly bullish. The expected volatility calculated from this distribution is 36% (annualized).
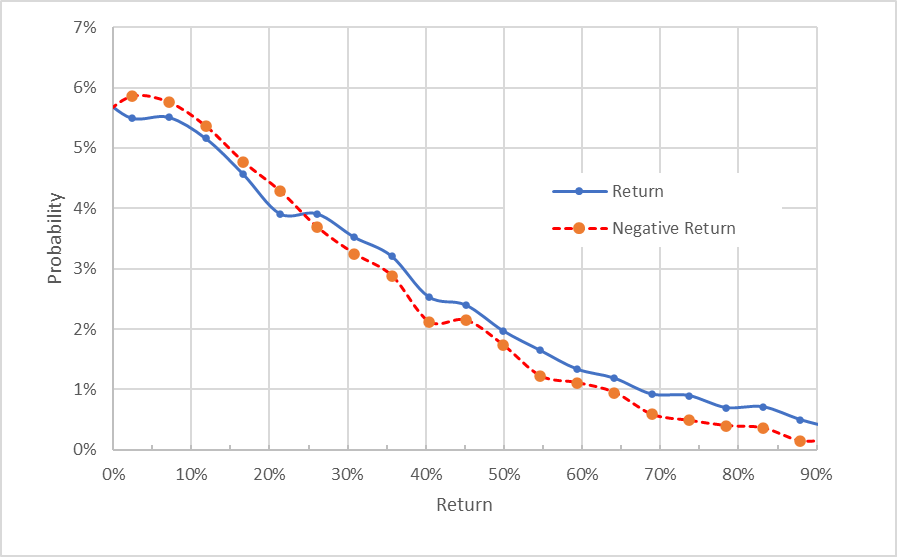
Geoff Considine
Market-implied price return probabilities for NKE for the 12.9-month period from now until January 19, 2024. The negative return side of the distribution has been rotated about the vertical axis (Source: Author’s calculations using options quotes from ETrade)
The updated market-implied outlooks for NKE are moderately bullish to the middle of 2023 and slightly bullish for the full year, with a consistent 36% in expected volatility. The longer-term outlook is considerably more favorable than the 12-month outlook from my previous post.
Summary
Nike’s recent earnings beat must be considered relative to the modest expectations prior to the report. The outlook for earnings growth is muted and the valuation continues to look quite expensive, even with the substantial decline in the share price over the past year. The Wall Street consensus rating is a buy, as it has been for all of the past year, and the consensus 12-month price target is 6.5% to 8.7% above the current share. This is not a lot of upside potential for a stock with this level of expected volatility (36%). As a rule of thumb for a buy rating, I want to see an expected total return that is at least ½ the expected volatility. NKE falls far short of this threshold. In addition, I’m not confident that the consensus price target is a useful guide, given the high dispersion in the analyst views that contribute to the consensus. Even with the 12%-plus jump in the share price today, the market-implied outlooks are generally favorable for NKE over the next year, although more so for the first half. Because of the conflicting indications, I’m downgrading NKE to a hold.
Disclosure: I/we have no stock, option or similar derivative position in any of the companies mentioned, and no plans to initiate any such positions within the next 72 hours. I wrote this article myself, and it expresses my own opinions. I am not receiving compensation for it (other than from Seeking Alpha). I have no business relationship with any company whose stock is mentioned in this article.
