Summary:
- Despite some headwinds, the underlying force to dominate Dell Technologies Inc. stock in the next ~2 years is its business cycle.
- My assessment is that Dell is currently transitioning out of the contracting phase and starting a new expansion phase.
- My conclusion is reached after analyzing its inventory levels (the topic of my previous article) and its growth drivers (the topic of this article).
Devrimb/iStock via Getty Images
DELL stock’s cyclicality
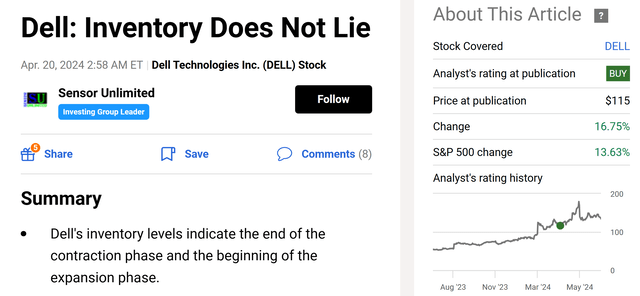
I last analyzed Dell Technologies Inc. (NYSE:DELL) about 3 months ago. The article was titled “Dell: Inventory Does Not Lie” and was written on April 20, 2024, as illustrated by the chart below. As the title suggests, that article focused on the use of its inventory levels as a key indicator of the status of its business cycle. Quote:
The gist of my bullish thesis is that the contracting phases of the current cycle are ending, the expansion phase is beginning judging by the inventory levels. Analyst estimates suggest robust future earnings growth and I indeed see plenty of catalysts to support such projections.
The stock has indeed delivered good returns since then. Its stock price at the publication of my last article was $115, and it has since increased by 16.75%. In contrast, the S&P 500 (SP500) has increased by 13.63% during this time (a remarkable performance in its own right).
Considering the sizable price change and the new financial information released by the company since my last writing, my goal here is to provide an updated assessment of the stock from a different perspective. As just mentioned, my last article concentrated on its inventory data. In this article, I want to take a more holistic view of the business and assess its business cycles. And you will see that my results show that despite the price advancement, the stock is still trading near a cyclical low and thus still offers a good buying opportunity.
DELL stock: top-line growth indicates the beginning of expansion cycle
The first indicator of DELL being near a cyclical low is the valuation discount. More specifically, the chart below summarizes DELL stock’s valuation grade. As seen, Dell’s P/E ratios are drastically lower than the sector median. To wit, its P/E ratio is only 18.94 on a TTM and non-GAAP basis, which is more than 24% lower than the sector median of 24.95. On an FWD basis, its P/E is even lower (17.35) and the discount is even deeper (32.25%).
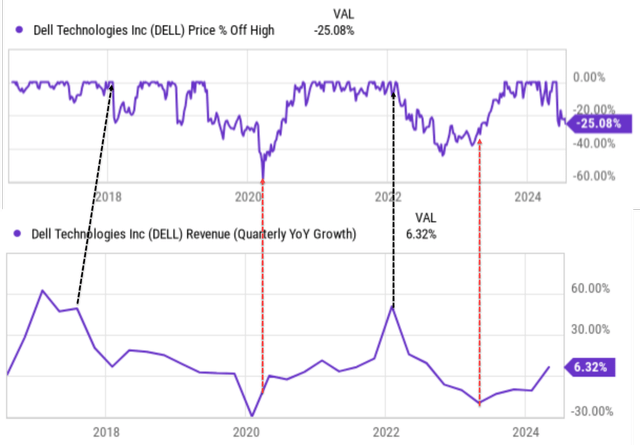
However, for cyclical stocks like DELL, I rely more on revenue information (and also inventory data as analyzed in my previous article) rather than net profit. The underlying cyclicality can make its net profit – especially account profit – highly erratic. DELL’s revenue growth, in contrast, has historically displayed tractable patterns (i.e., cycles) as seen in the next chart.
In this chart, I plotted its price corrections in the top panel for the past 10 years and the quarterly revenue growth rate on a YOY basis in the bottom panel. You can clearly see at least two complete cycles during this period, as highlighted by the red and black dotted lines. The expansion phases were marked in black. In these phases, DELL’s revenue grew at annual rates close to 60%. These super growth phases were followed by deep price pullbacks (on the order of ~30% to 40%). Vice versa, the contraction phases (marked by red) are characterized by a large topline decline (of around 30% YOY) but were followed by a sharp stock price recovery.
Based on such historical cycles, my assessment is that DELL is currently near the end of the previous contracting phase and is entering a new expansion phase. As seen, it has been suffering negative YOY top-line growth in recent quarters and has reported a slight positive growth (6.32%) in the past quarter.
Next, I will elaborate on the business fundamentals that could support an expansion phase.
DELL stock: business fundamentals
As a cyclical business, Dell has been facing several headwinds recently. Its mixed results for Q1 2024 (fiscal quarter ended May 3rd) provide a reflection of these headwinds. Sales at the Client Solutions Group were essentially flat, as gains from commercial customers were offset by declines from consumer clients. However, despite the rise in revenues during the period, share earnings of $1.27 decreased by 3% compared to the prior year. The decline was mostly due to a more competitive pricing environment and an unfavorable product mix, both stemming from the IT upgrade cycle, in my view.
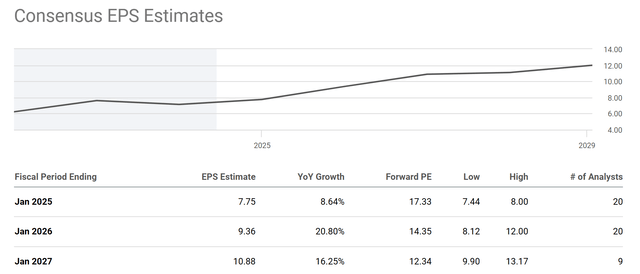
However, looking ahead, I see strong EPS growth potential in the next ~2 years or so. The consensus EPS estimates seem to share the view, as illustrated by the chart below. To wit, the consensus EPS estimates for DELL point to an EPS of $7.75 for FY 2024, which is a healthy increase of 8.64% from the previous year. The bulk of the EPS recovery/growth would start in FY 2026.
I indeed see a range of earning catalysts that could drive such growth. The top one on my list is the Infrastructure Solutions Group. I am optimistic for annual growth in the high teens for this group, fueled by AI-related upgrades, a return to growth for traditional servers, and storage demands. I also expect the Client Solutions Group to resume growth (say in the low single digits) as the IT upgrading demands normalize in the next ~2 years.
Other risks and final thoughts
Looking further out, I also share the excitement over the DELL’s AI prospects. Thanks to its reach and scale, I see a multitude of possibilities for the company to benefit from the expansion of AI applications. I foresee these applications necessitate data center modernization and expanding storage needs, all creating opportunities for DELL to provide solutions like hyper-converged infrastructure and software-defined storage. Service and consulting income could be another key growth area. With its vast customer base and in-depth understanding of customer IT needs, DELL could leverage AI to develop innovative products and services, such as AI-powered predictive maintenance for its hardware or AI-driven IT consulting solutions.
In terms of downside risks, DELL and its IT peers all face a set of common risks. These common risks include economic downturns (which can lead to decreased IT spending), intense competition (which often leads to price wars), and supply chain disruptions (which can lead to semiconductor shortages and drive up production costs). Besides these common risks, there are some risks that are more specific to DELL. DELL relies more heavily on a relatively small number of large enterprise customers. Thus, a significant loss of business from these key clients could have a disproportionately negative impact on its revenue. The ongoing inflationary pressure could also increase its input costs and squeeze its profit margins.
All told, I consider the underlying cyclical force to be the dominating force here. Thus, I reiterate my buy rating for Dell Technologies Inc. stock despite the price rallies since my last writing. My assessment is that the stock is currently near a cyclical low and entering the next expansion phase. The assessment is mostly based on its inventory status (the focus of my last article) and its revenue growth drivers (the focus of this article).
Analyst’s Disclosure: I/we have no stock, option or similar derivative position in any of the companies mentioned, and no plans to initiate any such positions within the next 72 hours. I wrote this article myself, and it expresses my own opinions. I am not receiving compensation for it (other than from Seeking Alpha). I have no business relationship with any company whose stock is mentioned in this article.
Seeking Alpha’s Disclosure: Past performance is no guarantee of future results. No recommendation or advice is being given as to whether any investment is suitable for a particular investor. Any views or opinions expressed above may not reflect those of Seeking Alpha as a whole. Seeking Alpha is not a licensed securities dealer, broker or US investment adviser or investment bank. Our analysts are third party authors that include both professional investors and individual investors who may not be licensed or certified by any institute or regulatory body.
Join Envision Early Retirement to navigate such a turbulent market.
- Receive our best ideas, actionable and unambiguous, across multiple assets.
- Access our real-money portfolios, trade alerts, and transparent performance reporting.
- Use our proprietary allocation strategies to isolate and control risks.
We have helped our members beat S&P 500 with LOWER drawdowns despite the extreme volatilities in both the equity AND bond market.
Join for a 100% Risk-Free trial and see if our proven method can help you too. You do not need to pay for the costly lessons from the market itself.


