Summary:
- Despite Dell’s stock price decline since my initial recommendation, the investment thesis remains solid. Its potential upside is driven by an upcycle in PCs, enterprise servers, and AI adoption.
- Its recent report showed sequential growth in AI server orders and shipments, revenue and earnings beating analysts’ expectations, and management raising full-year guidance.
- The company returns substantial value to investors through share buybacks, dividends, and debt reduction.
- DELL’s valuation is reasonable, and I maintain my buy recommendation based on strong fundamentals and growth potential in AI and traditional server markets.
Thinglass
The buy recommendation I gave Dell Technologies (NYSE:DELL) when I last wrote about it on May 27, 2024, has not worked out so far. The stock price is down 31.40% compared to the S&P 500’s (SPX) 6.25%. The market has turned lukewarm on Artificial Intelligence (“AI”) infrastructure stocks over the last several months as investors worry about whether AI-related companies are in a bubble, and the market has not spared Dell from the sell-off.
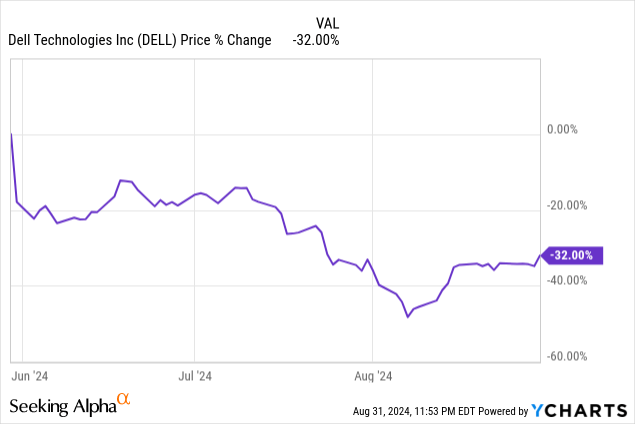
Despite the stock’s decline over the last several months, my thesis for investing in Dell remains solid. I outlined the following thesis in my May 27 article:
First, the company’s most important end markets, PCs [personal computers] and enterprise servers, appear to be at the beginning of an upcycle. Second, the company should be a significant beneficiary of Artificial Intelligence (“AI”) adoption in the enterprise space.
The company recently reported second-quarter fiscal year (“FY”) 2025 earnings on August 29, 2024, which show AI server orders and shipments increasing sequentially, giving the market confidence that AI can become a significant growth driver over the next several years. Management also remains confident that the PC market will rebound in the fourth quarter. Chief Executive Officer (“CEO”) said on the company’s earnings call, “We are optimistic about the coming PC refresh cycle, as the installed base continues to age, Windows 10 reaches end-of-life later next year, and the significant advancements in AI-enabled architectures and applications continue.”
The company also reported revenue and earnings that beat analysts’ expectations. Management also raised full-year FY 2025 guidance. The stock rose 4.3% on August 30, as the results pleased the market. However, the stock is still down substantially from its 52-week high of $179.70 on May 29, 2024. The good news is that the stock sells at a much more reasonable valuation than my initial recommendation.
This article will discuss Dell’s Infrastructure Solutions Group segment and its latest earnings report. It will also examine a few risks, the company’s valuation, and why I maintain my buy recommendation on Dell.
Infrastructure Solutions Group
Dell reports revenue under two segments: Client Solutions Group (“CSG”) and Infrastructure Solutions Group (“ISG”). The CSG segment provides Dell’s consumer and commercial clients with PCs, workstations, tablets, peripherals, software, and services. Currently, CSG is 49.60% of the company’s total revenue, and it is the slower-growing and least profitable segment with an operating margin of 6.2% in the second quarter.
This article will focus on the ISG segment, the fastest-growing and most profitable segment. It contains the rapidly growing AI server products that interest the market the most.
Dell Second Quarter FY 2025 Earnings Release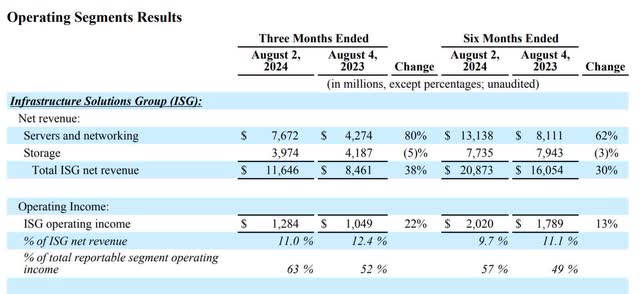
Within ISG, servers and networking grew by 80%, driven by accelerating growth in AI servers. One of the market’s primary worries was that the rapid growth of AI servers would lead to declining operating margins. One of Dell’s main competitors, Super Micro Computer (SMCI), another company rapidly growing its AI server business, reported its earnings on August 6. Although Supermicro grew its revenue by 143.5% year-over-year, mainly due to sales of AI servers, its operating margin declined precipitously from 10.4% in its June 2023 quarter to 6.5% in its June 2024 quarter.
Dell reported Infrastructure Solutions Group’s operating margin rose 300 basis points (“bps”) sequentially to 11%. The best part is that management expects profitability to improve in the second half of FY 2025. Chief Financial Officer (“CFO”) Yvonne McGill said (emphasis added), “Our operating income rate is expected to improve as we continue to drive profitability in ISG.”
In response to an analyst on the earnings call who essentially asked why Dell was able to expand profitability while growing its AI servers business while other AI infrastructure companies struggled to increase operating profitability, CFO McGill gave the following answer: “In AI servers, we had strong shipments with improved profitability and growing enterprise customers in that portfolio mix.” That comment, in plain English, means that the company had robust AI server sales to more enterprise customers, which implies that enterprise customer sales have higher margins than the sales Supermicro makes to its customers. Its second-quarter FY 2025 earnings release states:
Our AI momentum accelerated in Q2, and we’ve seen an increase in the number of enterprise customers buying AI solutions each quarter,” said Jeff Clarke, vice chairman and chief operating officer, Dell Technologies. “AI-optimized server demand was $3.2 billion, up 23% sequentially, and $5.8 billion year to date. Backlog was $3.8 billion, and our pipeline has grown to several multiples of our backlog.”
Generally, Dell sells more to enterprise customers, while Supermicro sells more to cloud companies, specifically one cloud company. In my article on Supermicro on August 19, 2024, I discussed how it had an unnamed cloud company that made up approximately 20% of FY 2024 revenue. I speculated that a high percentage of sales to one company might allow that unnamed cloud company to negotiate for discounts that lower margins. Regardless of whether that speculation is true, Dell’s lower customer concentration among hyperscalers (cloud companies), which may be focused on squeezing its suppliers’ margins, may be an advantage it has over Supermicro.
CFO McGill highlighted a few other reasons that Dell’s ISG margins outperformed. The big one is that it grew ISG revenue by 26% sequentially, which helped spread fixed costs over a larger sales volume and improve profitability across the whole segment.
The ISG segment also includes its storage business. In the company’s first quarter FY 2025 earnings call, the CFO said (emphasis added), “Q1 is seasonally our lowest profitability quarter in ISG, given storage seasonality, and we expect ISG operating margin to improve as the year progresses.” Management projects margin improvement across the second half of FY 2025 as storage becomes a more significant part of the segment’s revenue. The company focuses on maintaining a long-term ISG operating margin of between 11% to 14%. If Dell continues to grow ISG revenue briskly while maintaining the segment’s target operating margin, it will bode well for the company’s stock price in the long term.
Company fundamentals
In the first quarter of FY 2025, management guided analysts to expect second-quarter revenue between $23.5 billion and $24.5 billion, with a midpoint of $24 billion, up 5%. Dell’s actual total consolidated revenue was $25 billion, up 9%. It accomplished this growth despite the headwind caused by the company exiting its VMware resale business due to Broadcom’s (AVGO) acquisition of VMware. This resale business was a significant revenue driver for Dell.
In the second quarter of FY 2025, CSG and ISG combined revenue was $24 billion, up 12%, beating company guidance of 8% at the midpoint. The company includes the combined revenue result because, as the table below shows, it has other revenue that doesn’t belong in either reportable segment, which accounted for $966 million in revenue. One of the “other businesses” likely includes Dell Financial Services (“DFS”) originations, which are new loans, leases, and other financial contracts the company offers to its customers to finance purchases of its equipment.
Dell Second Quarter FY 2025 Earnings Release
Dell’s second quarter FY 2025 gross margin was down 230 basis points (“bps) to 21.2%. The CFO said the gross margin was down “due to an increase in our AI optimized server mix and a more competitive pricing environment.” Since AI servers require expensive specialized components like GPUs (Graphics Processing Units) and advanced networking hardware, gross margins are lower than those of traditional servers. Gross margins may continue to decline as AI servers become a larger part of Dell’s revenue. Additionally, the AI server market is very competitive, and some worry that competition may cause a race to the bottom on prices if companies begin competing on prices to maintain or gain market share.
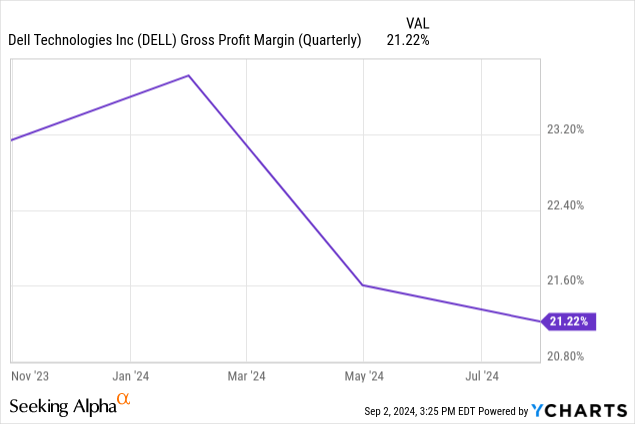
Although gross margins are lower year-over-year, the company maintained operating margins similar to the previous year by lowering the operating expense (“OpEx”) ratio. The company’s second-quarter OpEx declined 6% year over year, beating the company’s guidance for a decline of 3%.
Dell second quarter FY 2025 Performance Review.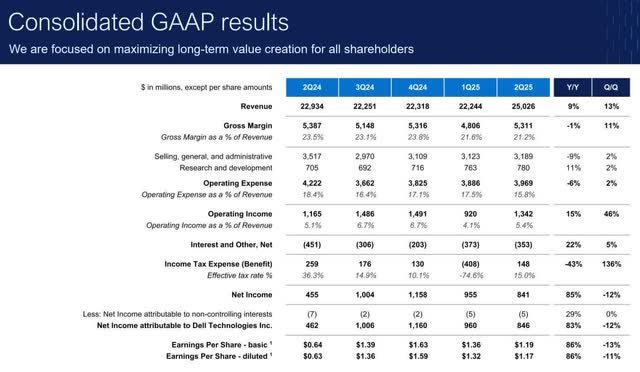
In the second quarter, consolidated GAAP (Generally Accepted Accounting Principles) operating income was up 15% to $1.34 billion, with an operating margin of 5.4%, 30 bps higher year-over-year. Non-GAAP operating income was up 3% year-over-year to $2.03 billion. Non-GAAP operating margin was 8.1%, 50 basis points lower than last year’s second quarter. CFO McGill said on the earnings call, “This [non-GAAP operating income] was driven by higher revenue and lower operating expenses, partially offset by a decline in our gross margin rate.” On the earnings call, management emphasized non-GAAP operating metrics as some companies prefer highlighting operating metrics excluding non-cash expenses, such as stock-based compensation and amortization of intangible assets. Making these exclusions may give investors a more consistent picture of the operating performance without the fluctuations caused by non-cash items.
Second quarter FY 2025 GAAP diluted earnings per share (“EPS”) grew 86% year-over-year to $1.17, beating analysts’ estimates by $0.16.
Dell generated cash flow from operations (“CFO”) to sales of 6.61%, meaning that for every $1 of sales, it generates around $0.07 of cash.
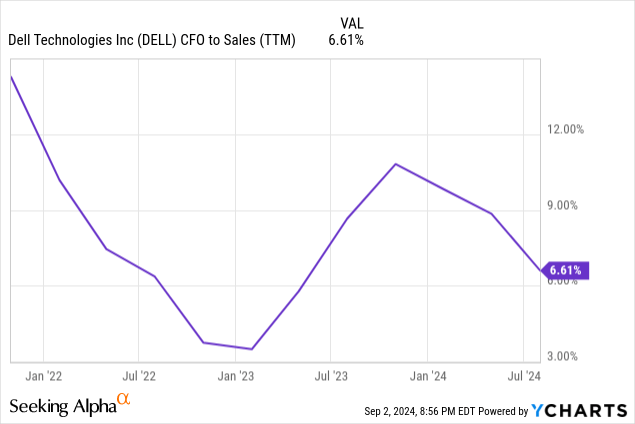
The company generated a CFO of $1.3 billion, down 58% year-over-year. McGill said the following on the earnings call (emphasis added):
[Q2 cash flow from operations] was primarily driven by sequential revenue growth and profitability, offset partially by working capital. Our cash conversion cycle was negative 43 days, up four days sequentially, driven primarily by the increase in our AI server business and AI order linearity.
Management didn’t explicitly state the reason for the year-over-year decline in CFO. However, the above statement implies that Dell increased its inventory to satisfy the demand for AI servers. Building a more extensive inventory could reduce cash flow. Additionally, an increase in accounts receivable could also negatively impact cash flow. The good news is that the company has a negative cash conversion cycle, and its cash conversion cycle increased by four days. This increase means Dell takes an additional four days before it pays its suppliers, which has positive implications for cash flow.
Source: Dell second quarter FY 2025 Performance Review.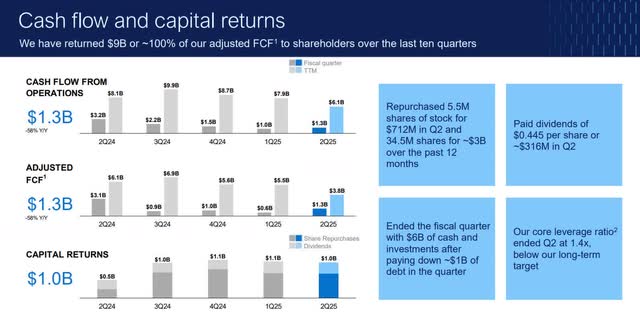
Dell spent $682 million in capital expenditure (“CapEx”) during the second quarter and $2.7 billion in the trailing 12-month (“TTM”) CapEx. It produced $658 million of FCF in the second quarter and $3.36 billion in trailing 12-month free cash flow (“FCF”). The chart above reports adjusted FCF, which adds back financing receivables, a non-cash charge that can distort cash flow. It also adds back equipment under operating leases, making comparing FCF with companies using financing leases easier. Dell’s second quarter FY 2025 adjusted FCF was $1.3 billion, and TTM adjusted FCF was $3.8 billion. Investors should pay close attention to Dell’s FCF because it has implications for valuation, and the more FCF it produces, the more cash it returns to investors in the form of repaying debt, repurchasing stock, and dividends.
The company repurchased $712 million of stock in the second quarter and $3 billion over the TTM period. It paid $316 million in dividends in the second quarter and $1.18 billion over the TTM period. Management announced in the earnings call that it paid $9 billion in combined share repurchases and dividends since the beginning of FY 2023.
At the end of the second quarter, the company had $4.55 billion in cash and equivalents and $17.81 billion in long-term debt. On the earnings call, CFO McGill said Dell had a “net debt paydown of $1 billion during the quarter.” She also said, “With our additional debt reduction and increased profitability this quarter, our core leverage ratio was 1.4x.” The following image shows how the company substantially reduced its core leverage since FY 2020.
Dell Second Quarter FY 2024 Performance Review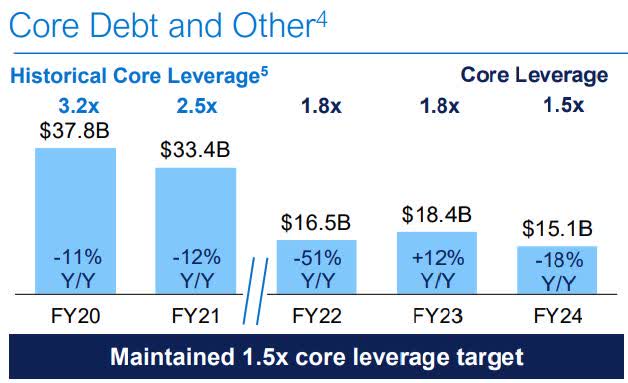
The company changed how it calculated the core leverage ratio from year to year, depending on how it treated VMware’s contribution to EBITDA and how much its DFS unit detracted from EBITDA. The company loosely calculates the core leverage ratio as core debt / (TTM Dell adjusted EBITDA) +/- (VMware EBITDA depending on the year) +/- (DFS adjusted EBITDA depending on the year). The company defines core debt in its second quarter FY 2025 performance review as “core debt + margin loan, mirror note, and other debt, excluding public subsidiary debt and DFS related debt.” Core debt is essentially its long-term debt obligations that management considers essential to its operations and financial stability. It excludes non-recourse debt or debt not essential to primary operations. Dell’s core leverage ratio calculation is similar to a debt-to-EBITDA (Earnings Before Interest, Taxes, Depreciation, and Amortization) ratio. A debt-to-EBITDA ratio below two typically means a company has low financial risk and solid debt-servicing capacity. A ratio of 4.0 or higher may indicate financial distress.
In the second quarter, Dell raised its FY 2025 guidance for the second time since giving its initial guidance for the year in its fourth quarter FY 2024 earnings call. Management initially forecast revenue of $91 billion and $95 billion. At the midpoint, the initial guidance called for annual revenue growth of 5%. In the first quarter of FY 2025, management guided for revenue between $93.5 billion and $97.5 billion. At the midpoint, this guidance would produce 8% growth. Second-quarter guidance for FY 2025 is between $95.5 billion and $98.5 billion. At the midpoint, this updated guidance would produce 10% annual growth. This updated guidance means the company has become increasingly confident in tailwinds from AI infrastructure growth.
Risks
One area this article didn’t discuss much was its CSG segment, which is attached to the mature PC market, a market in its terminal growth stage. Investors should not expect the PC market to return to the heady days of double-digit growth. Statista projects the PC market to grow at a compound annual growth rate (“CAGR”) of 3% between 2024 and 2028. Mordor Intelligence has more optimism. It expects the PC market to grow at a CAGR of 9% between 2024 and 2029. Dell is counting on AI to boost the forecasted PC refresh cycle that should begin next year. However, the PC market is highly competitive, and there is no guarantee that Dell’s AI PC strategy will provide it with much of a boost. Additionally, AI computers are still experimental, and their market could develop more slowly among consumers and businesses than expected. If Dell fails to get much growth out of the CSG segment, it could act like a lead balloon for Dell’s overall business. One reason some investors prefer Supermicro is it lacks a PC business. Therefore, it can grow its overall business much faster than Dell.
Dell’s traditional strength is providing enterprises with servers for on-premises data centers. If you read my Amazon (AMZN) article, I quoted its CEO Andy Jassy, who said, “90% of the global IT spend being on premises, there are a lot of companies who have yet to move to a cloud.” One thesis for AWS revenue growth is that much of that on-premises spending will move to public cloud computing. Suppose that thesis is accurate; it could permanently hurt Dell’s traditional server business. It is counting on enterprises keeping their on-premises data centers for both conventional and AI purposes in a hybrid computing model. If Dell’s thesis fails, its business prospects may be less rosy than current investors expect.
Last, the AI server market is highly competitive and may become a commoditized, low-margin business faster than expected. Dell is counting on a growing demand for professional services to help customers deploy, manage, and optimize their AI infrastructure to counter AI servers becoming a low-margin business. One of the primary reasons Dell partnered with NVIDIA (NVDA) to create the Dell AI Factory is to address the growing need for professional services for AI applications. If demand for professional services does take off, Dell could develop a long tail of recurring revenue streams beyond the initial sale of the AI servers. However, Dell is not the only company considering this idea; professional services may also become highly competitive.
Valuation
Dell’s TTM price-to-earnings ratio is 19.07, vastly exceeding its five-year median of 10.66. Because of this, some may consider the stock overvalued.
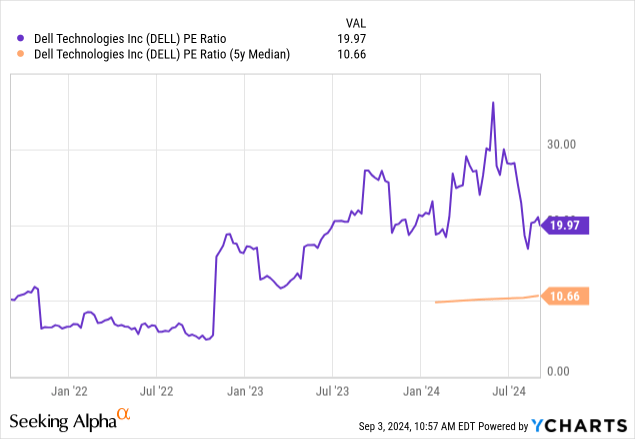
However, TTM valuations are backward-looking. Let’s look at the company’s forward PEG ratio. Dell has a forward Price-Earnings-to-Growth (“PEG”) ratio of 1.45 (forward P/E 14.72 divided by EPS estimated growth rate of 10.10%), which is below the Information Technology (“IT”) sector median of 1.92, suggesting undervaluation compared to the median. Still, the FY 2026 PEG ratio may be a better metric to value Dell since the market expects its ISG and CSG to fully recover and be in full growth mode next year. The company has a one-year forward PEG ratio of 0.64 (one-year forward P/E of 12.33 divided by EPS estimated growth rate of 19.40%). Some value investors consider a forward PEG ratio of 1.0 a sign of a fairly valued stock. Suppose Dell sold at an FY 2026 PEG ratio of one; the stock price would be $181.78, up 57% over the August 30 closing stock price.
The chart below shows Dell’s shareholder yield, a valuation metric that divides the value a company returns to shareholders through debt repayment, dividends, and stock repurchases to its market capitalization. On one hand, Dell’s shareholder yield of 6.87% is relatively high compared to many other companies, especially in the technology sector. A high shareholder yield means a company returns a significant portion of its FCF to shareholders through debt repayment, dividends, and share buybacks, which is attractive. A 6.87% shareholder yield may mean that the market may undervalue Dell’s debt repayment, dividend returns, and share buybacks on an absolute basis.
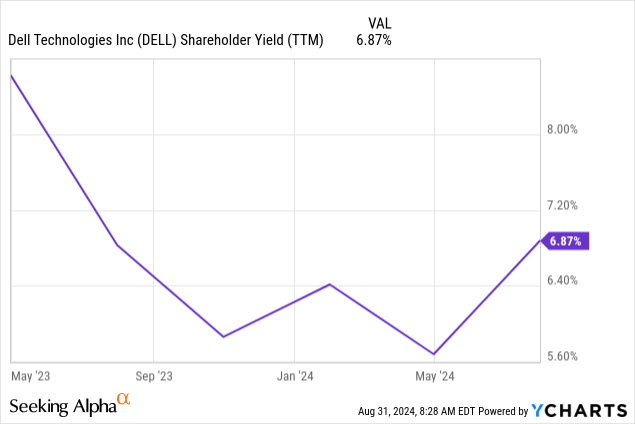
However, people may consider Dell’s shareholder yield fairly valued compared to Hewlett Packard Enterprise’s (HPE) shareholder yield range. HPE’s business is similar to Dell’s, and the market may often value the two companies similarly.
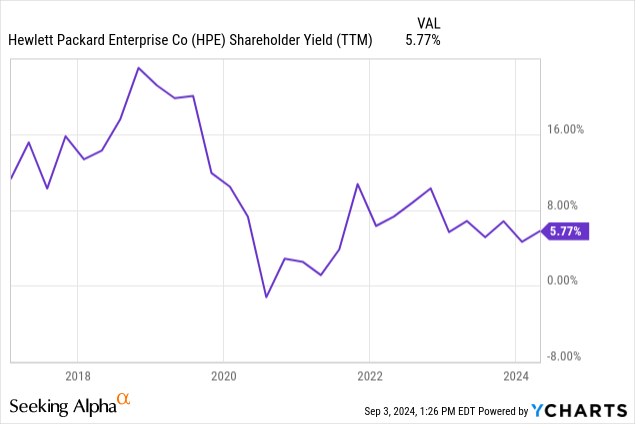
For companies like Dell and HPE, a shareholder yield of 8% and above may be where the market undervalues them and is an ideal buy point. Investors should consider selling both companies when the shareholder yield goes below 4%. Some may consider Dell’s current shareholder yield of 6.87% a sign of a fairly valued stock. In my opinion, the company has a reasonable valuation.
Dell remains a buy
The macroeconomy is still a headwind for Dell’s business until the Federal Reserve lowers interest rates and the possibility of recession recedes. The company’s server and PC business is in the first inning of a rebound from a downturn. AI should provide an extra boost to revenue growth coming out of the 2022-2023 downturn. The market expects Dell’s earnings growth to accelerate in FY 2026. The stock sells at an even better valuation than my initial recommendation. If you are a patient investor looking for solid growth from a company that should benefit from the proliferation of AI, consider investing in the stock. I maintain my buy rating for Dell.
Analyst’s Disclosure: I/we have no stock, option or similar derivative position in any of the companies mentioned, and no plans to initiate any such positions within the next 72 hours. I wrote this article myself, and it expresses my own opinions. I am not receiving compensation for it (other than from Seeking Alpha). I have no business relationship with any company whose stock is mentioned in this article.
Seeking Alpha’s Disclosure: Past performance is no guarantee of future results. No recommendation or advice is being given as to whether any investment is suitable for a particular investor. Any views or opinions expressed above may not reflect those of Seeking Alpha as a whole. Seeking Alpha is not a licensed securities dealer, broker or US investment adviser or investment bank. Our analysts are third party authors that include both professional investors and individual investors who may not be licensed or certified by any institute or regulatory body.

