Summary:
- Devon Energy’s stock underperformed its peers in the oil and gas exploration and production sector through 2023.
- The company has struggled with poor capital efficiency and weaker-than-expected oil production growth.
- However, management is taking steps to improve execution and capital efficiency, and Q4 results suggest those moves are paying off.
- With operational issues in the rearview, investors should refocus on free cash flow and long-term value.
- My discounted cash flow valuation target for the stock is above $60.

grandriver
I last covered Devon Energy (NYSE:DVN) on Seeking Alpha back on June 14, 2023, “Devon Energy: Limited Upside Near-Term,” rating the stock a “Hold.”
In that piece, I used a discounted cash flow (DCF) model to derive a long-term value target of roughly $60 per share for DVN, a little over a 20% premium to the then-current price of the stock. However, given near-term risks and better opportunities in other exploration and production (E&P) stocks at the time, I felt that wasn’t an adequate margin of safety to warrant buying the stock.
I further concluded that dips to around the $40 area in Devon would offer a better buying opportunity.
Per Bloomberg, shares in DVN are down about 5% since publication including dividends, compared to a gain of roughly 15.3% on the same basis in the widely followed SPDR S&P Oil & Gas Exploration & Production ETF (XOP):
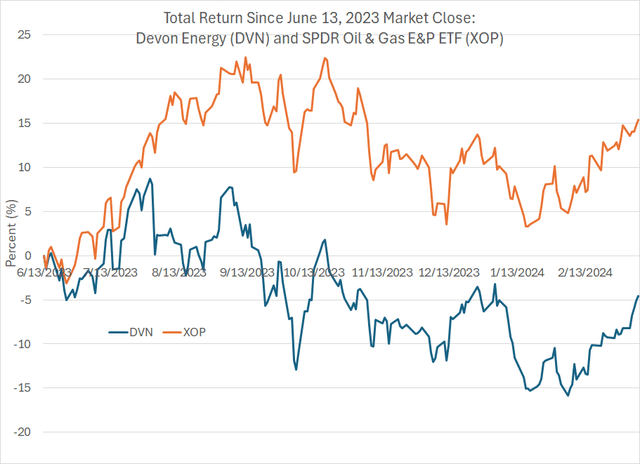
DVN Total Return Compared to XOP (Bloomberg)
In short, while DVN hasn’t fallen a great deal since mid-June last year, it has dramatically underperformed its peers in XOP, an ETF that tracks a basket of more than 50 US-traded oil and gas exploration and production stocks.
While my caution on DVN last summer proved prescient, the outlook has brightened since late last year.
Specifically, as I’ll explain in this article, the main driver of DVN’s underperformance last year was poor capital efficiency relative to management guidance and weaker-than-expected oil production growth. Management is taking steps to correct both issues and the company’s Q4 2023 earnings announcement, including the accompanying release of 2024 guidance, represents a material improvement following a disappointing 2023.
As I’ll explain, based on my updated discounted cash flow valuation for DVN, I see more than 30% of upside from the current quote to my price target over $60.
Evaluating Execution
Exploration and production (E&P) companies like DVN are in the business of producing and selling commodities including crude oil, natural gas, and natural gas liquids (NGLs) like ethane, propane, and butane.
As a result, the most powerful fundamental cash flow and growth driver for an E&P is the level of commodity prices; unfortunately, that’s also a factor largely beyond management’s control. After all, even the largest US-based oil producer, Exxon Mobil (XOM), produced only around 2.1 million barrels of oil per day in 2023, equivalent to just 2% of global oil demand.
However, all E&Ps are dealt roughly the same hand when it comes to commodity prices in a particular region. It’s management execution that often separates the relative winners from the losers in the group.
One of the simplest and most straightforward quantitative metrics I use for evaluating an E&P’s execution is to examine the stock’s performance following its quarterly earnings calls relative to the industry.
Take a look:
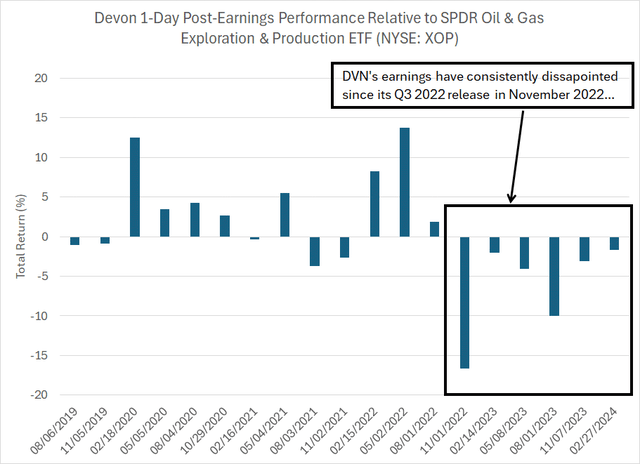
DVN’s Performance After Earnings Releases (Bloomberg)
To create this chart, I examined the performance of DVN shares relative to the XOP in the trading day following its quarterly earnings releases since August 2019. A positive column indicates DVN shares outperformed the industry group; a negative column indicates underperformance.
I examine performance relative to the XOP rather than in absolute terms because it helps filter out the impact of volatility in commodity prices. In other words, if oil and gas prices are weak on the trading day DVN releases results, it’s quite possible the stock would trade lower even if DVN’s earnings impress. The opposite is true if DVN is fortunate enough to report results on a day when oil and natural gas prices pop.
So, comparing DVN’s one-day performance to its peers gives us a cleaner take on investors’ reaction to earnings.
And as you can see, DVN has largely disappointed since late 2022. Indeed, the stock has underperformed the XOP in the trading day following every earnings report from its Q3 2022 release in November 2022 to its Q4 2023 earnings release in late February of this year.
DVN has been consistent, and not in a good way.
And even after a few days to digest results, investors have largely remained underwhelmed with DVN:
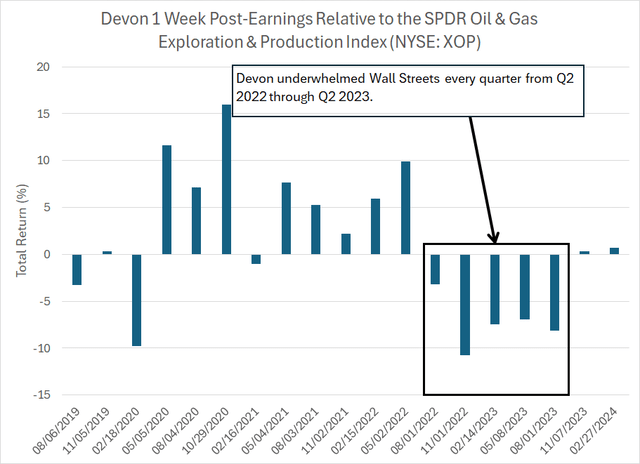
DVN’s 1 Week Performance After Earnings (Bloomberg)
This chart performs the same calculation, except I examined DVN’s relative performance to the XOP in the calendar week (5 trading days) following each of its quarterly earnings calls since the summer of 2019.
The stock significantly underperformed XOP following every quarterly earnings call from Q2 2022 through Q2 2023 inclusive. On average, in the week following these five quarterly earnings releases, DVN underperformed the XOP exchange-traded fund by a whopping 7.3 percentage points.
What makes this pattern worse is that DVN long held a reputation for operational excellence, and the stock consistently outperformed the XOP from 2020 through late 2022:
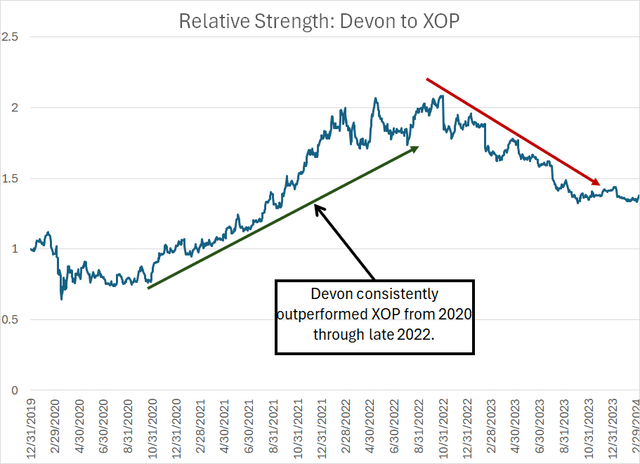
Relative Strength DVN to XOP (Bloomberg)
Often, you’ll see relative strength charts calculated using a simple ratio of the price of two assets – in this case, the price of DVN divided by the price of XOP. When this ratio is rising, it suggests DVN is outperforming XOP and vice versa.
In the energy business, however, such a calculation is largely meaningless because it ignores the large dividends paid by DVN, and many other E&Ps. Per Bloomberg, DVN has paid out a total of $2.87 in dividends over the trailing 12 months, with an additional payment of $0.44 due to be paid March 28, 2024. That’s equivalent to a yield of more than 6.2% over the past 12 months alone. That compares to a trailing 12-month yield of about 2.5% for the XOP on the same basis.
So, to create the relative strength chart above, I created total return indices for both XOP and DVN starting at the end of 2019 based on the return holding the stock including both capital appreciation and dividends reinvested.
As you can see, based on this calculation, DVN dramatically outperformed its peers from the summer of 2020 through the end of 2022.
In short, DVN had a history of strong execution and stock outperformance, which rendered last year’s disappointments even more of a shock for investors.
The bright spot in all this is that DVN shares have managed to slightly outperform the XOP in the week following its last two earnings releases. The magnitude of one-day underperformance following its last two quarterly results is also minor compared to the prior 5 quarters. As I’ll explain, that reflects the fact management has communicated a viable path and turnaround strategy to improve the company’s execution and capital efficiency.
Here’s What Went Wrong
Like most E&Ps, DVN generally issues what’s called “soft” guidance for the year ahead around the time of its Q3 earnings call, usually in early November in DVN’s case. Often this is just a general view of capital spending (capex) expectations, drilling activity and production trends.
Management then offers more explicit guidance for the year with its Q4 earnings release, which for DVN happens in February (February 27, 2024 this year).
Then, alongside each quarterly earnings release through the year, DVN offers guidance for the quarter ahead; for example, late last month when DVN released Q4 2023 earnings results, the company provided guidance for both full-year 2024 as well as Q1 2024 production, capital spending and production costs.
So, let’s look at DVN’s guidance and actual results for Q2 2023 — the second quarter of last year — to start:
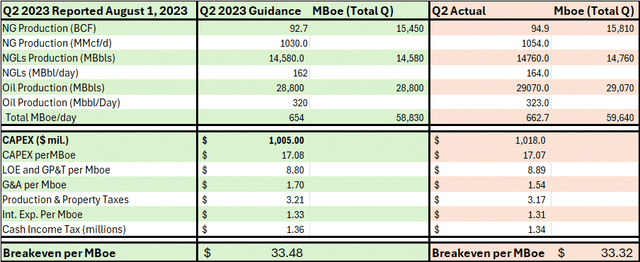
DVN Q2 ’23 Guidance and Results (DVN Energy Q1 2023 and Q2 2023 Earnings Results)
Consistent with the normal pattern, DVN provided guidance for Q2 2023 results when it reported its Q1 2023 results on May 8, 2023, and then it released its actual Q2 2023 results on August 1, 2023.
The left-hand side of this table, shaded in green, shows the company’s Q2 2023 guidance issued on May 1 and the right-hand side, shaded light red, shows the actual results.
The presentation of the company’s quarterly results is consistent with the basic production and cash flow model I use for analyzing and valuing E&Ps including recent articles here on SA regarding EQT, “EQT: The Low-Cost Gas Producer is a Buy,” and a January piece on Comstock Resources (CRK) “Comstock Resources: Serious Cash Flow, Debt and Dividend Headwinds Loom.”
In short, you can divide this table vertically into two parts.
The top part summarizes DVN’s quarterly oil and gas production. I both report the raw figures as well as converting volumes of natural gas into barrels of oil equivalent (Boe) using the industry standard of 6,000 cubic feet of natural gas (6 million BTUs) per Boe. Also note that per energy industry convention, I’m using the Roman numeral abbreviation “M” to denote 1,000 and “MM” to denote 1 million.
Moving down the table, the second piece summarizes DVN’s cost structure. The biggest line items are capital spending (capex) and Lease Operating Expenses (LOE) including Gathering, Processing and Transport (GP&T).
CAPEX primarily consists of the costs associated with drilling new wells on existing acreage – most of CAPEX is what’s known as drilling & completion, basically the cost of drilling new wells, fracturing those wells and putting wells into production.
LOE is generally the cost of producing oil and gas from existing wells drilled in prior quarters, while GP&T is the cost of moving oil, gas and natural gas liquids (NGLs) from the wellhead to market.
I’ve expressed these and other basic costs in terms of dollars per Mboe (1,000 barrels of oil equivalent) produced in the quarter. The bottom row of the table shows the sum of all of the costs on a $/Mboe basis. I call this the “Breakeven” because it’s the price of a barrel of oil equivalent DVN needs to cover all of its costs and generate free cash flow – if the value of a Mboe DVN produces is above the breakeven, DVN is free cash flow positive. If prices are below that breakeven level, the company might need to borrow money to fund its basic expenses.
At first blush, DVN’s Q2 actual results look decent. After all, look at the right-hand side of the table, and you’ll see DVN produced 662.7 Mboe per day in Q2 2023, which was above the midpoint of management’s guidance of 654 Mboe/day listed on the left-hand side of the table.
Looking at the cost section of the table, you’ll see CAPEX excluding acquisitions (this is the basis of DVN’s CAPEX guidance) was $1.018 billion in Q2 2023, which is a bit higher than the $1.005 billion midpoint of management’s guidance. However, since DVN’s production was a bit above guidance and some of its other cost line items like general and administrative expenses (G&A) were a bit lower than expected, the company’s free cash flow breakeven came in at $33.32/Boe compared to the $33.48 implied at the midpoint of guidance.
However, when looking at E&P results it’s very important to consider not only the total production level, but the mix of production. After all, a barrel of oil equivalent is not the same as a barrel of oil.
Look at the table above, and you’ll see that DVN reported actual Q2 2023 total gas production of 15,810 Mboe, natural gas liquids (NGLs) production of 14,760 Mboe and oil production of 29,070 Mboe. That means a barrel of oil equivalent production for DVN in Q2 was actually 26.5% natural gas, 24.8% NGLs and 48.7% crude oil.
And, according to the company’s Q2 2023 earnings results, the company sold its oil for $71.74/bbl compared to $17.79/bbl for NGLs and just $1.66/MMBtu for natural gas (equivalent to less than $10/Boe using the 6-to-1 conversion ratio).
Bottom line, the company spent more capital than management had guided for — $1.018 billion versus $1.005 billion guidance – and produced more than expected, but that output growth was more gas-focused than expected. Natural gas production was 2.33% above the mid-point of guidance in Q2, compared with crude oil output just 1% above the same midpoint.
Granted, these results aren’t terrible, but what really spooked Wall Street last August when DVN reported Q2 results, sending the stock down 7.34% in the trading day following the results, was management’s guidance for the quarter ahead:
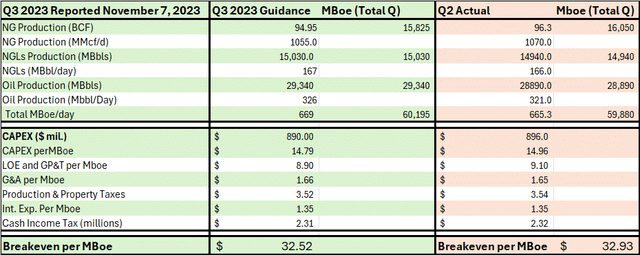
DVN Q3 ’23 Guidance and Results (DVN Q2 and Q3 2023 Earnings Calls)
Compare the Q3 2024 guidance in the left-hand (green-shaded) portion of my table above to the Q2 2023 actual results I outlined earlier.
As you can see, management did guide down Q3 CAPEX to $890 million compared to Q2 2023 at $1.018 billion, which is a positive on the cost line. However, the production guidance for Q3 was weak – management saw total production in Q3 2023 at 669 Mboe/day compared to just shy of 663 Mboe/day in Q2, total production growth of a little under 1% with oil production expected to rise to just 326,000 bbl/day compared to 323,000 bbl/day in Q2, an increase of a bit under 1%.
And, look at the right-hand side of my chart above and, once again, you see that when DVN reported actual Q3 results on November 7, 2023 the company’s oil production actually came in below the mid-point of management’s guidance at 321,000 bbl/day. That’s despite the fact DVN’s CAPEX also missed, running somewhat above the mid-point of guidance.
One more point about this period.
In August 2023, at the time of management’s Q2 conference call, CEO Rick Muncrief had this to say about industry costs:
…our business is also beginning to benefit from service cost deflation as contracts are refreshed. This is driven by reduced activity from natural gas-focused companies and private producers over the past few months resulted – resulting in improved availability of services and cost deflation in virtually every category. Although this is a very dynamic environment, we’ve observed the most downward pressure to date in the areas of tubulars, rig rates, fuel and other miscellaneous drilling services that will begin to positively impact our cost structure as we enter the end of this year. We also anticipate price movement with pressure pumping, which is our largest cost category in a very near future.
Source: DVN Q2 2023 Earnings Call Transcript
Simply put, by late summer last year, DVN was already seeing significant cost deflation across in “virtually every category.” The list included the cost of leasing drilling rigs, buying tubulars (pipes and casing), fuel and other services.
Generally, one would expect cost deflation to have a positive impact on DVN’s cash flow generation and free cash flow break evens over time. After all, if the company starts spending less on drilling new wells and, eventually, completions (fracturing), that should reduce CAPEX and boost capital efficiency (CAPEX per Mboe). The decline in other services costs could also potentially impact other cost line items like lease operating expenses (LOE).
However, the company’s full-year 2023 guidance issued in August 2023 was identical to the guidance it issued three months earlier in May. Despite cost deflation, the company maintained the outlook for full-year 2023 CAPEX of $3.7 billion and (slightly) bumped up the mid-point of its full-year LOE and GP&T costs from $8.55/Mboe in May to $8.60/MBoe in August.
These may also seem to be minor misses and guidance adjustments, but the point is that for much of 2023 DVN struggled with capital efficiency, spending more than guidance, and underwhelmed regarding crude oil production growth. Meanwhile, the failure to cut CAPEX expectations in August suggested a lack of confidence in DVN’s ability to keep spending within budget despite apparent industry-wide cost deflation.
The Bakken and Delaware
Throughout 2023, DVN flagged two main issues negatively impacting results.
First, there’s the company’s operations in the Bakken Shale/Williston Basin, centered in the state of North Dakota. In Q3 2023, the Bakken only accounted for about 54 Mboe/day of the company’s total production of 665 Mboe/day, a little over 8% of the total.
However, in the same quarter, DVN saw almost 11% of its 321,000 bbl/day of oil production from the region; the Bakken punches above its weight when it comes to DVN’s oil production.
Unfortunately, DVN’s Bakken production was weak through much of last year, declining from 37,000 bbl/day in Q4 2022 to 35,000 in Q3 2023 before rebounding to 36,000 in Q4 2023, the last quarter for which we have data.
Back in July 2022, DVN completed the acquisition of RimRock Oil & Gas, a private company, for $865 million in cash. This deal added about 38,000 net acres located adjacent to DVN’s existing acreage in the Bakken Shale/Williston Basin region. In total, RimRock Assets were producing around 20,000 Boe/day.
Many of DVN’s production issues in the region stemmed from the RimRock deal, as management explained during its Q3 2023 call back in November:
I think one of the most interesting things we’ve learned with the RimRock acquisition, some of which was a little bit of a surprise, some was not. And that was our spacing RimRock and Devon that had historically somewhat slightly different development schemes, if you will. And I think what we have learned is it really drove home the point that Devon’s approach was probably the right approach as far as density per spacing unit.
We were a little more relaxed. In other words, we had wider spacing and I think that’s why we had better recoveries. But some of those – sometimes those points aren’t really made until you have several years of production history, and I think that’s what we have learned with this.
Source: DVN Energy Q3 Conference Call, November 2023
Simply put, historically RimRock spaced its wells in the region closer together than DVN. As a result, DVN found some of the wells it was drilling in the RimRock acreage saw production issues related to weak subsurface pressures; the end result of this is some RimRock wells underperformed DVN’s expectations.
The Delaware Basin is the western part of the Permian Basin, extending across parts of Texas and New Mexico. It’s far-and-away the single most important operating region for DVN, accounting for just under two-thirds of DVN’s total oil and oil equivalent production in Q4 2023.
In the Q4 2023 conference call referenced above, management indicated DVN experienced some infrastructure headwinds in Delaware last year, primarily in the form of a lack of adequate gas processing (separating NGLs from raw gas) and takeaway (pipeline) capacity. That forced DVN to divert some of its planned activity away from its more productive and efficient core acreage in the Delaware.
The company explained on its Q3 Call:
…as [CEO] Rick [Muncrief] touched on earlier, we’re excited about the plan we have in place to drive improved well productivity in the Delaware with our 2024 plan. With the ongoing industry build-out of infrastructure in the form of electrification, compression, localized processing and downstream takeaway, we plan to allocate approximately 70% of our capital to the Delaware Basin and specifically to the core of New Mexico, while we can optimize the remaining activity across our acreage in Texas.
As you can see on the chart on the left, by refining our focus on high-impact Wolfcamp zones in the core of the play with less appraisal requirements, we expect Delaware productivity to improve by 10% in 2024.
Looking beyond 2024, we have a long runway of high value inventory in the Delaware that positions Devon to deliver highly competitive results for the foreseeable future. As we’ve discussed in the past, we’ve identified more than a decade of risked inventory across the Delaware and we expect to steadily replenish this inventory over time as we successfully characterized the many upside opportunities across this back play resource.
Source: Q3 2023 Conference Call Transcript November 2023
In short, these infrastructure issues are easing and DVN believes it’s in a position to shift activity in the Delaware away from its acreage in Texas to its core position in New Mexico, where DVN’s acreage is the most capital efficient (low-cost) and productive.
That quote offers a good segue to this:
The 2024 Capital Reset
The most important positive change for DVN last came about when it released its “soft” guidance for 2024 at the time of its Q3 2023 conference call.
Specifically, in the company’s Q3 presentation slide deck, management outlined their 2024 guidance in broad strokes, for total CAPEX of $3.3 to $3.6 billion (a midpoint of $3.45 billion) which, is less than the roughly $3.85 billion the company spent in 2023. Management also guided to 2024 total volume of 650,000 Mboe/day of which roughly 315,000 was expected to be crude oil; this compared to Q3 2023 production of 663,000 Mboe/day and oil production of 317,000 bb/day as I outlined earlier.
In short, DVN’s first look at 2024 guidance showed a small decline in expected 2024 oil-equivalent production with one major offset – a significant decline in expected capital spending for the year from $3.85 billion in 2023 to $3.45 billion in 2024.
Amid concerns about DVN’s capital efficiency throughout 2023, Wall Street was a bit skeptical of DVN’s guidance for a step-change in 2024 capital efficiency, so the stock performed more or less in line with its peer group in the week following its Q3 2024 results.
The good news is that when the company released more detailed guidance for 2024 at the end of February, management reaffirmed its sanguine outlook for this year:
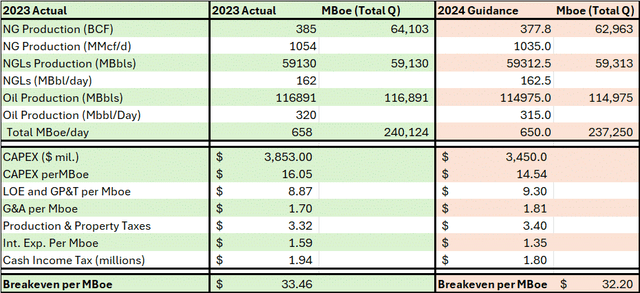
DVN 2023 Results and 2024 Guidance (DVN Q4 Results and 2024 Guidance)
This table shows the company’s actual results for full year 2023 as well as the detailed guidance on costs and production for 2024.
As you can see, the company is guiding to overall production of 650 Mboe/day in 2024, down only slightly from 658 Mboe/day in 2023; however, the decline in total CAPEX is around $400 million at the mid-point of guidance. The most important row of all on this table is the CAPEX per Mboe line item – in 2023 the company’s total CAPEX/Mboe excluding acquisitions was over $16, falling to around $14.50/Mboe in 2024, a roughly 10% increase in capital efficiency and a step-change from the pattern we saw throughout 2023 as I explained earlier.
This improvement is credible because management is addressing the two main issues from last year, weak well performance in the Bakken and the infrastructure constraints that plagued the Delaware Basin assets.
I already outlined the shift management plans in the Delaware, shifting more of its capital spending and drilling activity in favor of its most profitable core acreage in New Mexico. Regarding the Bakken, management decided to cut back on its planned drilling activity in 2024. As Chief Operating Officer Clay Gaspar put it:
…in pulling back the activity, for example, in the Williston Basin, that prolongs that basin’s opportunity to continue to deliver free cash flow and offset some of that fall in production with some really healthy wells. What we found is we were pushing a little too quickly, a little too much capital to that asset by having the multiple basins that we do, having our franchise asset in the Delaware Basin. It allows us to take a little bit of pressure off that team, allows them to really make sure that all the ducks are in a row ready for that next pad. And then selectively, we’re going to fund those.
Source: Q4 2023 Conference Call February 2024
In short, the company is pulling back its spending and will focus activity off what it calls “high confidence” wells with a high oil cut – these are wells in regions that produce above-average oil cuts (oil production as a percentage of total production in Mboe terms).
Also note that by guiding to flat overall 2024 production and a decline in oil output, DVN has reset the bar of expectations lower, which makes it easier for management to beat their guidance.
During the Q&A portion of the Q4 conference call, an exchange between DVN’s CEO and an analyst was instructive:
Analyst Question: Rick, I know over the last year, you’ve talked about some of your frustration around execution on the oil volume side, that is going to be an important year for that operational inflection. It does seem like we’re seeing some evidence of that with capital efficiency and holding the 315 oil guide so. Maybe you could just give us your perspective on whether we’re at that inflection point from an ops perspective?
CEO Rick Muncrief: That’s a good question. We have expressed our frustration, I think, in the market really – we really traded down on some of our variances we saw last year in our production volumes. But even though they were minor from a volumetric standpoint, they weren’t from a stock performance standpoint. So I think the setup is really good for investors as we look forward. So it is going to be, I believe, point of inflection for us as we’ve mentioned. Really bullish about our performance, the team has done a wonderful job, getting us through some tough weather. We’ve seen some increased productivity. I think Clay went through the assets really well, and we’re seeing nice growth on the oil side coming out of this first quarter as we enter second, third, fourth quarters of this year. And I’ll also say, Neil, I feel really good about the next several years on our ability to keep our crude volumes where they’re at. I think that it’s – we’re still early. We still are not getting what I think is a strong, strong signal for demand. But when that call comes, I think we’ll be ready to step up for it. But we really feel good about the trends we’re seeing.
Source: DVN Q4 Conference Call February 2024
As I explained earlier, DVN didn’t miss expectations or management’s guidance on oil production by a large margin in any quarter of 2023. However, the minor misses on oil volumes, coupled with small CAPEX outspend, were enough to drive serious stock underperformance both in absolute terms and relative to DVN’s peers.
However, DVN’s CEO described early 2024 as an operations inflection point for the company. In my view, that’s a further sign of confidence in DVN’s ability to meet or exceed the company’s guidance for 2024 production and costs.
And with DVN likely performing better from an operational and capital efficiency standpoint this year, the stock looks undervalued from a discounted cash flow perspective:
The Free Cash Flow Model
I’ve written several articles here on SA about US-based E&Ps including the aforementioned bullish piece on EQT, a bearish piece on Comstock Resources in January and bullish articles on Southwestern Energy (SWN) and Range Resources (RRC) last year.
My approach to valuing these stocks is straightforward. First I create a model of free cash flow based on a particular producer’s guidance on production, commodity price hedges, costs, and capital spending. I then estimate commodity prices using futures prices and conservative longer-term assumptions.
Finally, I use this model and commodity price assumptions to estimate E&P’s potential to generate free cash flow in coming years and discount those future cash flows to derive a valuation target.
In this case, here’s a look at my full 2024 cash flow model for DVN based on management’s guidance for 2024:
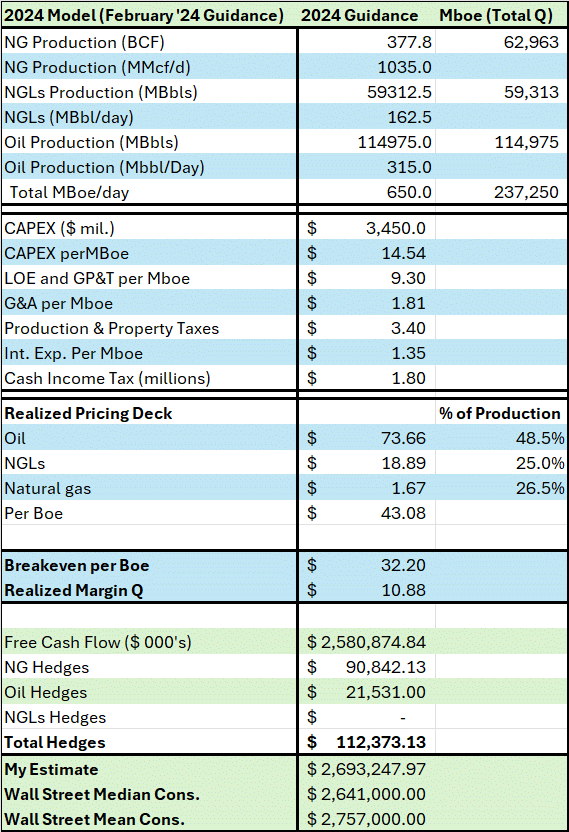
Free Cash Flow Model for DVN (DVN Q4 Earnings Results and Guidance, Bloomberg)
Much of this table should look familiar, as I already presented the production and cost estimates for 2024 earlier on in this article and covered some of the more important line items.
The section labeled “Realized Pricing Deck” and the rows below that line are what I’ve added to create a cash flow model.
Let me explain.
To estimate the price of crude oil in 2024, I simply looked at the average price of West Texas Intermediate (WTI) oil prices in the first two months of 2024 and through the first few days of March 2024. I then used the current futures prices of oil for delivery in every month of the year from April 2024 through December 2024.
The average price of WTI in 2024 on this basis is $75.55/bbl, and management’s guidance is that DVN’s realized prices from selling oil before hedges will be 95% to 100% of the price of WTI. Using the midpoint of that range (97.50% of WTI) yields an estimated realized price for DVN of $73.66/bbl, which appears in the table above.
For NGLs like ethane, propane, and butane, DVN’s guidance is for the company to earn between 20% and 30% of WTI for a barrel of NGLs. I used the midpoint – 25% of a barrel of WTI – and my previously estimated WTI price of $75.55 to derive a projected realized price of $18.89 for a barrel of NGLs.
Finally, there’s natural gas. Just as with oil, I used the actual average price of NYMEX natural gas futures so far this year, along with the price of gas for delivery in every month of the year from April through December 2024. That yields a 2024 estimate of $2.39/MMBtu (by convention equivalent to $2.39 per thousand cubic feet); DVN estimates its actual price for selling gas this year will be between 65% and 75% of the NYMEX benchmark. So, I’m using a 2024 realized price of $1.67/MMBtu (70% of $2.39/MMBtu).
Again, all these realized prices are before hedging, we’ll deal with the hedges in just a moment as a separate line item in the model.
To create a realized price estimate per barrel of oil equivalent (BOE), I simply multiply the per barrel price of each commodity by management’s guidance for share of total production. In this case, management estimates about 48.5% of 2024 production on a Boe basis will be oil, 25% NGLs and the remainder natural gas. The price of natural gas is converted to a Boe basis using a 6-to-1 conversion ratio, which is the industry convention.
Earlier on we calculated DVN’s 2024 cash flow breakeven at $32.20/Boe (those calculations also appear in the table above) and the estimated price realizations for DVN this year come to $43.08/boe. That means, based on these assumptions, DVN should generate around $10.88 in free cash flow for every barrel of oil equivalent it produces this year.
Multiplying that margin by management’s guidance for total 2024 production of 237.25 million barrels of oil equivalent, yields a pre-hedge free cash flow estimate of $2.58 billion in 2024.
And that brings me to the company’s hedges laid out in the same 2024 guidance presentation issued at the end of February. DVN has hedges in place for both oil and natural gas in the form of fixed price swaps as well as put options (part of an options collar hedge).
Here’s a table summarizing the swaps and options hedges DVN has in place for 2024 and their projected value based on the NYMEX WTI and Henry Hub Natural Gas futures prices I estimated earlier:

DVN Hedges for 2024 (DVN Energy Q4 Earnings Presentation)
For example, look at the company’s natural gas swaps hedges for Q2 2024 in the lower right-hand quadrant of my table, sourced directly from the company’s Q4 guidance table. The company has hedged 211,000 MMBtu/day of natural gas, equivalent to 211,000 mcf/day. Multiply by 90 days in the quarter and DVN has hedged just under 19 bcf for the quarter at a price of $3.29/mcf.
Per Bloomberg, the calendar strip price for Q2 2024 – the average price of natural gas futures for delivery in the months of April, May, and June 2024 – is just $1.94/mcf, so I calculate these hedges to be worth more than $25.6 million in Q2 2024 alone.
In total, DVN’s oil and natural gas hedges for 2024 are worth $112.4 million, so I simply add that to my unhedged free cash flow estimate of $2.58 billion to derive an all-in 2024 free cash flow estimate of just under $2.7 billion. Per Bloomberg, the Wall Street median consensus for 2024 free cash flow is $2.641 billion and the mean is $2.757 billion, so my estimate is right in the middle of the consensus.
I also took these same estimates, maintaining all costs and production estimates in line with DVN’s 2024 guidance, and ran the model using different commodity price assumptions.
Specifically, using a WTI price assumption of $80/bbl – equivalent to $20/bbl for NGLs with a barrel of NGLs at 25% of WTI — and $3.50/MMBtu natural gas yields an annual free cash flow of $3.44 billion while $85 WTI and $4/MMBtu natural gas yields a free cash flow estimate of $4.06 billion.
Valuation Target and Risks
Let’s use these free cash flow estimates to derive a valuation target for DVN, starting with this:

DCF Perpetuity Price Target for DVN (Bloomberg, Author’s Estimates)
To create this table, I’m using a discount rate of 8.6%. That’s based on a Bloomberg estimate of DVN’s weighted average cost of capital (WACC) that’s derived from the company’s actual cost of debt and an estimated cost of equity based on DVN’s volatility relative to the S&P 500.
I’m using the actual free cash flow estimate for DVN derived earlier of $2,693 million in 2024. The 2025 estimate is based on $80/bbl West Texas Intermediate oil prices and $3.50/MMBtu natural gas. Free cash flow estimates for 2026 and beyond are based on $85/bbl West Texas Intermediate and $4/MMBtu natural gas prices.
These assumptions yield a DCF cash flow target for DVN at $60.69, which represents a premium of more than 30% to the current stock price.
An alternative means of deriving a valuation target using free cash flow estimates is to calculate the present value of free cash flows over the next 5 years, followed by a terminal value for the stock based on a multiple of future cash flow. Here’s my estimate based on that technique:

DCF Cash Flow Target Using Terminal Multiple (Bloomberg, Author’s Estimates)
Per Bloomberg, DVN’s current enterprise value – Market capitalization and net debt – is around $35.1 billion and my 2024 free cash flow estimate is $2.693 billion, so DVN trades at roughly 13 times 2024 free cash flow. Applying the same 13 times multiple to my projected terminal free cash flow estimate of $4 billion annualized yields a terminal value for the stock of $52 billion (Enterprise Value).
I’m using the same 8.6% WACC to discount cash flows, yielding a valuation of $66.18 for DVN, close to 45% above the current quote.
Generally, for E&Ps like DVN I prefer the first, more conservative valuation technique and that’s the target I’ve adopted for DVN in this article. The energy sector is out-of-favor with investors right now, and commodity prices – especially the front-month futures price of natural gas – are low compared to their 2022 peaks. However, the second, more aggressive valuation technique gives an idea of the potential upside for DVN in a market environment where energy stocks are more in favor.
Of course, there are myriad risks, and any effort to model free cash flow years into the future is fraught with uncertainty and error. The biggest risk, as always, in the energy industry is commodity prices.
Currently, of course, the price of front-month natural gas futures is under $2/MMBtu, a far cry from the $3.50/MMBtu that underpins my valuation for 2025 and $4.00 in 2025. However, as I’ve explained in several recent articles on Seeking Alpha, including this one on the UNG ETF, the front-month price of natural gas doesn’t reflect the longer-term market outlook for the commodity.
Indeed, per Bloomberg, the average price of gas for delivery in every month of 2025 is $3.45/MMBtu and in 2026 it’s $3.77/MMBtu, so my estimates aren’t far above the status quo.
For WTI crude oil, the single most important commodity for DVN, I’m using an average price of $80/bbl in 2025 and $85/bbl for 2026 and thereafter. Per Bloomberg, the average weekly close for WTI futures since the end of 2021 – a period of more than 3 years – is $85.21/bbl. Late last year, the International Monetary Fund (IMF) estimated that Saudi Arabia – OPEC’s largest exporter – needs $85.80/bbl Brent oil prices to balance the government’s budget over the long haul.
Thus, I believe a long-term oil price assumption in the range of $80 to $85/bbl range is logical, if not a little conservative.
I’ve also baked additional conservative assumptions into my model. For example, I’m assuming DVN’s production is flat at the 2024 guidance level over the long-haul, but that’s unrealistic. After all, DVN’s 2024 guidance assumes a (slight) drop in total output this year.
During the company’s Q4 call last month, referenced earlier, management indicated that should oil and gas prices rise, and the supply/demand balance tighten appreciably, DVN would be in a position to resume production growth to take advantage of improving prices. Higher production would tend to boost cash flows and my free cash flow estimates.
One idiosyncratic risk DVN faces is continued poor execution – missing management guidance – in 2024 similar to what happened last year. In this article, I explained at some length why I think the company’s recent earnings release suggests DVN has its erstwhile operational problems under control and, over the long-haul, DVN has been a well-run company known for meeting its guidance. However, further operational misses could shake investor confidence and act as a headwind for the stock.
Bottom line: With operational execution issues fading, investors can focus on long-term value in DVN’s ability to generate free cash flow. Based on my conservative commodity price assumptions, the stock is worth more than $60 per share, about 30% higher than where it’s trading right now.
Analyst’s Disclosure: I/we have no stock, option or similar derivative position in any of the companies mentioned, but may initiate a beneficial Long position through a purchase of the stock, or the purchase of call options or similar derivatives in DVN over the next 72 hours. I wrote this article myself, and it expresses my own opinions. I am not receiving compensation for it (other than from Seeking Alpha). I have no business relationship with any company whose stock is mentioned in this article.
Seeking Alpha’s Disclosure: Past performance is no guarantee of future results. No recommendation or advice is being given as to whether any investment is suitable for a particular investor. Any views or opinions expressed above may not reflect those of Seeking Alpha as a whole. Seeking Alpha is not a licensed securities dealer, broker or US investment adviser or investment bank. Our analysts are third party authors that include both professional investors and individual investors who may not be licensed or certified by any institute or regulatory body.
