Summary:
- While sentiment remains low, the underlying business model remains strong with continued consumer engagement in parks, streaming services, and sports.
- Diversified streaming offerings across Disney+, Hulu, and ESPN create the optimal streaming package and allow for a strong competitive advantage.
- Management’s large-scale investment across the Experiences segment illustrates confidence in both growth and stability.
- Current pricing infers a positive risk-to-reward ratio and significant margin of safety. Even assuming certain negative scenarios still provide potential upside.
ZargonDesign/E+ via Getty Images
Introduction
Disney (NYSE:DIS) sentiment is arguably at an all-time low, with many long-term investors losing faith in the company. This is attributable to issues across management, activist investors, consumer weakness, linear television decline, and much more. The problem is, I have failed to see anything substantially affect the underlying business model. Consumers continue to visit Disney parks, continue subscribing to both Hulu and Disney+, and continue using the ESPN platform.
Through my in-depth research on the company, I believe the core business remains strong. The only thing affecting the stock price is short-term noise and long-term probability. The current price of $101 per share infers a combination of linear television losses declining faster than streaming gains, parks facing potential flat growth, and intellectual property providing no foundational stability to the overall firm. The probability of this all happening is clearly low. Because of these inherently low expectations, Disney is positioned to outperform over the next three years, with numerous catalysts in sight. My price target for Disney is $138, based on 2026 operating Income of $19,057 million and a 15x multiple.
In this article, I will provide a brief synopsis of Disney’s current business model and financials. Next, I will examine how current market expectations imply a low probability of success, disregarding clear evidence of long-term cash flow generation across streaming and parks. Then, I will touch on potential catalysts that will drive this outperformance and conclude by illustrating my valuation methodology alongside potential risks.
Business Model
Disney now operates through three main segments. Entertainment, which focuses on non-sports television, streaming (direct-to-consumer), and film; Sports, primarily including ESPN; and Experiences, encompassing theme parks, resorts, and cruises. This segmental breakdown was recently shifted to include ESPN (Sports) in its own category, which illustrates management’s confidence in the space. Furthermore, Entertainment continues to thrive with the combination of Disney+ and Hulu creating the staple streaming service for consumers. Then on the Experiences side, while management has guided towards slower growth, it still provides strong operating income for the entire business. Additionally, this segmental shift has made it challenging to compare Disney’s financials overtime. Certain financial data and reporting metrics have been continuously changing, which I believe creates further difficulties in valuing this firm.
Financial Breakdown
From a financial standpoint, Disney remains surprisingly strong despite the negative sentiment surrounding it. During their recent Q2 2024 earnings conference call, they announced the first-ever quarter of DTC (streaming) profitability, its first buyback in six years, and that it’s now on track to generate over eight billion in free cash flow for 2024. Over the last three years they have also seen robust financial improvement despite the FED’s rate hiking cycle which has negatively influenced consumer spending habits. Experiences, mostly including parks, has regrown its operating margin to 28% in 2023, almost 3% higher than in 2019. Moreover, the Entertainment segment has grown at a CAGR of 5.5% from 2021 to 2023 despite the decline of linear television. Below, you can see the segmental breakdown by operating income and cash flow provided by operations.
2023 Segmental Breakdown (Excel)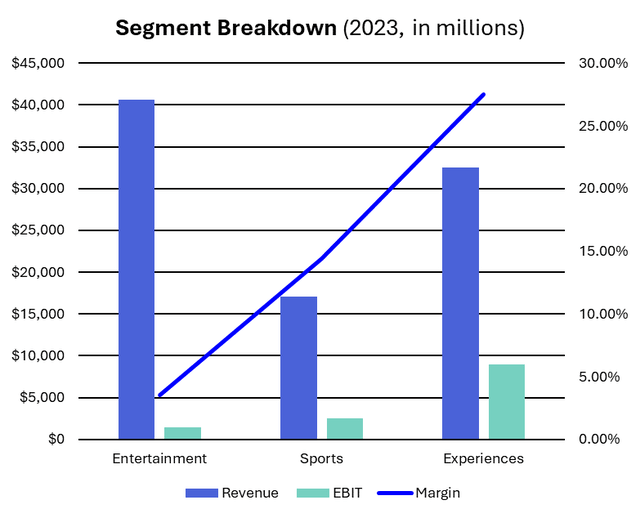
Annual Cash Provided by Operations (Excel)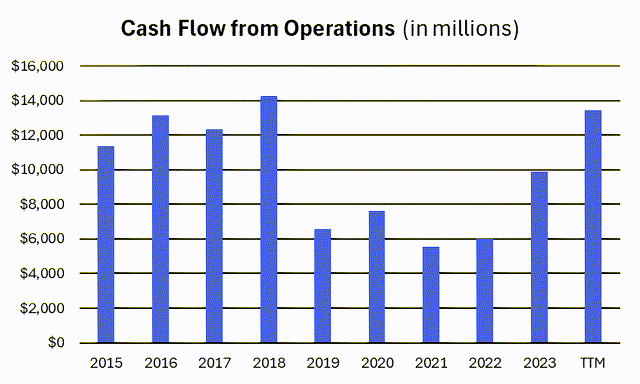
The Streaming Shift
In November 2019, Disney announced its release of Disney+. The launch was an unexpected success, reaching over 100 million subscribers by 2Q21. This can be tracked right next to the stock price in early 2021, but despite the success, growth began to slow. Since then, the stock retreated to $80 in 2023 and saw a resurgence early this year. More recently, even with Disney’s first quarter of DTC profitability, the price still fell on guidance of a Q3 DTC loss and flat subscriber growth. This illustrates the street heavily weighing DTC on short-term guidance. From a long-term perspective, Disney has now shown the capability of DTC profitability, and still continues to grow faster in revenue and operating income than Linear Networks has lost. Moreover, both Disney+ and Hulu continue to gain subscribers which will be supported by future password sharing initiatives. You can see the DTC vs. Linear shift below.
Quarterly DTC & Linear Revenue (Excel)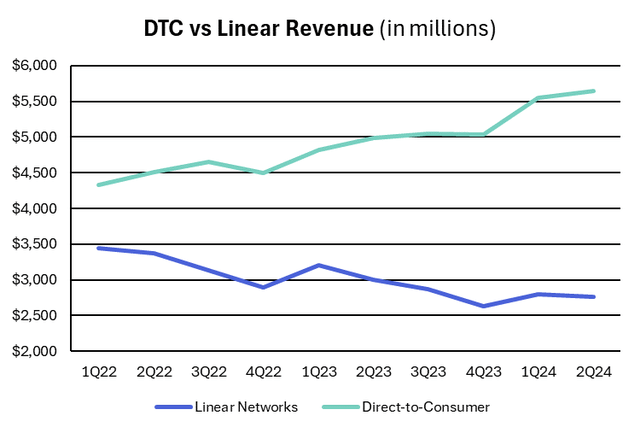
Quarterly DTC & Linear Operating Income (less 21CF & Hulu Amortization) (Excel)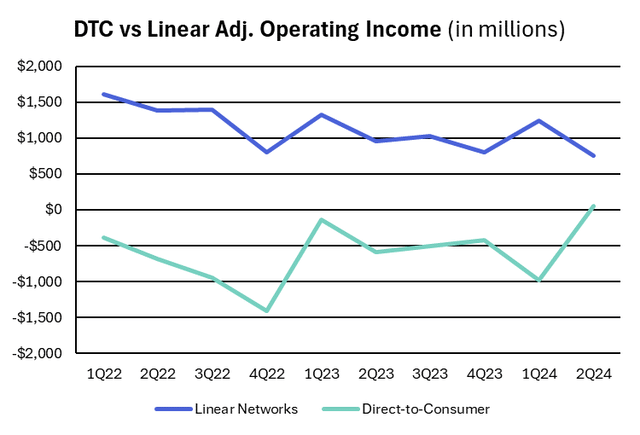
I’ve also provided both the subscriber count and ARPU for both Disney+ and Hulu, which make up DTC (less distribution). Disney’s metrics are located on the left side of the graph with Hulu on the right side. You can see despite the Disney+ cricket rights issues in early ’23, they still had subscriber growth of 18% since Q1 2022, with Hulu at 11%. From an ARPU perspective, Hulu has remained relatively flat, with this number encompassing both the SVOD (streaming only) package at $11.84, and Live TV + SVOD package at $95.01. Subscriber wise, the SVOD (only) package accounts for 45.8 million of the total 50.3 million subscribers.
Disney, on the other hand, has seen strong growth in ARPU, with the consolidated number growing from $4.41 to $5.65 since Q1 2022. This is substantial considering they have over 150 million subscribers. For comparison, Netflix (NFLX) has a global ARPU of $11.92 with 285 million total subscribers. This is a great benchmark highlighting the potential revenue Disney+ could provide in the long term. (ARPU stands for average revenue per user, and is calculated on a monthly basis)
Quarterly Disney+ and Hulu Subscriber Count (Excel)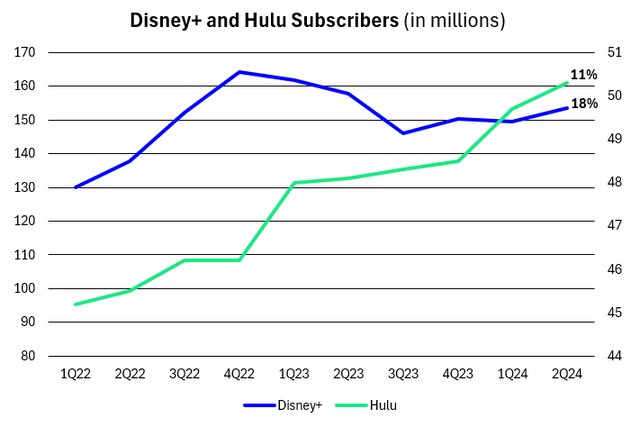
Quarterly Disney+ and Hulu ARPU (Excel)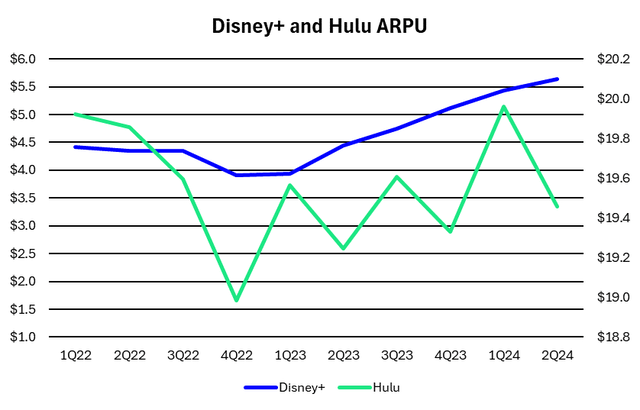
Finally, considering that DTC is attributable to 25% of firm-wide revenue and is one of the main value drivers, I built out a historical implied revenue build. Below, you can see the consistent growth in sales for both Hulu and Disney+. Firstly, I don’t see this growth stopping any time soon, Disney+ is currently the number two or number three largest streaming service globally, depending on how you count Amazon Prime (AMZN), and Hulu is number eight. Secondly, Disney+ was only launched in 2019, while Netflix was launched in 2007, demonstrating further growth opportunities for Disney+. Finally, it’s clear to see DTC revenue growth increasing, while the negative growth of Linear Networks is slowing. More importantly, this does not include ESPN, which is arguably the strongest reason to keep Linear options. This suggests that cord-cutting may occur much slower than originally anticipated, allowing plenty of time for DTC to surpass and absorb future Linear losses.
The analysis below is implied because subscribers may cancel streaming plans at any time, though this deviation is quite small compared to reported numbers. The revenue calculation uses the previous two quarters’ subscriber count average, multiplied by the ARPU, and then multiplied by three (12 months in a year/4 quarters). Next, I examine the share of total firm revenue for both DTC and Linear. From a quarterly change basis, the linear growth seems to be slowing at -1.23% compared to DTC growth of +2.36% in the most recent quarter.
Entertainment Segment Analysis (Excel Calculation)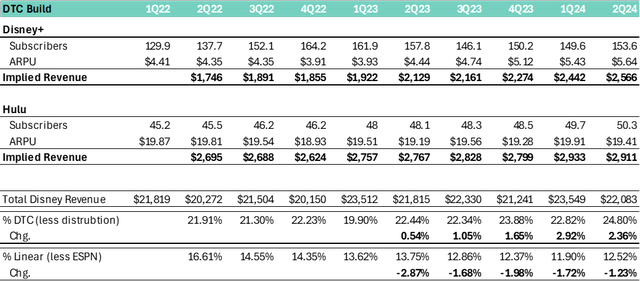
Theme Park Leadership
Although DTC streaming metrics remain key performance drivers for the company’s stock performance, the Experiences segment accounts for around 38% of consolidated revenue and 70% of operating income. Over time, investors expect this number to fall as DTC becomes profitable and ESPN releases its full streaming service. The first clear point is Disney’s dominance in the theme park industry, with a stake in eight out of the ten largest theme parks in the world. Moreover, its underlying brand name allows it to integrate household names into all of its parks, attracting an even wider range of audiences. In short, Disney parks continue to innovate, introducing new attractions and improving guest experiences, which has driven both growth and attendance. Below, you can see a financial breakdown of the Experiences segment revenue and EBITDA that highlights clear and consistent financial stability.
Experiences Segment Breakdown (Excel)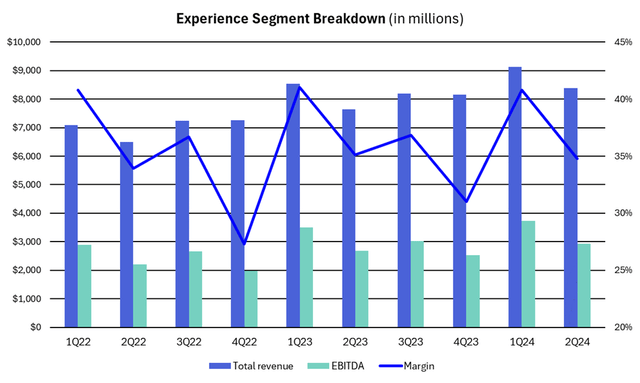
Next, let’s examine the underlying questions brought up by investors. During the Q2 earnings call, management guided towards weaker growth in the segment, which they attributed to revenge travel coming to an end. This is a factor, but the truth is that a majority of consumers seem to be in a difficult spot. Rates have stayed elevated, making it difficult for companies to provide affordable goods and services. While this is important to understand, I don’t believe it provides grounds for the parks doing poorly in the long run. As seen above, Experiences (which is almost entirely parks) continues providing robust cash flow to the company.
At the end of the day, no one can predict economic downturns or discretionary spending, but we can assume that consumers will most likely continue to visit parks. Forecasts can range, but a quick google search shows the global theme park industry growing at a CAGR of four to seven percent over the next ten years. Especially considering Disney’s immense market share, these forecasts seem more than reasonable and provides backing for continued cashflow generation.
In my opinion, the most important question to answer revolves around the high operational costs and capital expenditures behind Disney’s theme parks. Over the last 14 quarters, Disney has spent on average almost $1,200 million in CapEx focused parks investments every quarter. Management has also guided towards doubling this number over the next decade. While this may look negative to some investors, it shows management’s confidence in the segment. If they truly believed underlying issues existed, they would not be investing more into the segment. Rather, it allows Disney parks to remain the most innovative and attractive options for consumers.
Catalysts
Now the question remains, what will drive this change? I see current expectations focused on achievement rather than outperformance. Recalling my introduction, investors seemed to have priced in a high probability of failure across each segment. It’s impossible to directly calculate, but based on financial performance and investor metrics, I’d place the effects of the DTC segment first, then Experiences, and finally Sports and underlying content. Moving forward, the main catalyst for the DTC segment will be the password sharing crackdown, which is expected to take effect over the next few months. Netflix reported a significant boost in profit from this initiative, which went into effect in May 2023. Furthermore, each quarter provides key insight into both subscriber growth and ARPU. Upcoming TV show and movie releases will certainly influence this number.
Looking at parks, we continue seeing expansion, particularly through its five -year construction plan and investments of around $60 billion over the next ten years. Then in terms of content, Deadpool 3 and Inside Out 2 are set to be released over the next few months. Finally, ESPN is still on track to release a full-fledged 2025 streaming service that will give consumers access to all ESPN channels, including the NFL, NBA, and college sports. From a long-term perspective, I expect if many of the catalysts perform as promised, we will see significant stock price appreciation.
Valuation
Finally, we examine the valuation of Disney’s stock price. First, we need to understand the firm’s positioning. Objectively, I believe Disney has no clear competitors. The segmental breakdown is completely unique, which means to analyze the company, I decided to use historical multiples and key performance indicators to comprehend its valuation. Some may argue that Comcast (CMCSA) is a strong benchmark, but the underlying business models still differ in numerous ways.
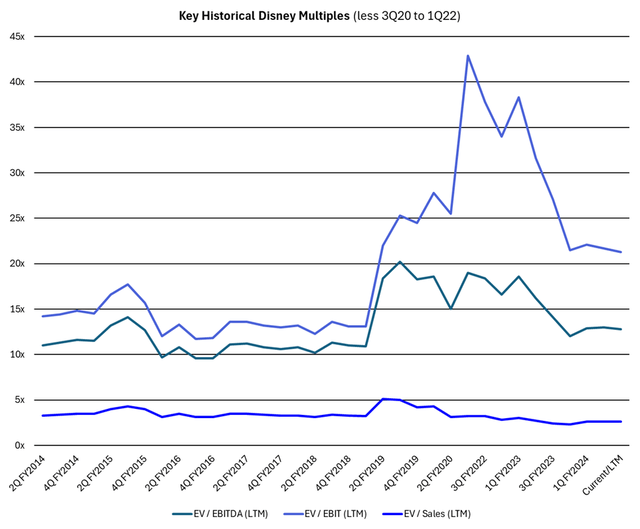
Starting with historical multiples, we can see what Disney is currently trading at by looking at Seeking Alpha’s valuation section. Fundamentally, the “F” valuation rating doesn’t reflect a meaningful comparable, since it’s benchmarking the Communication Services sector. Looking further, we see it actually trades at a significant discount to its own 5-year average. The only issue is, these numbers are inflated from Disney Parks, creating very little profit during 2020 and 2021. To combat this, I removed data from Q3 2020 to Q1 2022 in the graph below. Keep in mind, Disney operates on an October fiscal year-end.
While early 2022 still arguably consisted of outliers, multiple wise, Disney looks attractive right now. Both EV/EBITDA and EV/EBIT are trading around their lowest levels since Q1 2019, and EV/Sales is trading at its lowest levels ever. Specifically, EV/EBITDA is currently 12.8x, EV/EBIT is 21.3x, and EV/Sales is 2.6x. More importantly, this shows that investors have been willing to pay a premium over the last five years. Now, let’s take this analysis a step further by building out the next 10 quarters of financial data. Current expectations imply 2026 operating income of $18,546 million, which would imply a multiple of 12x to justify today’s stock price. Below, I have summarized my findings that imply a share price of $138 based on 2026 operating income of $19,057 million and a 15x multiple.
Implied Share Price (Excel Calculation)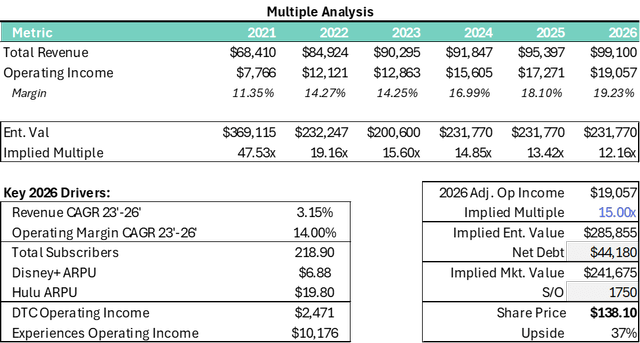
Sensitivity Analysis (Excel)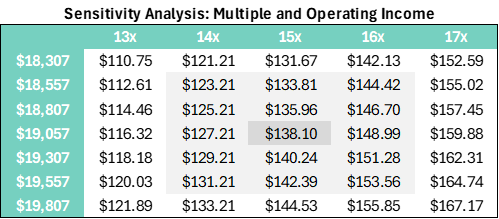
DTC and Parks Revenue Assumptions + Operating Margins through 2026 (Excel)
Starting with my sensitivity analysis, even assuming Disney trades down to a 13x multiple and misses expectations by ~$250 million, this still implies almost 10% in upside. Looking more broadly, my consolidated financials implied a CAGR of only 3.15% for Revenue, below expectations by over 1.5%. Then my operating margin is only above expectations by 0.8%. Both of these forecasts have a very high probability of success. This model also assumes conservative net adds and ARPU growth, which could be pushed even higher with the password sharing crackdown. Then for Experiences, revenue will grow at 4%-5%, with an operating margin of 27%. This basically assumes revenue growth stabilizes in line with management expectations, and operating margins converge to its recent average. In terms of breakdown, this even includes 2026 Experiences operating income accounting for only 53% of the total, inferring more diversification as Disney reaches its targets.
This valuation illustrates the current equity pricing, already implying worst-case scenarios. For example, assuming the Experiences segment has negative 2% growth and margins fall to 20%, this model still implies 8% in upside. Similarly, even with a multiple of 13x, there is potential for a 15% upside. This analysis displays a strong margin of safety, with even negative scenarios providing upside potential. In summary, my model assumptions remain conservative, sitting mostly in-line with current expectations. I believe if Disney can achieve its targets across streaming, linear network stability, and sustained park growth, investors are likely to value the firm at 15x operating income.
Risks
To remain transparent, my model could still be adjusted to infer further downside. Other investors may also be pricing Disney using different methodologies or multiple selection. Either way, potential issues for Disney remain relatively high, as their products and services depend heavily on discretionary spending. I expect short-term issues to persist until the FED begins cutting rates, hopefully by the end of 2024.
Moving towards specific risks, key performance indicators for the DTC segment remain a weak point for Disney. Any decline in subscribers, ARPU, or negative guidance regarding these metrics would cause a relatively significant negative price reaction. Moreover, there’s a chance cord-cutting happens quicker than expected, causing a sudden drop in earnings. On the Experiences side, Disney parks remain expensive for the average consumer. This could lead to a drop in attendance if Disney fails to properly respond. For now, this issue remains minimal and has not shown up in any financial reporting. Finally, the Sports segment and content generation also remain crucial facets of Disney’s business model. This means success in ESPN’s full DTC platform and continued content creation are vital to overall performance.
Conclusion
To briefly recap, Disney has seen a revival in operational cash flow, on track to surpass the 2018 metric. The DTC segment (Hulu and Disney+) continues to outperform in subscriber growth and ARPU, which has equated to continued revenue growth. DTC is also clearly growing faster than Linear is declining. Finally, Disney’s cash generating Experiences segment has performed well coming out of 2020 and remains the leader in the space. All of this is supported by the underlying intellectual property owned by Disney, which attracts a vast range of consumer demographics.
Disney remains a lucrative long-term investment, with numerous outlets for growth and stability. The current price of $101 implies multiple segments of the business missing expectations over the coming years. This allows for significant upside potential if Disney can continue growing at even a moderate pace, as reflected above in my model. Moreover, the DTC proposition of Disney+, Hulu, and ESPN captures a wide range of audiences and creates the perfect streaming package. Parks also continue showing foundational strength, and even assuming potential losses, the diversification of Disney allows for strong maneuverability. This analysis clearly illustrates the positive risk-to-reward ratio that a Disney investment provides. I own Disney now, and I will continue to own Disney for the foreseeable future.
Analyst’s Disclosure: I/we have a beneficial long position in the shares of DIS either through stock ownership, options, or other derivatives. I wrote this article myself, and it expresses my own opinions. I am not receiving compensation for it (other than from Seeking Alpha). I have no business relationship with any company whose stock is mentioned in this article.
Seeking Alpha’s Disclosure: Past performance is no guarantee of future results. No recommendation or advice is being given as to whether any investment is suitable for a particular investor. Any views or opinions expressed above may not reflect those of Seeking Alpha as a whole. Seeking Alpha is not a licensed securities dealer, broker or US investment adviser or investment bank. Our analysts are third party authors that include both professional investors and individual investors who may not be licensed or certified by any institute or regulatory body.

