Summary:
- Disney’s Q4 2023 financial performance shows revenue growth, highlighting resilience in the entertainment industry.
- Disney+ significantly contributes to the company’s success, adding millions of subscribers in Q4 2023 and targeting profitability by Q4 2024.
- Technical analysis suggests a potential bottom for Disney’s stock, indicating an upward trend and potential buying opportunities for long-term investors.

Wirestock
The Walt Disney Company’s (NYSE:DIS) financial performance in Q4 2023 showcases resilience and strategic adaptability in the ever-changing global entertainment landscape. Disney underscores its robustness amidst market complexities, marked by steady quarterly revenue and annual growth. The significant role of Disney+, bolstered by popular releases and original series, highlights the company’s solid standing in the streaming domain. This article extends the discussion initiated in the previous piece, focusing on the financial health per Q4 2023 earnings. It also updates the technical analysis to ascertain the upcoming trajectory of the stock price and identify potential investment avenues. It has been observed that, in line with the expectations from the previous discussion, the stock price has experienced an upward swing from the key technical support, indicating a potential upward trend.
Financial Performance and Growth
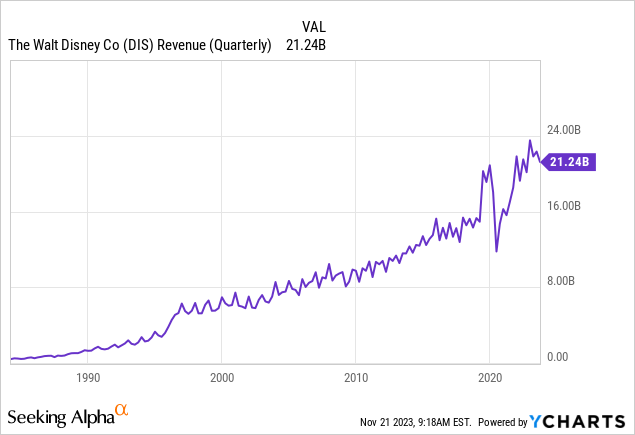
Disney’s financial performance in Q4 2023 showcased a 5% increase in quarterly revenue and a 7% yearly growth, reflecting a consistent upward trend as shown in the chart below. Notably, Disney’s diluted earnings per share (EPS) from continuing operations rose to $0.14 for the quarter, up from $0.09 in Q4 2022. However, there was a decline in yearly EPS, dropping from $1.75 to $1.29. The non-GAAP adjusted diluted EPS showed a more favorable picture, increasing to $0.82 for the quarter from $0.30 in the prior year and rising annually to $3.76 from $3.53. This financial performance underscores the strength and resilience of Disney’s diverse business portfolio, even as it navigates various market challenges.

Moreover, Disney’s streaming services, particularly Disney+, played a crucial role in this period’s success, adding nearly 7 million core subscribers in the fourth quarter. This growth was fueled by key streaming content such as “Elemental,” “Little Mermaid,” “Guardians of the Galaxy Vol. 3,” along with original series like “Ahsoka” and the Korean series “Moving.” The company remains optimistic about achieving profitability in its combined streaming businesses by Q4 2024 despite expecting fluctuations in progress.
Furthermore, ESPN’s domestic revenue and operating income showed year-over-year growth for fiscal years 2022 and 2023, emphasizing the enduring appeal of sports content and the strength of the ESPN brand. Additionally, the company’s Experiences segment reported over a 30% increase in operating income compared to the previous year, with growth across all international sites, including Disney Cruise Line, Disney Vacation Club, and Disneyland Resort. Despite wage inflation challenges and tough comparisons with the prior year’s 50th-anniversary celebration at Walt Disney World, the company continues to see robust performance in this segment.
Moreover, the cash generated from operations rose by $3.9 billion, climbing from $6.0 billion the previous year to $9.9 billion this year. This surge was attributed mainly to reduced expenditure on film and television content and an uptick in operating income from Experiences. However, this was somewhat balanced by the timing of payments for sports content. Capital expenditures remained on par with the previous year, with decreased spending at Experiences due to a reduction in cruise ship fleet expansion costs, being counterbalanced by increased outlays for Corporate facilities and Entertainment.
Disney’s future outlook appears strong, with plans to significantly grow free cash flow in fiscal 2024, approaching pre-pandemic levels. This growth and a solid balance sheet align the company to meet its investment and shareholder goals. CEO Robert A. Iger highlighted the transformative efforts undertaken in the past year, including a focus on restructuring and cost-efficiency, leading to an expected $7.5 billion in cost reductions. Disney aims to capitalize on four key areas: achieving streaming profitability, enhancing ESPN as a top digital sports platform, improving film studio output and economics, and boosting growth in parks and experiences. Iger’s bullish stance on these strategic priorities underscores Disney’s commitment to long-term development and shareholder value enhancement, leveraging its century-long creative excellence and innovation legacy.
Understanding Key Technical Support in Disney
Overview of Previous Discussion
The previous article analyzed the historical trends of Disney’s stock price through yearly and quarterly charts. Post-Great Recession, these charts showed a robust performance, with the stock price climbing to record highs amidst significant volatility. However, this volatility led to a notable price reversal in 2021, signaling a substantial correction that materialized in 2022. Following this correction, signs of stock price stabilization have been observed, with the stock finding solid support levels.
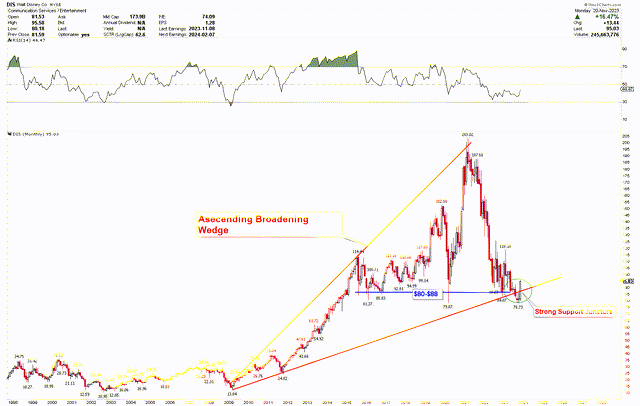
These support levels were identified using the Fibonacci retracement tool, extending from the 2009 low of $13.04 to the peak of $203.02. A critical support level was noted around $85.60, corresponding to the 61.8% Fibonacci retracement mark. This level was deemed a prime buying opportunity for long-term investors looking to build positions. Further reinforcing this support zone was the ascending broadening wedge pattern on the monthly chart, with a price range of $80-$88. This range was significant for long-term investors considering initiating long positions. Additionally, the consolidation pattern within the triangle formation on the chart underscored the bullish potential for Disney’s stock.
The Current State of Price Development
The stock’s price movement aligned with the expected trajectory discussed earlier, returning from a critical support level. The Q3 2023 earnings significantly contributed to this rebound from the strong support. The updated monthly chart shows that in October 2023, the stock dipped to $78.73, slightly below the forecasted support level of $80. The October monthly candle formed an inside bar, signaling a price compression and suggesting a buildup of momentum for a potential move in either direction. This inside bar was breached upwards, propelling the price over $88 in November 2023. This robust surge from a pivotal level was driven by a significant reversal in November 2023, indicating the possibility of a long-term bottom at these levels. A close above $88 by the end of November 2023 would signal a bullish key reversal on the chart, presenting a solid buying opportunity for long-term investors.

Disney Monthly Chart (StockCharts.com)
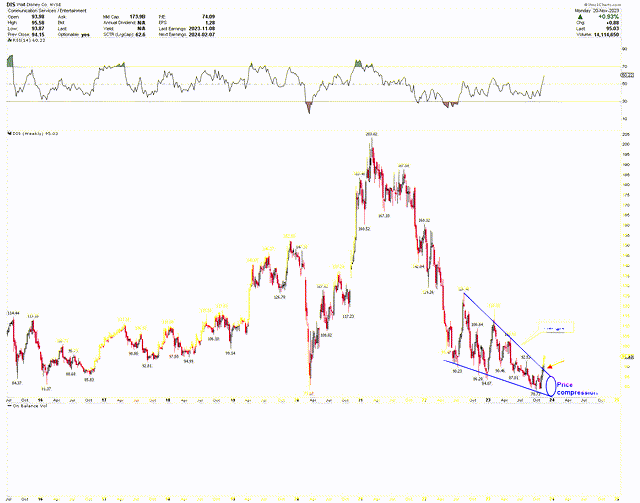
The weekly chart below further demonstrates the October price consolidation. Notably, by the end of October, the price was trading at the apex of a triangular pattern, and the release of Q4 2023 earnings broke this triangle pattern upwards, indicating a potential long-term bottom. The RSI crossing above the 50 mark further bolsters this bullish perspective.

Disney Weekly Chart (StockCharts.com)
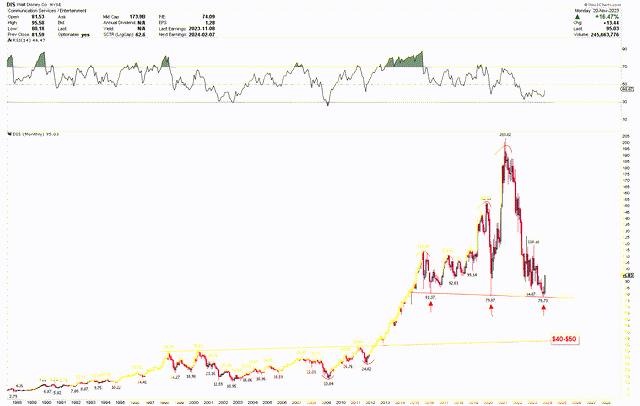
Another monthly chart underscores the significance of the $78 level, marked by a red trendline with three distinct touches at $81.37, $79.07, and $78.73. The recovery from this robust support level suggests a potential upward solid movement. However, the rapid fall from $203.02 has somewhat weakened the bullish momentum, implying that the price might experience some volatility before surpassing previous record highs. For the rally to maintain its strength, the stock must close above $130.44 monthly, corresponding to the 38.2% Fibonacci retracement level discussed previously.

Disney Monthly Chart (StockCharts.com)
Despite the recent downturn, the stock is rebounding from a crucial support zone of $80-$88, exhibiting bullish patterns that indicate a potential bottom at current levels. This scenario allows investors to increase long positions, anticipating further market upswing.
Market Risk
Despite an adjusted increase, the company’s decline in annual EPS from $1.75 to $1.29 signals potential vulnerabilities in a volatile global economy. This vulnerability could be exacerbated by several factors, including rising interest rates, inflationary pressures, and geopolitical uncertainties that may impact consumer spending and advertising revenues. Moreover, the entertainment industry, particularly streaming services, faces intense competition. Disney’s success in adding 7 million subscribers to Disney+ highlights its strength, but this sector is rapidly evolving with new entrants and changing consumer preferences, which could affect future growth and profitability.
Moreover, the company’s ability to meet free cash flow targets in 2024 hinges on continued growth in various segments, such as streaming, ESPN, and its parks and experiences. Any disruption in these areas, whether due to operational challenges, increased content costs, or external factors like health crises or geopolitical events, could impact financial performance. From a technical perspective, Disney’s stock indicates a volatile history with significant price corrections and consolidations. Falling below $78 could disrupt the ascending broadening wedge pattern, reversing the bullish outlook and suggesting a potential decline in price.
Bottom Line
In conclusion, Disney’s financial performance in Q4 2023 exemplifies its strength and adaptability in a challenging global entertainment landscape. The company has demonstrated resilience, marked by solid revenue growth and strategic advancements, particularly in its streaming services with Disney+. Building on previous discussions, this analysis reveals a positive trajectory for Disney’s stock, rebounding from significant support levels and indicating an upward trend. Despite potential market risks and vulnerabilities highlighted by fluctuations in annual EPS and intense industry competition, Disney’s diverse portfolio and strategic focus position it well for future growth. The technical analysis suggests a potential bottom at current levels, offering a promising outlook for long-term investors. A monthly close above $88 would confirm the establishment of a bottom, potentially triggering a robust rally to the upside. Investors may consider increasing long positions should the stock price dip, provided it stays above the $78 threshold.
Analyst’s Disclosure: I/we have no stock, option or similar derivative position in any of the companies mentioned, and no plans to initiate any such positions within the next 72 hours. I wrote this article myself, and it expresses my own opinions. I am not receiving compensation for it (other than from Seeking Alpha). I have no business relationship with any company whose stock is mentioned in this article.
Seeking Alpha’s Disclosure: Past performance is no guarantee of future results. No recommendation or advice is being given as to whether any investment is suitable for a particular investor. Any views or opinions expressed above may not reflect those of Seeking Alpha as a whole. Seeking Alpha is not a licensed securities dealer, broker or US investment adviser or investment bank. Our analysts are third party authors that include both professional investors and individual investors who may not be licensed or certified by any institute or regulatory body.
