Summary:
- Rivian stock is down over 90% since going public, and both short-term and long-term technical analyses indicate a bearish outlook.
- Daily and weekly chart analyses show Rivian in a persistent downtrend with significant resistance levels and bearish moving averages, suggesting further stock weakness.
- Despite some positive divergence in MACD and RSI indicators, mixed signals and overall bearish momentum make a bottom unlikely in the near term.
- Fundamentals reveal weak earnings with declining revenue but narrowing EPS losses, justifying current P/S and P/B ratios.
- Bearish technicals and the stock not being undervalued leads me to believe Rivian is currently a sell.
RoschetzkyIstockPhoto
Thesis
Down over 90% since its public debut, investors may be tempted to bottom fish Rivian Automotive, Inc. (NASDAQ:RIVN) stock. In my technical analysis below, I determine that the stock’s outlook looks poor in both the short term and longer term. A monthly analysis has not been provided, as Rivian only went public in 2021. While indicators show some mixed signals, charts and moving averages in both time frames are very bearish, making further weakness in the stock likely. As for the fundamentals, their most recent earnings were overall relatively weak as a decrease in revenue shows that the core business is not performing well. The low P/S ratio is therefore justified. For EPS, they did manage to narrow their losses considerably compared to prior quarters, making the rebound in the P/B ratio justifiable. As a whole, the fundamental analysis shows that Rivian is fairly valued currently in relation to their financial results. When considering the technicals and fundamentals together, I believe the stock is still a sell, with technicals being bearish and the stock not being undervalued by any means. Therefore, I warn investors not to bottom fish Rivian stock and I initiate it at a sell rating.
Daily Analysis
Chart Analysis
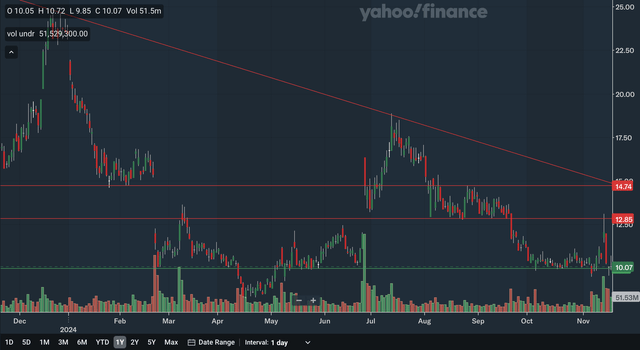
The daily chart for Rivian is a relatively negative one as the stock remains in a short-term downtrend. There is also more resistance overhead than support underneath. The only support area would be near current levels. The psychologically important 10 price level has been support many times during the year already. As for resistance, the nearest zone would be in the high 12s as that price level was resistance in March and earlier this month, and was support in August and September. Moving up, we also have support in the high 14s as that area was support early in the year, and was resistance in August. Lastly, the downtrend line is the final source of resistance, moving just below 15 and continuing to fall. Given its downward trajectory, it could become the primary source of resistance in the next year. Overall, the daily chart is net negative even though the stock current sits on a support level as the stock remains in a downtrend with heavy resistance on top.
Moving Average Analysis
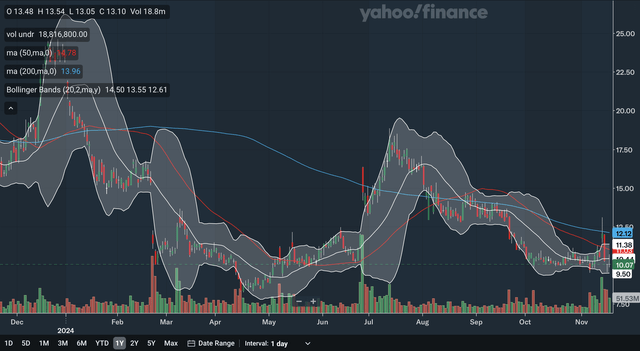
The 50-day SMA crossed below the 200-day SMA back in early October, a bearish indication. The gap between the two lines has been widening since the crossover, showing that bearish momentum has been accelerating. The stock currently trades below both of the SMAs with the 50-day SMA providing resistance at around 11 and falling. For the Bollinger Bands, the stock recently broke below the 20-day midline, an indication of weakness as that line is supposed to hold in any uptrend. In addition, that midline is now the nearest source of MA resistance as it is at around 10.5. The stock is currently still some distance from the lower band, showing that it could still have room to fall further. As a whole, I believe the MAs are considerably bearish as there are really no signs of strength from Rivian stock.
Indicator Analysis
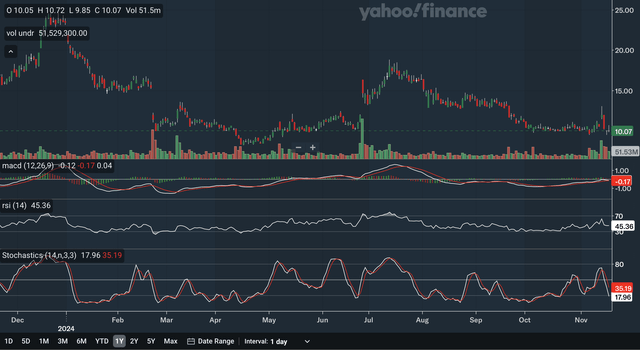
The MACD is still currently above the signal line, which is a positive indication. The gap between the lines has narrowed significantly in the past days, however, showing that bullish momentum has been receding. There is some positive divergence with the MACD. While the stock is at levels seen in late February and early March, the MACD is now much higher than levels seen during that period. Therefore, there may be strength building beneath the surface and could be an indication that the short-term bottom is in. For the RSI, it is currently at 45.36 after breaking below the critical 50 level, showing that the bears have regained control of the stock. The RSI also shows a bit of positive divergence. The stock is currently at the same level as at the late February trough, but the RSI is much higher and far from reaching the oversold 30 level. This is another subtle indication of strength. Lastly, for the stochastics, the %K had a bearish crossover with the %D earlier this month. Even though the crossover did not occur within the overbought 80 zone, this is still a significantly negative signal. From my analysis, I would say that these indicators reflect a mixed outlook, as the longer-term positive divergence signals come along with immediate signs of weakness in the stock.
Takeaway
The overall short-term technical outlook for Rivian is negative, with the chart and MAs clearly bearish and the indicators mixed. The chart showed that the stock remains in a downtrend, while the MAs reflect accelerating bearish momentum. For the indicators, as discussed above, there were mixed signals. Despite the daily analysis being negative as a whole, the positive divergence signals in the MACD and RSI are noteworthy as they could potentially indicate a bottom forming in the stock.
Weekly Analysis
Chart Analysis
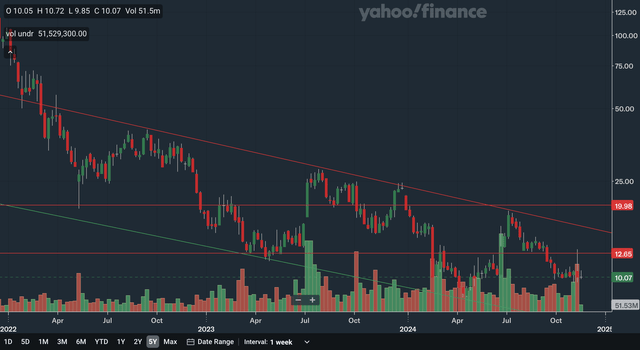
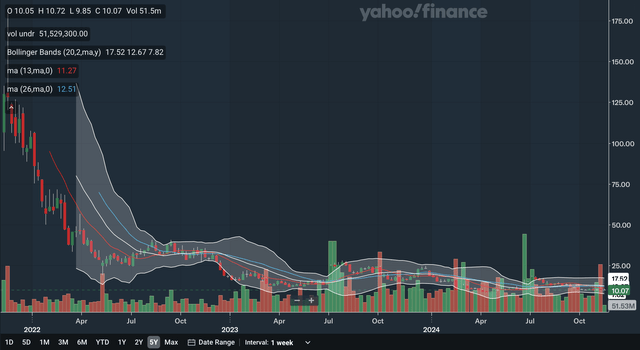
Note that the above chart is on a logarithmic scale to better show Rivian’s longer-term trend. The weekly chart is also a negative one for Rivian as the stock remains in a downward channel with significant resistance above. The only support for Rivian in the intermediate term would be the lower channel line, but its support is moving out of range. For resistance, the nearest area would be in the mid-12s. This is similar to a resistance level discussed in the daily analysis, but here we can see that its significance stretches back to mid-2023, as it was support back then. Next, we have the upper channel line that was resistance earlier this year and is sloping down quickly. This line has been touched multiple times in the past few years, making it very strong resistance. Lastly, there is also distant resistance at around the psychologically important 20 levels, as that price level has been support and resistance throughout the past few years. Overall, I believe the weekly chart reflects a negative longer-term outlook for Rivian, as the only source of support from the lower channel line is quite distant.
Moving Average Analysis
The 13-week SMA crossed below the 26-week SMA quite recently, a bearish indication. The gap between the SMAs is also expanding, again showing that bearish momentum has been building. If you look closely, the stock is also trading below both of the SMAs and so the 13-week SMA is likely to be resistance in the near future. For the Bollinger Bands, the stock broke beneath the 20-week midline earlier in the year, dashing hopes of an uptrend forming. The stock trades virtually right at the middle between the midline and lower band, showing that it still has room to fall further. The midline will also be resistance moving forward, but is currently still above the 26-week SMA. The weekly MAs have been quite similar to the daily MAs and so the outlook given here is also a weak one as there are many signs of weakness with the stock.
Indicator Analysis
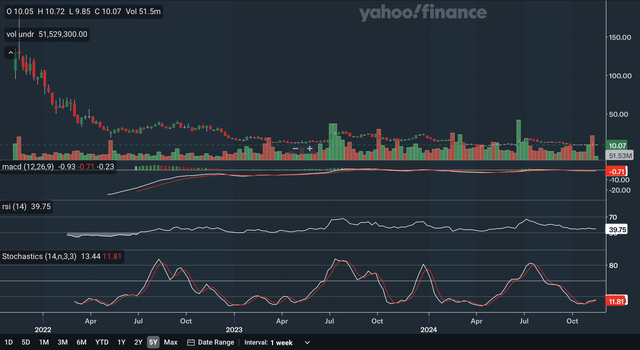
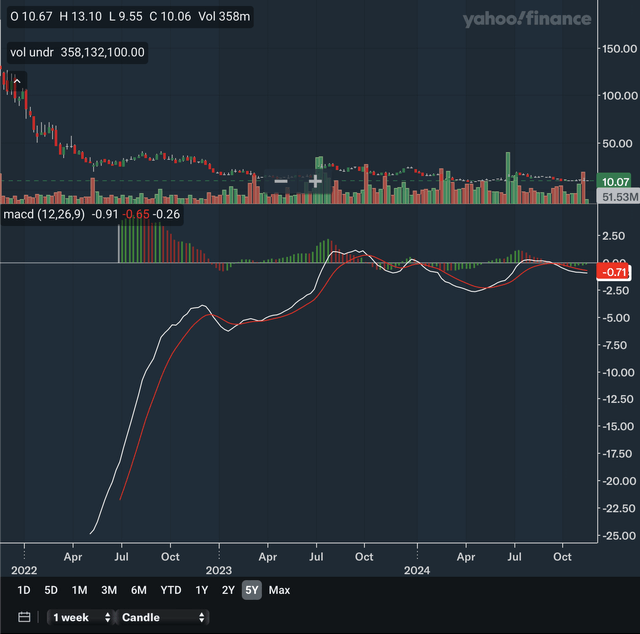
I have provided a zoom-in of the MACD to better show recent developments. The MACD is currently below the signal line after a bearish crossover a few months ago. The gap between the lines has been narrowing somewhat, as demonstrated by the histogram. This could indicate that bearish momentum is receding. For the RSI, it is currently at 39.75. It has also been below the important 50 level for an extended period, showing that the bears have clear control of the stock. Lastly, for the stochastics, the %K crossed above the %D recently within the oversold 20 zones, a highly bullish signal. However, the gap between the lines has been relatively narrow after the crossover and so there is still the chance that this could be a false signal and the stochastics may remain in the 20 zone. In my view, these weekly indicators show a mixed longer-term outlook, as there were both signs of receding bearishness but also signs of sustained weakness in the stock.
Takeaway
Overall, I would say that the longer-term technical outlook for Rivian is also negative. Like in the daily analysis, the chart and MAs were very bearish, but the indicators were a bit more mixed. The weekly chart shows that the stock is bound in a downward channel, while the MAs and Bollinger Bands indicate continued weakness. Lastly, as discussed above, the indicators were mixed and show that the outlook is uncertain.
Fundamentals & Valuation
Earnings
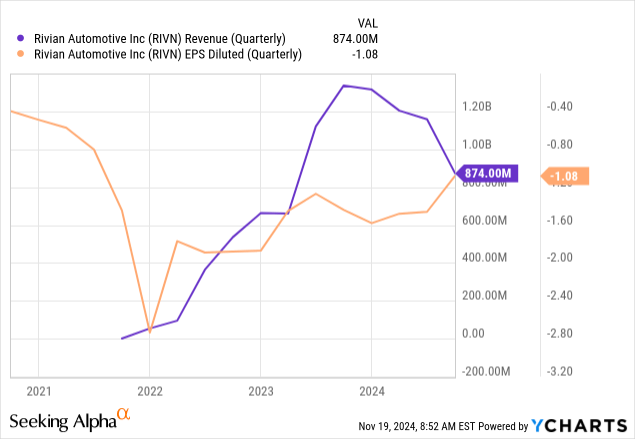
Rivian released their Q3 earnings earlier this month and showed weak results overall. Their production and delivery figures were both down YoY with production down from 16,304 to 13,157 and deliveries down from 15,564 to 10,018. Revenues saw a major decrease as it declined from $1.337 billion to only $874 million. The GAAP EPS loss narrowed, however, as they reported a loss of $1.08 versus $1.44 in the prior year period. Revenues missed expectations by $133.6 million, while GAAP EPS beat by $0.01. Even though net loss has narrowed somewhat, the decline in revenues shows that the core business is still very weak. Other noteworthy items from their earnings include the gross margin worsening from -36% to -45% YoY and the gross profit per unit delivered also worsening from -$30,648 to -$39,130. In my view, these results are quite poor as the only positive is that the net loss has narrowed. As you can see in the chart above, revenue is deteriorating while EPS is showing some improvement.
Valuation
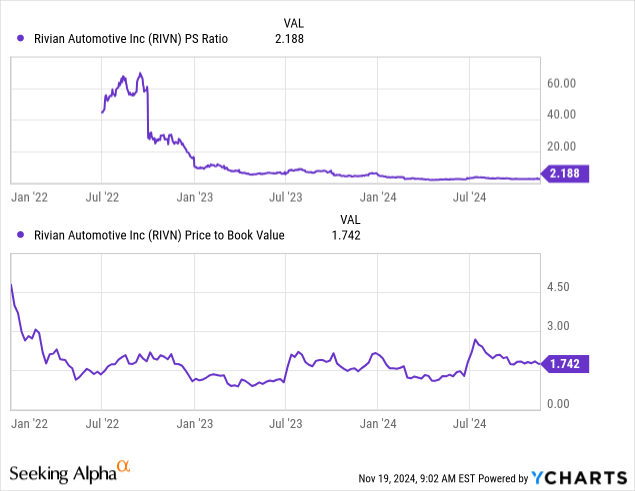
The P/S and P/B ratios are at low levels compared to their histories. The P/S ratio is currently at 2.188 after being at around 70 in 2022 while the P/B is currently at 1.742 after being over 4.5 at the start of 2022. The P/B has rebounded a bit from lows seen in 2023, however, as it was only at around 1.0 during the first half of 2023. Comparing the P/S ratio to the revenue chart above, I would say that the rock-bottom levels in the ratio are quite justified, as revenues are worsening at an alarming rate. From late 2021 to late 2023, revenue growth has been positive, but the P/S had already dropped to around 5. Given the poor trajectory of revenues compared to past years, the P/S deserves to be where it is currently. For the P/B ratio, as discussed above, it has recovered at a bit from the 2023 lows. I believe that this is also justified, as credit should be given to Rivian for narrowing their EPS loss significantly. EPS losses were at around $1.60 per quarter in 2023, but Rivian has been able to narrow that to a current quarter loss of only $1.08. Therefore, I believe the slight rebound in the P/B ratio is not unreasonable. Overall, in my view, Rivian is currently fairly valued as the P/S and P/B ratios accurately reflect the financial results for the company.
Conclusion
The technical analysis clearly shows that the stock is likely to experience further declines in both the nearer term and the longer term, as charts and moving averages show that the stock is in a poor position. While there were signs of bottoming in some of the indicators, there were also many bearish signals present, making the indicators’ outlook only uncertain at this time. For the fundamentals, as discussed above, I believe the current P/S and P/B ratios are justified given the worsening revenue but narrowing EPS losses. I conclude that the stock is fairly valued at current levels. With highly bearish technicals and the stock not undervalued, I believe now is not the time to bottom fish Rivian, as the stock may still be under significant pressure. Therefore, I initiate the stock at a sell rating.
Analyst’s Disclosure: I/we have no stock, option or similar derivative position in any of the companies mentioned, and no plans to initiate any such positions within the next 72 hours. I wrote this article myself, and it expresses my own opinions. I am not receiving compensation for it (other than from Seeking Alpha). I have no business relationship with any company whose stock is mentioned in this article.
Seeking Alpha’s Disclosure: Past performance is no guarantee of future results. No recommendation or advice is being given as to whether any investment is suitable for a particular investor. Any views or opinions expressed above may not reflect those of Seeking Alpha as a whole. Seeking Alpha is not a licensed securities dealer, broker or US investment adviser or investment bank. Our analysts are third party authors that include both professional investors and individual investors who may not be licensed or certified by any institute or regulatory body.

