Summary:
- Eli Lilly has triggered multiple Buy signals, including Timing, SAR, and Fundamental, with a 12-month target of ~$1,150.
- Technical indicators like Full Stochastic, Chaikin money flow, and ADX Demand signal show bullish trends and outperformance versus the Index.
- Despite strong Growth, Momentum, and Profitability scores, poor Valuation and Revision scores make LLY risky, leading to potential selling on good news.
- Index funds and ETFs may continue buying LLY because they don’t use fundamentals.
JHVEPhoto
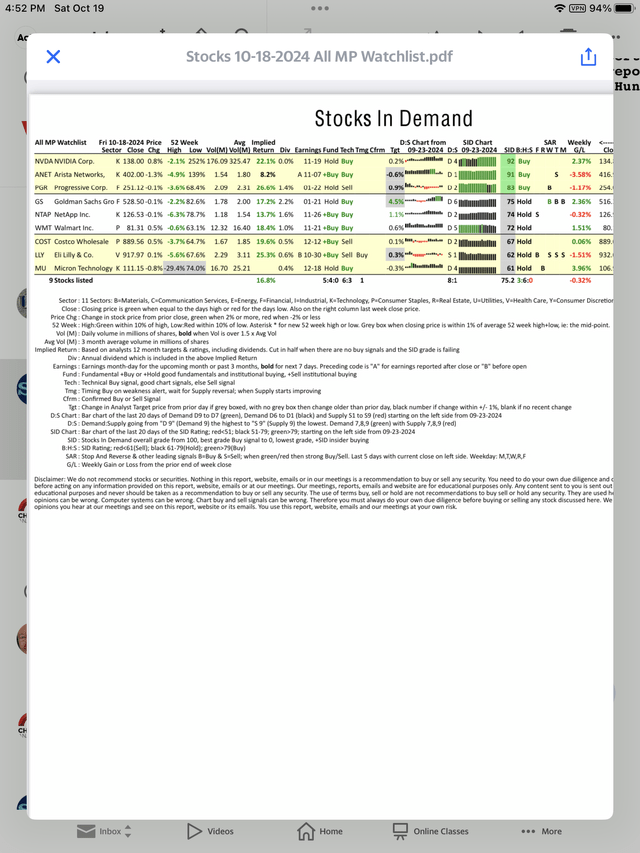
Eli Lilly (NYSE:LLY) just triggered our Timing, Tmg Buy Signal and our computer has calculated a 12-month target of ~$1,150. LLY earnings announcement is due on Oct. 30, and we expect the usual pop after good earnings. Our report below shows the Buy signal in the Tmg column. It also shows another short-term, timing signal in the Stop & Reverse or SAR columns which was just triggered on Friday, shown with a B in the Friday or F column. These signals are similar to the Confirmed buy signal shown in our last article on LLY.
Here is our daily portfolio Watchlist and you can see LLY is on the list with these short-term Buy signals in the Tmg and SAR columns:
LLY buy on weakness signals before earnings. (Daily Index Beaters)
Note on the above report that LLY also has a Buy signal in the Fundamental or Fund column. We will check that out below with SA, but right now, we want to turn to the weekly chart and the technical Buy signals.
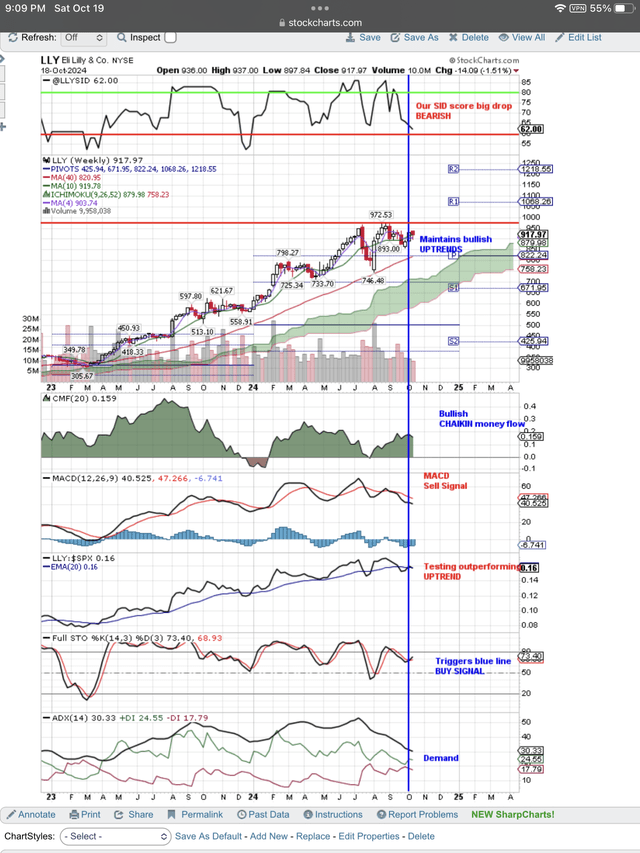
On the chart below, you can see the vertical, blue line, technical Buy signal triggered by the Full Stochastic or Full STO signal. In addition, you can see the bullish Chaikin money flow signal indicating Demand taking price higher. At the bottom of the chart is the ADX Demand signal. Also notice the uptrend in performance vs. the Index. You can see a bounce after dropping down to test that uptrend that indicates LLY is outperforming the Index.
There are also negative signals helping to create the Supply that is triggering our buy on weakness signals. At the top of the chart is our proprietary Stocks In Demand or SID signal. You can see it has a regular pattern of wide swings from Hold to Buy and back to Hold. We think the reason for this is that many portfolio managers have too much LLY in their portfolio because of the big runup in price. They are probably forced to sell a stock they love every time price moves higher. The buyers, of course, are ETFs, Index funds, hedge funds and small investors.
Here is our weekly chart showing our technical Buy signals, except for the MACD and SID signals:
LLY technical Buy signals before earnings. (StockCharts.com)
Now we want to return to our Fund Buy signal mentioned above and shown on our Daily Index Beaters report in the Fund column. We do our due diligence on this signal by checking with SA analysts and Quant ratings. Our SID Hold rating is in agreement with the SA Quant Hold rating, so we are comfortable with that, but we expect earnings will pop our SID signal to a Buy. Both SA and Wall St. analysts rate LLY as a Buy, and we certainly find that supporting the Buy signal in our Fund column shown in the report above.
The SA Quant scores for Growth, Momentum and Profitability are very good for LLY. However, poor scores on Valuation and Revisions are problematic. The forward PE of 68 is difficult to accept and allows for no possibility of any downward revisions. LLY is priced to perfection, and that makes it risky. That may also explain the big drop in our SID score from a Buy signal to a Hold signal.
Poor scores for Valuation and Revisions would prompt many portfolio managers to sell into strength. So even if we get a pop on this earnings report, we will probably see selling on the good news, as we have seen in the past.
Nevertheless, there are other buyers out there who will still be attracted to LLY and the higher target our computer projects for the year ahead. Index funds and sector ETFs usually do not use fundamentals to buy. They only use Demand for the Index to buy LLY because it is part of the Index or ETF.
Analyst’s Disclosure: I/we have no stock, option or similar derivative position in any of the companies mentioned, but may initiate a beneficial Long position through a purchase of the stock, or the purchase of call options or similar derivatives in LLY over the next 72 hours. I wrote this article myself, and it expresses my own opinions. I am not receiving compensation for it (other than from Seeking Alpha). I have no business relationship with any company whose stock is mentioned in this article.
Disclaimer: We are not investment advisers and we never recommend stocks or securities. Nothing on this website, in our reports and emails or in our meetings is a recommendation to buy or sell any security. Options are especially risky and most options expire worthless. You need to do your own due diligence and consult with a professional financial advisor before acting on any information provided on this website or at our meetings. Our meetings and website are for educational purposes only. Any content sent to you is sent out as any newspaper or newsletter, is for educational purposes and never should be taken as a recommendation to buy or sell any security. The use of terms buy, sell or hold are not recommendations to buy sell or hold any security. They are used here strictly for educational purposes. Analysts price targets are educated guesses and can be wrong. Computer systems like ours, using analyst targets therefore can be wrong. Chart buy and sell signals can be wrong and are used by our system which can then be wrong. Therefore you must always do your own due diligence before buying or selling any stock discussed here. Past results may never be repeated again and are no indication of how well our SID score Buy signal will do in the future. We assume no liability for erroneous data or opinions you hear at our meetings and see on this website or its emails and reports. You use this website and our meetings at your own risk.
Seeking Alpha’s Disclosure: Past performance is no guarantee of future results. No recommendation or advice is being given as to whether any investment is suitable for a particular investor. Any views or opinions expressed above may not reflect those of Seeking Alpha as a whole. Seeking Alpha is not a licensed securities dealer, broker or US investment adviser or investment bank. Our analysts are third party authors that include both professional investors and individual investors who may not be licensed or certified by any institute or regulatory body.
To understand completely our fundamental and technical approach to making money in the stock market read my book “Successful Stock Signals” published by Wiley. This is the method that I taught to professional portfolio managers on Wall St. and now I share these secrets with you with 50 stock picking programs picking winners every day. You receive our daily email of stocks with Buy Signals before the market opens.
