Summary:
- Tesla, Inc.’s technical analysis is overwhelmingly positive across all time frames, indicating strong bullish momentum and support levels, making it a buy.
- Despite modest Q3 earnings, CEO Elon Musk’s 2025 growth estimates significantly boost Tesla’s outlook, justifying its current valuation.
- The stock’s P/E and P/S ratios are historically low for Tesla, making the valuation more reasonable given the projected growth.
- Overall, Tesla’s technicals are bullish, and the fundamentals, bolstered by strong future growth projections, support a continued bull run.
baileystock
Thesis
CEO Elon Musk threw down the gauntlet at last week’s earnings event with impressive 2025 growth estimates. Tesla, Inc.’s (NASDAQ:TSLA) stock skyrocketed as a result. With this recent surge, as discussed below, the technicals indicate it is all-systems-go for Tesla as the chart, moving average, and indicator analyses of all time frames show that Tesla’s outlook is bright. In terms of the fundamentals, while Q3 earnings were only satisfactory, as stated above, their 2025 estimates stole the show.
As for the valuation, the P/E and P/S ratio are down heavily from their recent years’ highs, but is still lofty when looking at the current growth rates. Tesla’s valuation looks much more reasonable when considering its 2025 growth prospects, and so that leads me to believe the stock is currently fairly valued to perhaps just slightly overvalued. Therefore, since the technicals are overwhelmingly positive and the fundamentals overall net positive, I initiate Tesla at a buy rating.
Daily Analysis
Chart Analysis
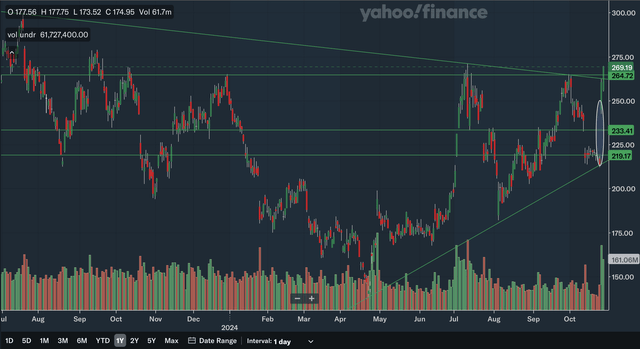
The daily chart for Tesla is a highly favorable one. The stock has no resistance above, as it recently broke out of both a short-term downtrend and a significant resistance zone. These lines should reverse polarity and be support moving forward. The nearest area of support would be in the mid-260s, as that area has been significant resistance in 2023 and 2024. The next support area would be the broken downtrend line. It is sloping down but remains relevant in the near future. The area in the low 230s would also be support, as it was resistance this year and support back in 2023. In addition, we have an upside gap at around 220 that could be support if Tesla pulls back.
Lastly, there is a nearer term uptrend line that has developed since earlier in the year and could be support as it is quickly sloping upwards. In my view, this daily chart demonstrates that Tesla is in a strong near term position as it has broken through tough resistance and a downtrend line. Furthermore, the stock is now in a nearer term uptrend.
Moving Average Analysis
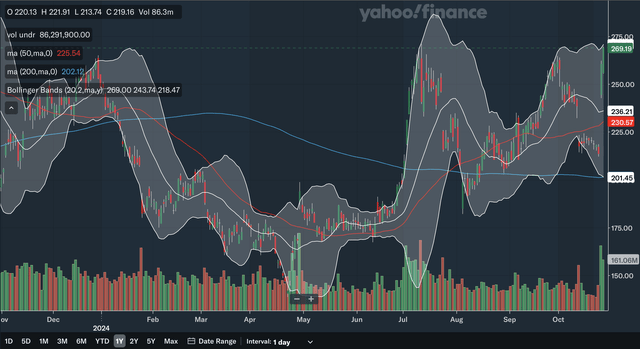
The positive story carries into the moving averages, or MAs. The 50-day SMA and 200 day SMA had a golden cross back in July of this year, a highly bullish signal. In addition, the 50-day SMA is currently widening the gap with the 200-day SMA, showing that bullish momentum is building. The stock is currently trading quite far above the SMAs as the 50-day SMA is sitting at around 15% below the current stock price. For the Bollinger Bands, the stock is right at the upper band after the recent surge in the stock. This could signal it is overbought but as you can see, even earlier this year, the stock can remain at this upper band for extended periods if the bullish momentum is sustained. The 20-day midline of the Bollinger Bands is the nearest MA support level, as Tesla has moved into a near term uptrend. Overall, I believe the MAs clearly show a healthy uptrend for Tesla, as there are no bearish signals in sight.
Indicator Analysis
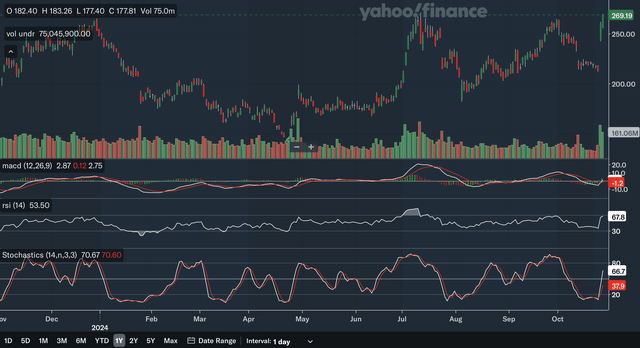
The MACD just had a bullish crossover with the signal line, indicating that we are starting the next upswing in the uptrend. The MACD does show a bit of concerning negative divergence, however, since the stock is back to 52-week highs but the MACD is well below levels seen in July. The RSI also shows this divergence, as it too remains below the July peak. These two divergence signals should be monitored closely, as it can be a potentially bearish development. The RSI is currently below the overbought 70 level despite the major rally in the past days. Lastly, for the stochastics, the %K recently crossed above the %D within the oversold 20 zone, which is a highly bullish signal. The gap between the two has significantly widened, indicating strong momentum. From my analysis, investors should be optimistic about Tesla stock but should still show caution as the divergence signals could be red flags.
Takeaway
All three of the daily analyses point to a bright short-term technical outlook for Tesla. The chart shows that the stock has broken out of a downtrend and is now in an uptrend with plenty of support underneath, while the moving averages confirm the uptrend. As for the indicators, while there were some negative divergence signals that investors should monitor, there are many bullish signals that should give investors the green light.
Weekly Analysis
Chart Analysis
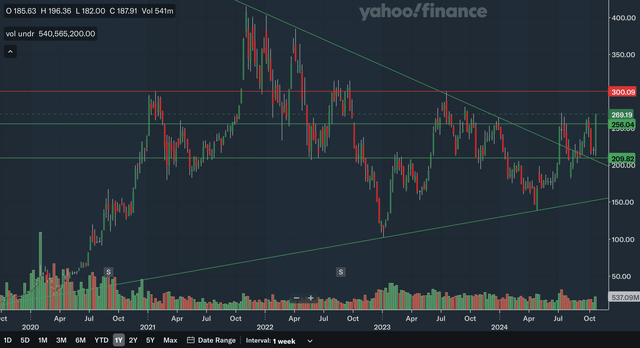
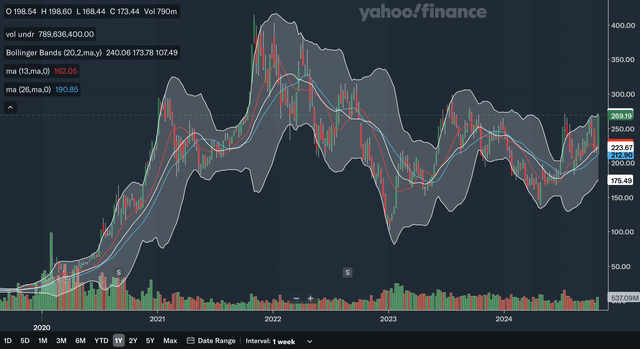
The weekly chart is another positive one for Tesla. The stock has broken out of an intermediate term downtrend very recently and remains in a longer-term uptrend as shown above. The only area of resistance would be at the psychologically important 300 levels as that area has been heavy resistance in 2021, 2022, and 2023. If Tesla extends its bull run, this level could be relevant. The nearest support level, on the other hand, would be in the mid-250s. This level is similar to the one identified in the daily analysis, but here you can see its significance dates back to 2021 and has been both support and resistance. We also have support at around 210 as it also been a key level in the past few years. Lastly, we have the two trend lines. The downtrend line is nearing 200 and is likely to move out of range rapidly, while the uptrend line is distant support. In my view, Tesla’s intermediate term situation is positive as it has once again broken out of a downtrend while there is strong support underneath.
Moving Average Analysis
The 13-week SMA and the 26-week SMA had a bullish crossover earlier this year. After the gap between the two briefly narrowed, the 13-week SMA has regained its upward trajectory, showing that the bulls are resilient, and it is likely to pull away from the 26-week SMA again in the near future. The stock is also trading far above these weekly SMAs. For the Bollinger Bands, the stock is once again at the upper band, potentially indicating it is overbought. Note that the 20-week midline has held as support since earlier in the year, showing that the stock could be in an intermediate term uptrend. From my analysis, the SMAs and Bollinger Bands confirm the intermediate term chart’s positive outlook for Tesla stock.
Indicator Analysis
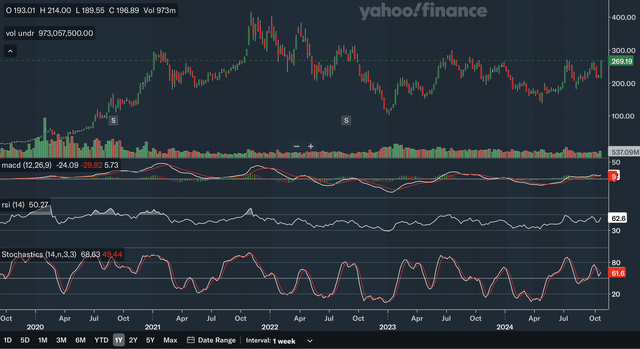
The MACD recently bounced off the signal line and remains above it, a bullish signal that the uptrend remains intact. Even more importantly, there is no sight of the negative divergence that was present in the daily analysis. The MACD’s recent peak bests the July peak. The RSI still shows some negative divergence, but it is less severe than in the daily analysis. The RSI is currently at 62.6 and seems to be holding above the critical 50 level, showing that the bulls remain in control of the stock.
Lastly, for the stochastics, we are right at an imminent bullish crossover as the %K is set to cross above the %D. Overall, in my view, these indicators once again show a strong outlook for Tesla, and could be even stronger than the daily indicators as signs of divergence are much less pronounced here.
Takeaway
Like in the daily analysis, all three weekly analyses shows a positive intermediate term technical picture for Tesla. The chart shows that the stock remains in a longer-term uptrend while breaking out of a nearer term downtrend, as the moving averages confirm and support this uptrend. Lastly, for the indicators, as discussed above, they are positive as there were bullish indications along with much less negative divergence than in the daily analysis.
Monthly Analysis
Chart Analysis
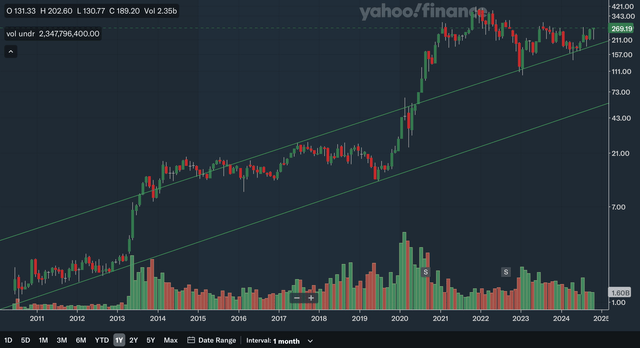
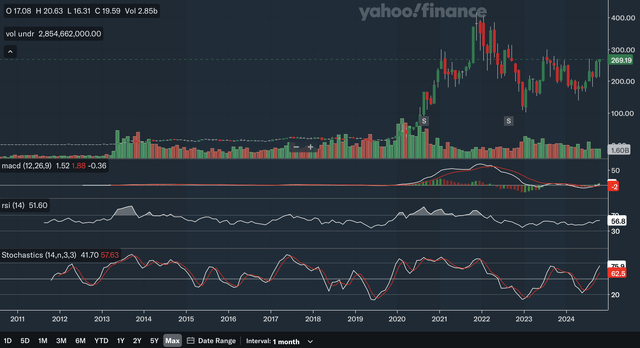
Note that the above chart is on a logarithmic scale so that the long-term trend is better shown. There is not too much to discuss here, as Tesla has surged so much in the long term that there are few relevant support levels to discuss. The most important takeaway here is that the stock remains in a long-term uptrend that dates all the way back to 2010. Although the stock is miles above this trend line (the lower line on the above chart), it is in an uptrend nonetheless. The other line that I have drawn is a channel line that dates back to 2016. The stock broke out of this upper channel line on heavy volume in 2020 and the stock has remained above this line since. This line acted as significant support in 2023 and earlier this year. The breakout in 2020 signalled an acceleration in the long-term uptrend, and the stock currently remains in this accelerated uptrend. The support of this upper channel line is relatively close as it moves to the 210s. In my view, the long-term chart is another positive one for Tesla, as there are really no bearish indications to be seen.
Moving Average Analysis
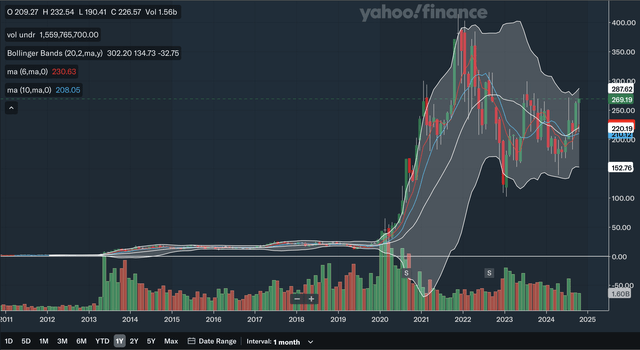
The 6-month SMA recently crossed above the 10-month SMA, which is a bullish signal. The gap is also rapidly widening as the 6-month SMA is on a steep trajectory, showing strong bullish momentum. Again, the stock is trading quite far above the SMAs with the 6-month SMA providing support at only around 220. For the Bollinger Bands, the stock has not hit the upper band, showing it is not yet overbought in the long term and has room to run. Earlier in the year, the stock also reclaimed the 20-month midline, which is another positive development. After trending down since 2022, the midline has also turned up and could be a source of support moving forward. Overall, from my analysis, the long term SMAs and Bollinger Bands are positive as there are multiple bullish indications here.
Indicator Analysis
The MACD crossed above the signal line very recently and is a bullish signal. For the monthly MACD, there is also no negative divergence to worry about as the MACD has risen consistently from the trough earlier in the year. For the RSI, there is also no negative divergence as it has recently recorded its highest reading in the past year. It has also reclaimed the important 50 level showing that the bulls are back in control. Lastly, for the stochastics the %K had a bullish crossover with the %D earlier in the year and as of late the gap between the two has widened with no signs of narrowing. The stochastics %K reading is also back to levels seen at the 2023 peak, confirming the latest bull run in Tesla stock to be valid as the stock itself also nears the 2023 peak. I believe these monthly indicators are strongly positive as there are no signs of divergence when looking at the long term time frame.
Takeaway
Once again, all three of the analyses show a positive technical outlook for Tesla stock. The chart shows that the stock actually remains in an accelerated long-term uptrend despite the pullback in the past few years, while the moving averages also show positive indications. As for the indicators, with no negative divergence in sight, they also indicate a bright long-term future for Tesla.
Fundamentals & Valuation
Earnings
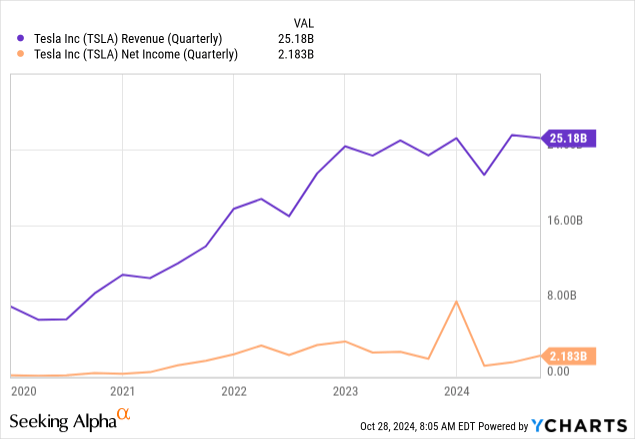
As stated in the thesis, Elon Musk threw down the gauntlet at Tesla’s earnings last week. As reported by CNBC, last Thursday the stock rocketed 22%, the stock’s best day in 11 years. The star of the show was likely Musk’s 2025 vehicle growth projection. CNBC reports that Musk estimated that growth would be between 20-30%, much higher than the projected 15% by analysts. Looking back at 2024 Q3, Tesla reported total revenues of $25.182 billion, up 8% YoY and an adjusted EPS of $0.72 which is up 9% YoY. Revenues actually missed estimates by $259.57 million, while EPS beat by $0.12. As illustrated by the above chart, Tesla is experiencing modest growth by historic standards.
Other highlights in their earnings report include FCFs of $2.742 billion, up 223% YoY and an operating margin of 10.8% up 323 bps from the year ago period. While Q3 earnings were resilient, they were nothing that spectacular. Therefore, there is no doubt, that Elon Musk’s strong guidance commentary was the largest contributor to Tesla’s recent surge.
Valuation
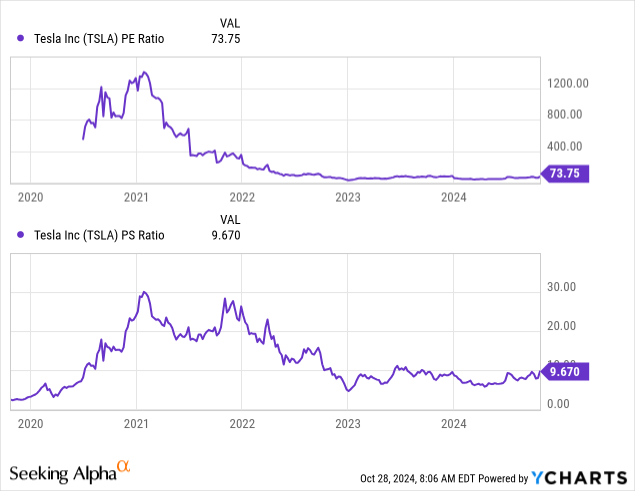
When considered in isolation, the current P/E and P/S ratios for Tesla are not particularly cheap. However, as you can see above, they are near rock bottom levels historically for Tesla. The P/E ratio is currently in the mid-70s down heavily from over 1200 back in 2020 and 2021. The P/S ratio is currently at around 10 after being over 30 back in 2021.
While it is true that Tesla’s current growth rate in the single digits can hardly support even these current valuation multiples, I believe Elon Musk’s 2025 growth estimates make its valuation much more reasonable. If the vehicle growth figures were to translate to bottom-line growth, Tesla would see a significant re-acceleration of its financial results. In addition, we could be at the start of a new growth cycle for Tesla as inflation recedes in major markets worldwide and as consumer confidence recovers. Therefore, while the stock is by no means cheap at current levels, I do believe the valuation is much more justified than it was before the strong guidance was issued. Overall, I would conclude that Tesla is currently around fairly valued to perhaps maybe moderately overvalued since the stock is overvalued relative to TTM figures but quite reasonable if the projected growth materializes.
Conclusion
As discussed above, the technicals are overwhelmingly in Tesla’s favor, as analyses in all time frames are positive. The charts show Tesla remains in an uptrend and that the stock has broken out from important levels recently. The moving averages show plenty of green flags as they all confirm the uptrend. Lastly, despite some negative divergence in the MACD and RSI in the daily charts, the vast majority of indicator signals are bullish.
As for the fundamentals, Q3 earnings were resilient but not spectacular. As analyzed above, the real highlight was the 2025 growth estimate, and that better justifies the still quite lofty valuation. Therefore, I believe Tesla stock is a buy as the technicals are bullish while the fundamentals should be no obstacle to its bull run.
Analyst’s Disclosure: I/we have no stock, option or similar derivative position in any of the companies mentioned, and no plans to initiate any such positions within the next 72 hours. I wrote this article myself, and it expresses my own opinions. I am not receiving compensation for it (other than from Seeking Alpha). I have no business relationship with any company whose stock is mentioned in this article.
Seeking Alpha’s Disclosure: Past performance is no guarantee of future results. No recommendation or advice is being given as to whether any investment is suitable for a particular investor. Any views or opinions expressed above may not reflect those of Seeking Alpha as a whole. Seeking Alpha is not a licensed securities dealer, broker or US investment adviser or investment bank. Our analysts are third party authors that include both professional investors and individual investors who may not be licensed or certified by any institute or regulatory body.

