Summary:
- Energy Transfer is an underappreciated midstream company with a negative shareholder stigma due to a distribution cut in 2020.
- ET’s financial footing is healthy and warrants a Buy rating, as it has taken steps to improve its credit metrics and has ample margin to raise the distribution.
- Comparisons to other midstream companies show that ET is undervalued with respect to its cash generation abilities.
deepblue4you/iStock via Getty Images
Thesis
Energy Transfer (NYSE:ET) continues to be undervalued compared to the bulk of the midstream industry. This discounted valuation is a result of negative shareholder sentiment as a result of a distribution cutback in 2020. It is my view that this stigma presents an opportunity to buy this high-yield stock with less risk than would be inferred if readers did not keep an open mind and let the past stay in the past.
I previously covered ET in May 2023 with a BUY rating. Since then, the company has continued to increase the distribution while also making several accretive acquisitions. The stock has made some gains in that time but has not kept up with the operational performance of the company, resulting in underlying value. As a result, it felt it was appropriate to perform a deep dive to remove any concerns that may be keeping investors on the sidelines.
This article will touch on ET’s history to examine some of its previous mistakes. We will then look at the self-prescribed medicine that ET took to improve its financial footing and boost its credit metrics. Finally, I will let the math speak for itself to show that ET is undervalued and has ample margin to continue to raise the distribution.
Through this deep dive, I intend to show investors that examining the income statement of a company is the best method to find market betting returns. ET’s financial footing is healthy and warrants a BUY rating.
Introduction
Energy Transfer is a midstream company that participates in the transportation of natural gas, NGLs, crude oil, and refined products. The company consists of thousands of miles of pipelines and associated infrastructure to help fuel the world’s energy needs.
ET Asset Map (ET Investor Presentation)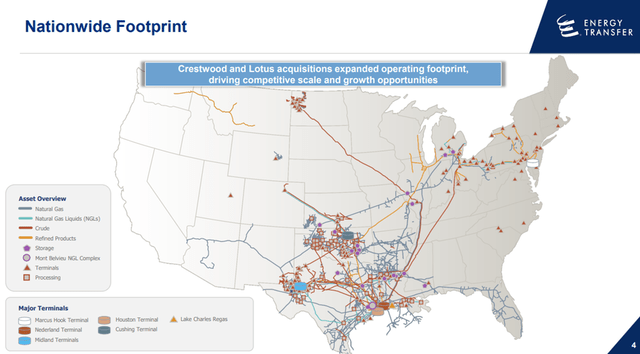
The Stigma
In 2020, ET cut its dividend in half. This obviously had a negative impact on the unit holder base and has left ET with a negative stigma. Pain is a powerful teacher, but in this case, it could be blinding some investors from understanding Energy Transfer at its core.
After the door was opened by the distribution cut, this stigma gains speed when we start looking at past price performance. Currently, ET sits a less than half of its 2015 highs. The story looks even worse when looking at how the debt has climbed over the last decade. The bears must be on to something here.
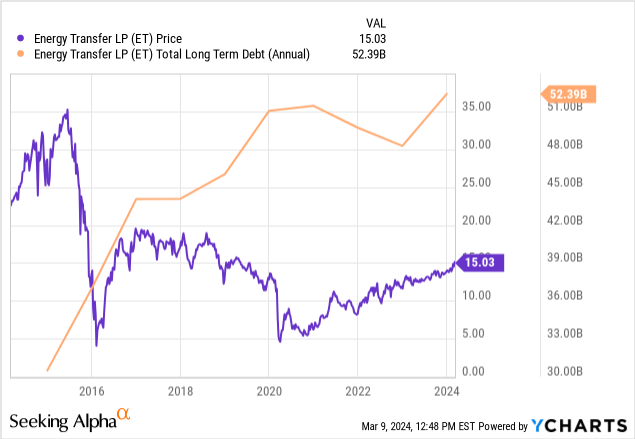
Clearly, there is some truth behind the bear case for ET. But is ET really the odd man out here?
When comparing the price performance and debt profile of EPD and Enbridge (ENB), we find nearly identical charts for the last decade. Just to be sure, I compared several other large-cap midstream companies and found similar results in ONEOK (OKE) and MPLX (MPLX). So clearly, ET is not an outlier but actually following the same practices as the bulk of the midstream industry.
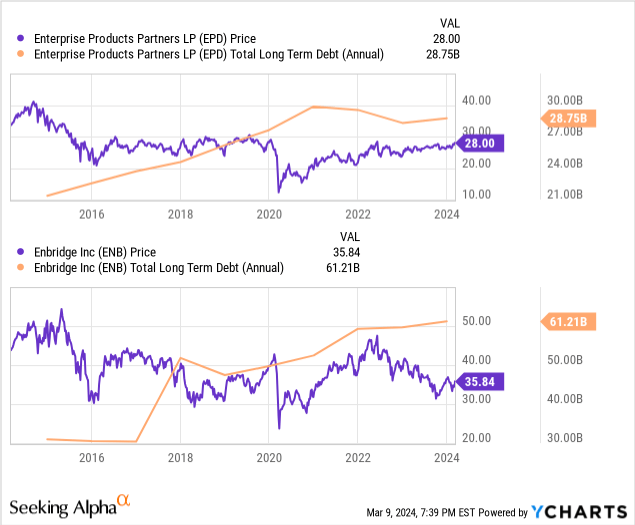
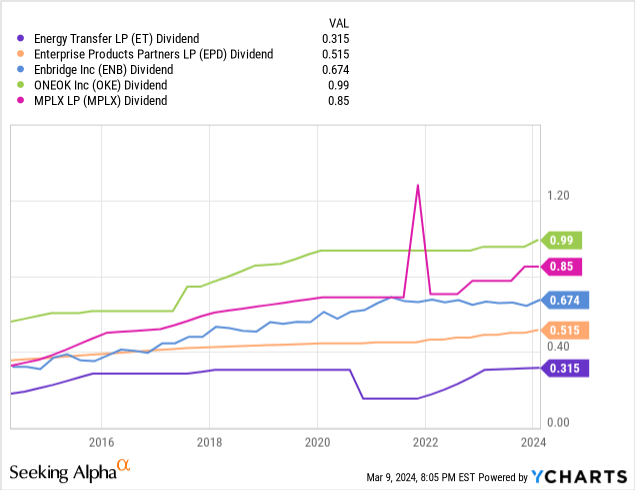
After showing that ET is not unique in share price performance or debt accumulation, our high-level bear case against ET has now been boiled down to one variable. A distribution cut. Going back 10 years, ET is the only company in the group to do so.
Since many investors in the midstream space are reliant on their investments as forms of income, it is natural to seek consistency. To address this, we will dive into what necessitated this cut, and what allowed the distribution to be restored in relatively short order.
The Medicine
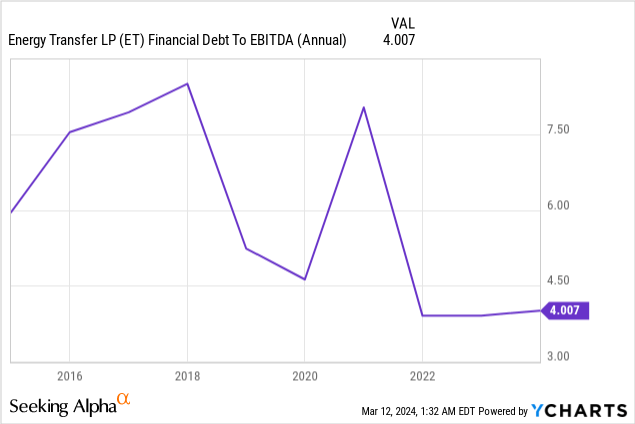
Hindsight is always 20/20. But looking back, it shouldn’t really have been all that surprising that the distribution at that time was not sustainable. 2019 marked the first year the company was free cash flow positive. At that time, ET was significantly levered, with a debt-to-EBITDA ratio of roughly 5.25x.
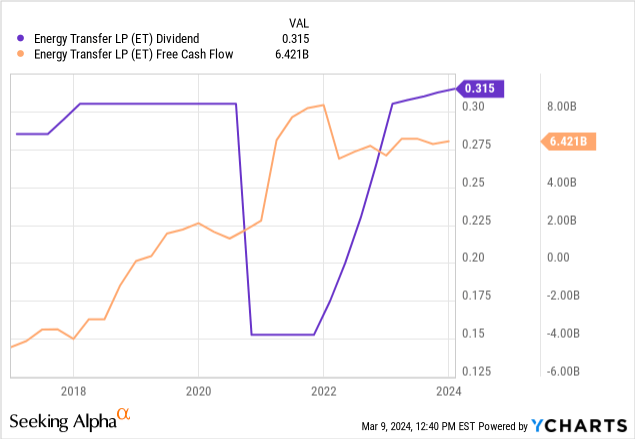
With minimal free cash flow, rapid debt growth, and economic uncertainty from the pandemic, ET was faced with a downgrade to its credit rating from the rating agencies. With over $50 billion in debt at the time, even a 1% increase in interest rates would have significant financial implications. ET chose the fastest cure to the problem; to cut the distribution by 50%. This allowed ET to free up $1.7 billion annually and allocate those funds to the balance sheet.
Chairman and CEO Kelcey Warren discussed the rationale for the distribution cut in the Q3 2020 conference call.
The reduction of the distribution is a proactive decision to strategically accelerate debt reduction as we continue to focus on achieving our leverage target of 4 times to 4.5 times on a rating agency basis and a solid investment grade rating.
We expect that the distribution reduction will result in approximately $1.7 billion of additional cash flow on an annualized basis that will be directly used to pay down debt balances and maturities. This is a significant step in Energy Transfer’s plan to create more financial flexibility and lessen our cap – cost of capital. Once we reach our leverage target, we are looking at returning additional capital to unitholders.
The effect of this decision was immediate. By the end of the following year, the company repaid $6.3 billion in debt and began restoring the distribution. By the end of 2022, the distribution had been restored to prior levels and its leverage ratio had been lowered to the range of approximately 4X.
The Math
Now it’s time to tackle that pesky notion that ET is set up to repeat its distribution-cutting ways. We’ll start with how ET expects 2024 to unfold.
The company projects that the new year will bring a 7% increase in EBITDA. This increase is mainly attributed to a full operational year of its acquisitions of Crestwood Partners and Lotus Midstream.
The company also plans to spend approximately $2.5 billion on organic growth projects in 2024. The bulk of this spending will be allocated to NGL export (55%) and natural gas transportation (25%) projects.
2024 EBITDA Estimates (ET Investor Presentation)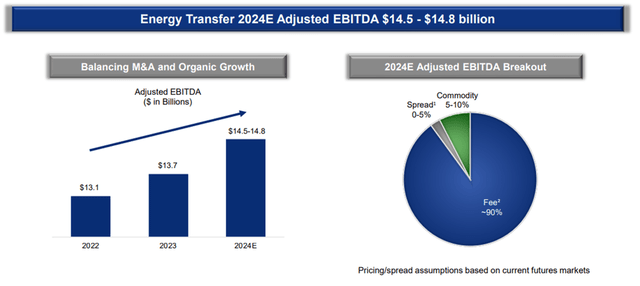
To understand how all of this fits into the stability of the distribution, we need to analyze the various components of the ET budget and how it affects distributable cash flow. Below, I have created a table to display the key items from my ET financial model.
| 2024 Estimate | |
| EBITDA | $14.50B |
| Interest Expense | ($2.84B) |
| Tax Expense | ($0.34B) |
| Growth CAPEX Expense | ($2.60B) |
| Maintenance CAPEX Expense | ($0.84B) |
| Distribution to Non-Controlling Interests | ($1.86B) |
| Distribution to Common Unit Holders | ($4.24B) |
| Remaining FCF | $1.94B |
In this model, I have included the following assumptions:
- Low-end EBITDA guidance.
- High-end CAPEX spending guidance.
- 10% increase in maintenance CAPEX, interest expense, and Non-Controlling Distributions.
Given the amount of conservatism built into the model, there is a fair degree of margin to ensure the distribution is safe. In fact, ET is projected to have $1.9B of discretionary funds that can be allocated to the balance sheet or acquisitions.
Under the worst-case scenario I have modeled, the company still maintains distribution coverage of approximately 1.5x. If the conservatism is removed, the coverage improves to approximately 1.65x. Both of these values are widely considered healthy for an MLP-structured business.
With 90% of ET’s expected EBITDA structured around fee-based contracts and minimal commodity exposure, I conclude there is little risk to the distribution in the foreseeable future.
Value Proposition
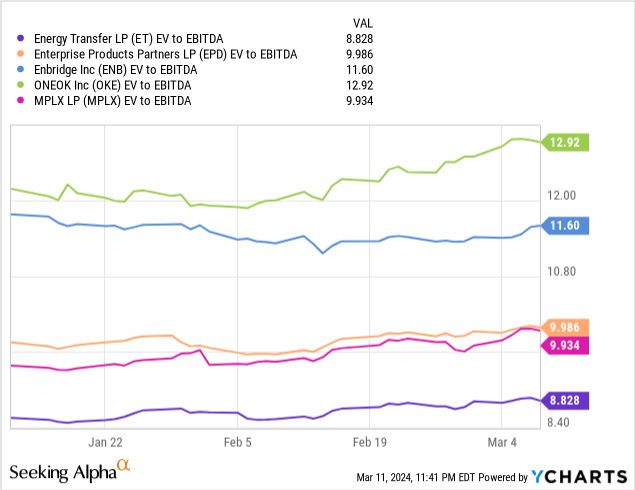
To demonstrate the value proposition of ET, I will again give a comparison to the general midstream field. Using the same peer group, it can be seen that ET trades at several multiples lower in both price to free cash flow and EV to EBITDA.
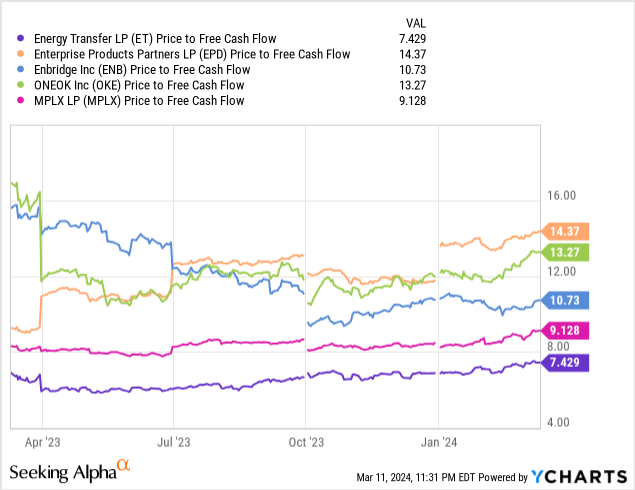
I find the EV to EBITDA metric to be the most insightful in this case. Enterprise value incorporates both market cap and the total debt on a company’s books. This metric helps to either penalize or reward a company based on its debt/cash profile. Despite the notion that ET is over-leveraged, it still scores very well. In fact, ET trades at a full multiple lower than EPD, which arguably has the best balance sheet in the industry.
Trading at a lower EV to EBITDA ratio would imply that Energy Transfer is on a slower growth trajectory or has degrading financial fundamentals. With $2.5 billion worth of projects under construction and nearly $2 billion in unallocated FCF, it is hard to subscribe to that narrative.
Instead, I subscribe to the notion that time heals all wounds. As we move further away from the distribution cut, its negative effects will gradually diminish. I believe as ET continues to rebuild its track record for EBITDA and distribution growth, the company will experience multiple expansions that will close the gap with its peers.
Experiencing one additional turn-in multiplier would yield a share price of $18.30/share at the midpoint of the projected 2024 EBITDA. This would imply a 22% upside to the current share price. I would expect this transition to be gradual, possibly taking another year to 18 months of distribution increases to fully convince investors that ET is a reliable distribution payer.
For my last point on value, I’d like to address the common misconception that the ET (or the midstream sector in general) is just a high yield or a bond substitute. As noted earlier, ET is investing approximately $2.5 billion this year in organic growth projects. This comes after $1.6 billion and $1.9 billion spent in 2023 and 2022 respectively.
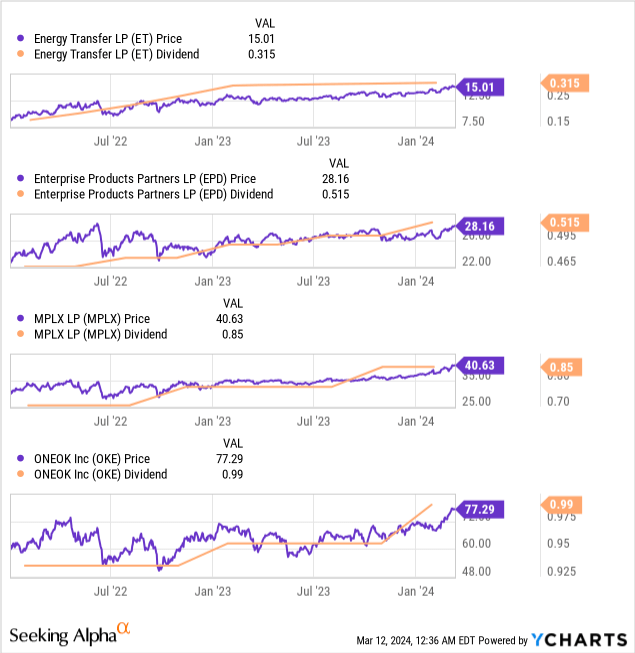
These investments are made to continue to grow the partnership and fund distribution growth. Distribution growth translates into capital appreciation as the higher yield attracts more investors. As shown below, over the last two years, the midstream space has experienced capital appreciation as the respective companies have grown the distribution.
One should expect that as long as ET is able to continue to invest in organic growth and/or acquisitions, the distribution should continue to grow. This will force capital appreciation over the long term.
Risks
In general, the midstream sector has low downside risk with the protection that is afforded by take-or-pay style contracts. However, interruptions to steady free cash production can interfere with both operational and distribution growth.
Over the next five years, ET’s annual debt maturities range from $2.5 billion to $3.6 billion. This level exceeds the amount of FCF available after the distribution and CAPEX spent to retire all of the maturing debt. Therefore, some amount of refinancing will be required.
The average interest rates on the maturing debt are in the ballpark of 5%. Given the elevated interest rate environment, replacement debt could be more expensive thus driving up interest expenses.
In its current form, interest expenses accounted for roughly 19% of ET’s 2023 EBITDA. Therefore, changes in this area can have a very measurable impact. Additional interest expenses will compress both the opportunity for distribution growth and distribution coverage.
ET Debt Maturities (ET 10-K report)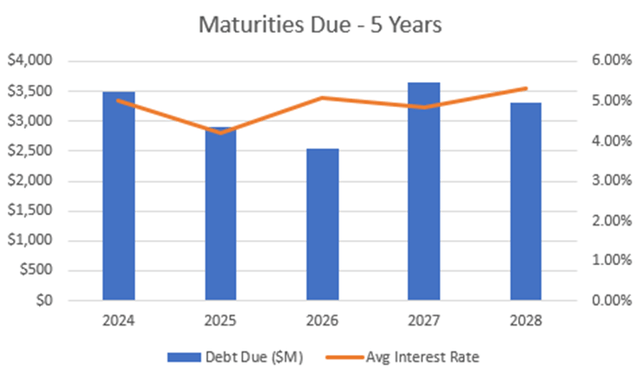
Summary
In this article, I overviewed some of the common misconceptions regarding ET as both a company and a stock. The resounding conclusion I must make is that the pessimism that surrounds ET is inappropriate, and the company’s financials are sound.
This misunderstanding of the company represents an attractive valuation for a high-yielding company. At current prices, the stock yields 8.4% and the financial model indicates ample margin exists to support distribution growth, acquisitions, and debt reduction.
As a result, I rate Energy Transfer as a BUY at the current share price of $15.01/unit as of 3/12/24.
Analyst’s Disclosure: I/we have no stock, option or similar derivative position in any of the companies mentioned, and no plans to initiate any such positions within the next 72 hours. I wrote this article myself, and it expresses my own opinions. I am not receiving compensation for it (other than from Seeking Alpha). I have no business relationship with any company whose stock is mentioned in this article.
Seeking Alpha’s Disclosure: Past performance is no guarantee of future results. No recommendation or advice is being given as to whether any investment is suitable for a particular investor. Any views or opinions expressed above may not reflect those of Seeking Alpha as a whole. Seeking Alpha is not a licensed securities dealer, broker or US investment adviser or investment bank. Our analysts are third party authors that include both professional investors and individual investors who may not be licensed or certified by any institute or regulatory body.
