Summary:
- Energy Transfer reported no improvement in earnings per share when the gain on sale is removed.
- Legal issues persist, potentially diverting future funds from shareholders to legal settlements, increasing investment risk.
- Without growth in per share income, there is a limit to cash flow, distributable cash flow, and EBITDA growth in per share terms.
- Adjusted EBITDA gains are offset by increased depreciation, interest, and tax expenses, and diluted by additional share issuances.
- The website calculates the long-term return of this business as one of the lowest compared to other competitors.
imaginima
Energy Transfer LP (NYSE:ET) reported that the latest quarter improved compared to the previous quarter in the previous fiscal year. That should be expected simply by the sheer number of acquisitions made. However, earnings per share, which is a key measure as to whether or not investors are making a decent return on investment (and related measures), are not making the expected progress that one would want to see with “accretive” acquisitions.
Legal Issues
Furthermore, the last article pointed out some legal losses that either add to or settle the rather lengthy list of cases in the annual report. The latest 10-Q adds a few minor items to the list, but basically states that not much materially has changed from the annual report filing. As someone who firmly believes that companies that hit a lot of singles and doubles are the ones most likely to hit a home run, this is absolutely the wrong area for those singles and doubles, and they are going the wrong way as well.
There is therefore a good chance that future money that could go to shareholders will instead head to legal issues. The downside to that scenario is up for discussion because many do not believe that because it (either worse or the worst) has not happened yet, it cannot happen in the future. Yet, most companies that suffer a major loss are companies with a record that indicates an increased risk of a major loss.
The management that is in place is likely trying to clean up the situation. But for investors, the extra risk is there until the cleanup occurs (and it is complete). While the company is large enough to survive many things, some downside “hiccups” are definitely a risk until this part of the 10-K heads back to something normal.
Second Quarter
The earnings benefitted from a big gain.
Energy Transfer Second Quarter 2024, Income Statement Summary And Comparison (Energy Transfer Second Quarter 2024, Earnings Press Release)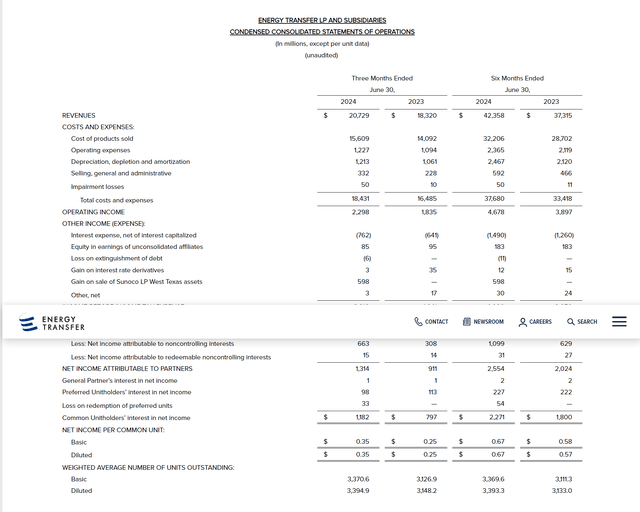
Without the gain on sale shown above, the reported net income would likely not boost per share results. It may not even match the previous quarter results, despite some acquisitions. A lot would depend upon taxes and related adjustments. That would mean per share results may well decline.
Diluted shares outstanding expanded roughly 8% using the year-to-date diluted shares outstanding. There is another roughly 50 million units issued for the latest transaction that completed in July. That means there is more dilution on the way.
Now there are a number of preferred measurements to earnings in this sector. But any of them can only grow so much if per share results do not climb over time. That likewise puts a limit on distributions which are now creeping up in the lower single digits despite the acquisitions made.
EBITDA
Here is the adjusted EBITDA calculation:
Energy Transfer Adjusted EBITDA Calculation (Energy Transfer Second Quarter 10-Q 2024)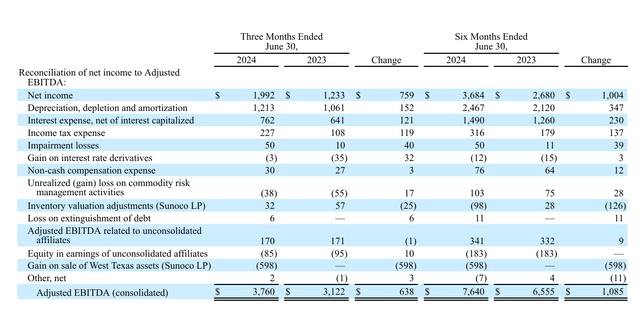
Note that major gains were made in depreciation, interest expense and income tax expense. This accounts for the lack of growth in earnings per share (at a high level). Most of the remaining gains are diluted by additional share issuances that have resulted in more shares outstanding.
The distributable cash flow only actually distributes about half of the cash calculated as available for distribution. But there is likely a reason for that conservative payout given the preferred stock outstanding and the lack of growth in both adjusted EBITDA and earnings.
Management’s View
In the quarterly presentation, here is the view of management:
Energy Transfer Management Summary Of Second Quarter 2024 Results (Energy Transfer Corporate Presentation August 2024)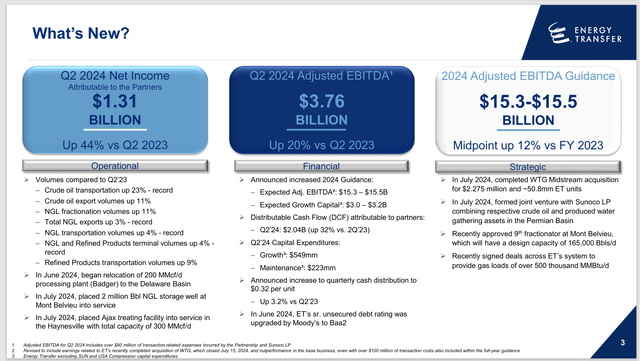
As usual, management skips the per share results as the acquisitions practically “guarantee” a darn good comparison with the previous fiscal year. There is likewise no mention of the gain on sale. Instead, the emphasis is on the overall company growth in results. But that is largely due to the acquisitions made.
The interesting part is that net income is up, largely due to the onetime gain on a sale. Management has touted the operating statistics. But with more assets thanks to acquisitions, the operating statistics had better be up. What shareholders need to ask is “where are the benefits of these acquisitions?” because right now, there does not appear to be a clear answer.
There could be a long-term benefit of a “one-stop-shop” and sometimes that is substantial. However, for the time being, there appears to be no immediate acquisition benefits.
SA Website Calculated Historical Returns
Seeking Alpha shows the returns compared to other similar sized midstream companies.
Energy Transfer Long-Term Returns Compared To Competitors (Seeking Alpha Website August 31, 2024)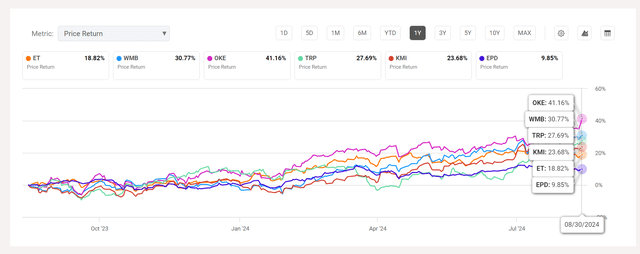
There are many choices of similar competitors that have outperformed this company. Many of those choices do not have the drama associated with a fairly lengthy list of legal actions that could prove to be relevant in the future.
Admittedly, just about any of those companies have periods of outperformance. But risk is likely less with just about any other company shown above as well.
The presentation did note that management had a debt upgrade. But there is still a significant amount of preferred stock between that upgraded debt and the common units. For common unit holders, the preferred has a superior claim to the assets and therefore, the debt ratio should include the preferred for analysis purposes. That may or may not raise the financial leverage risk to unacceptable levels. It depends upon the investor tolerance for risk.
Summary
Sometimes there is a reason for a common unit (or stock) underperformance when compared to similar competitors. Potential reasons for the “bargain” price are listed below.
Energy Transfer Key Profitability Ratios (Seeking Alpha Website August 31, 2024)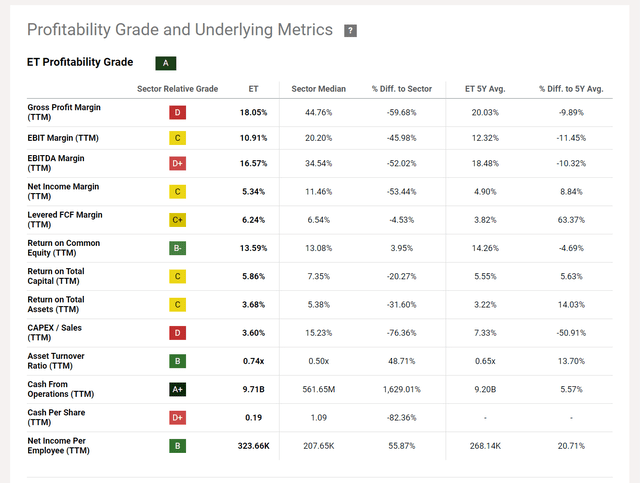
What should stand out is that the website calculates the same for every company. In that sense, the numbers are comparable. The Return On Total Assets is clearly below average. That has likewise dragged down the Return on Total Capital to below average.
Cash from operations receives a good grade. But unless an adequate profit is made on the investment, that cash calculation does not mean much all by itself (unless it is really bad).
The lack of profitability shown above combined with potential legal issues makes this an unacceptable risk for income investors. For me, this remains a sell, as the website has clearly calculated some better potential ideas that do not have all the issues that were discussed here.
Investors want above-average Return On Total Capital and above-average Return On Total Assets as a minimum for investing. Income investors do not need the lengthy description of legal issues shown in the 10-K.
Management notes that they have defenses against the issues in the 10-K, and they intend to strongly defend the company. But as I noted recently, the history of this company in court is not all that great. Recently, Energy Transfer paid The Williams Companies, Inc. (WMB) hundreds of millions for a breakup fee and subsequent court loss, plus legal expenses (the exact amount is in the 10-K). At year-end, the company still had a few hundred million more reserved.
So, while management does not know of any other issues, the recent court history may give an income investor pause. Now, traders who are experts in a situation like this could well make some money on the units. But it is a specialized situation that is probably not suitable for the average investor.
Risks
This midstream company has an unusual number of legal risks that may deter the average investor. Unlike many income issues, this one, if invested in, needs a lot of due diligence constantly. Energy Transfer management asserts that the risk of a material future loss is low to nonexistent.
Clearly, the company has survived the issues so far. But some payments, like the payment to Williams represent a lot of money. Others, like the work stoppages in the Mariner expansion project, may well be capitalized to represent a higher pipeline construction cost. These “extra costs” are often a grey area that some companies’ write-off while others capitalize. Some extra costs are definitely one thing or the other. That makes the evaluation of management extremely important.
The loss of key personnel could have a material effect on the future of the company.
The midstream business itself is known as the utility business of the oil and gas industry. The common unit price often follows the upstream stock performance, even though earnings are much less impacted by the business cycle.
Analyst’s Disclosure: I/we have no stock, option or similar derivative position in any of the companies mentioned, and no plans to initiate any such positions within the next 72 hours. I wrote this article myself, and it expresses my own opinions. I am not receiving compensation for it (other than from Seeking Alpha). I have no business relationship with any company whose stock is mentioned in this article.
Disclaimer: I am not an investment advisor, and this article is not meant to be a recommendation for the purchase or sale of stock. Investors are advised to review all company documents and press releases to see if the company fits its own investment qualifications.
Seeking Alpha’s Disclosure: Past performance is no guarantee of future results. No recommendation or advice is being given as to whether any investment is suitable for a particular investor. Any views or opinions expressed above may not reflect those of Seeking Alpha as a whole. Seeking Alpha is not a licensed securities dealer, broker or US investment adviser or investment bank. Our analysts are third party authors that include both professional investors and individual investors who may not be licensed or certified by any institute or regulatory body.
I analyze oil and gas companies and related companies like Energy Transfer in my service, Oil & Gas Value Research, where I look for undervalued names in the oil and gas space. I break down everything you need to know about these companies — the balance sheet, competitive position and development prospects. This article is an example of what I do. But for Oil & Gas Value Research members, they get it first and they get analysis on some companies that is not published on the free site. Interested? Sign up here for a free two-week trial.
