Summary:
- Energy Transfer common units remain a sound long-term investment due to consistently outstanding free cash flow, significant value creation by management, and relatively low valuation.
- Key metrics to evaluate Energy Transfer’s performance include free cash flow yield, return-on-invested capital, and enterprise value-to-EBITDA valuation.
- In this article, I offer investors a 1Q2024 update on key financial and valuation metrics. These may provide you with a solid springboard for future common unit evaluation and monitoring.
onurdongel
For over a dozen years, I’ve written you about Energy Transfer (NYSE:ET) units. My primary objective has to provide objective, actionable investment information about the company.
Investment Thesis
At the current juncture, Energy Transfer common units remain a sound, long-term investment. Here are three bullet points supporting the view:
-
The business generates consistently outstanding free cash flow
-
Management is creating significant unitholder value
-
The common units remain relatively inexpensive
How Can We Measure This?
Broadly, when evaluating an investment, I seek to separate the significant few from the insignificant many. In other words, there are lots of things an investor may choose to track and review; however, it is important to try to figure out what’s creates insight and “moves the needle.”
Measure what matters.
In addition, it’s important for investors to recognize that, over time, such key metrics may change. As the business changes, the important operational and financial measurements may change, too.
For Energy Transfer, I routinely review multiple metrics. Currently, I believe evaluating the following provide superior insight:
-
Free cash flow yield
-
ROIC (return-on-invested-capital), calculated using DCF (distributable cash flow)
-
Enterprise Value-to-EBITDA valuation
I encourage investors to look at these measures as a function Energy Transfer’s peers.
ET has a number of good peers. These should be large cap, diversified energy transportation companies. The following are a good start for a sound comparative basis:
-
Enterprise Products Partners (EPD)
-
MPLX (MPLX)
-
Kinder Morgan (KMI)
-
Plains All America Pipeline (PAA)
OK….let’s look at Energy Transfer’s performance / valuation through 1Q2024.
Note to readers: unless referenced otherwise, core data for the following sections has been sourced through company investor websites and SEC filings. Most calculations performed by the author.
Free Cash Flow Yield
In my last article entitled, “Energy Transfer: Tale of the Tape Yields Surprising Results,” I pointed out the company generates prolific cash flow versus peers. For 2023, Energy Transfer lead the pack re free cash flow remaining after unitholder cash distributions.
I believe one good way to trend free cash flow is to monitor free cash flow yield. Free cash flow yield may be measured by dividing TTM free cash flow by market capitalization. Free cash flow is defined as GAAP operating cash flow less capital expenditures.
The following table highlights Energy Transfer and peers’ FCF Yield through 1Q2024:
Free Cash Flow Yield (trailing twelve months) – Energy Transfer and Peers
|
Market Cap – $B |
FCF -$B |
FCF Yield % |
|
|
Energy Transfer |
51.8 |
6.91 |
13.3 |
|
Enterprise Products |
61.3 |
4.42 |
7.2 |
|
MPLX |
41.1 |
4.13 |
10.0 |
|
Kinder Morgan |
43.3 |
3.92 |
9.1 |
|
Plains All America |
11.7 |
1.74 |
14.9 |
Discussion
Energy Transfer and Plains lead. Enterprise Products lags. These data points may also be viewed with an eye on valuation; the more richly valued equities tend to have lower FCF yields.
Energy Transfer investors may note the ET figures may be adjusted. Energy Transfer financial statements fully consolidate Sunoco LP (SUN), USA Compression (USAC) and the Dakota Access Pipeline (DAPL) even though these are independent entities. Therefore, Energy Transfer’s GAAP operating cash flow receives an uplift from the consolidation but so do capital expenditures. When I created this table, I did not attempt to de-consolidate these subsidiaries.
Return-on-Invested-Capital
I determine RoIC using a “kitchen sink” approach. Effectively, I consider invested capital to be equity, long term debt, operating leases, goodwill, intangible assets, investments in affiliates, and non-controlling interests; effectively, most everything except balance sheet cash. My formula for doing so is simply,
Total Assets minus Current Liabilities minus Cash
For the numerator, in particular for energy transportation cos like ET, I believe utilizing Distributable Cash Flow paints a better picture than the more traditional EBIT or NOPAT.
Why?
Given energy companies’ various non-cash, one-off accounting, and routine maintenance capital requirements, DCF is a superior metric. Indeed, I would go so far as to say that using EBIT or NOPAT suggests the user is relying too heavily upon classroom return calculations perhaps without a full understanding about how energy transportation companies make money.
Using DCF in the numerator of the RoIC equation is a permutation of CFROIC: cash flow return-on-invested-capital.
Nonetheless, for Energy Transfer, we have to dig even a little deeper.
As referenced in the preceding section, ET fully consolidates Sunoco LP, USA Compression, and DAPL on its financial statements. While DCF adjusts out the cash flow generated by these subsidiaries and replaces it with actual cash distributions received by Energy Transfer, the balance sheet reflects all the debt from these companies.
Therefore, to create a fair RoIC representation, the Sunoco and USAC off-balance sheet debt should be excluded from the calculation. DAPL debt may be adjusted to reflect only the pro rate portion attributable to Energy Transfer’s 36.4 percent DAPL ownership.
Doing so reduces ET March 31, 2024 balance sheet Invested Capital by $7.49 billion.
The peer group’s comparable consolidated subsidiary debt is immaterial.
Going a step further, RoIC is best evaluated alongside WACC (weighted average cost of capital). WACC considers the calculated cost of debt and equity for a specific enterprise.
In a nutshell, if a company’s RoIC is greater than its WACC, the management team is creating value. If the WACC is greater than the RoIC, the management team is destroying value.
Here’s the TTM RoIC results for Energy Transfer and peers:
Return-on-Invested Capital TTM – Energy Transfer and Peers
|
RoIC % |
WACC % |
|
|
Energy Transfer |
8.5 |
6.3 |
|
Enterprise Products |
13.0 |
6.7 |
|
MPLX |
16.0 |
6.5 |
|
Kinder Morgan |
7.2 |
6.9 |
|
Plains All America |
9.1 |
6.5 |
Note: WACC figures were sourced via GuruFocus | Stock Market Research, Data and Tools. This website updates its figures daily and the reader is provided with all underlying calculations. The author calculated RoIC.
Discussion
Energy Transfer and Kinder Morgan lag. MPLX and Enterprise Products lead. However, when compared with associated WACC all the management teams are creating value.
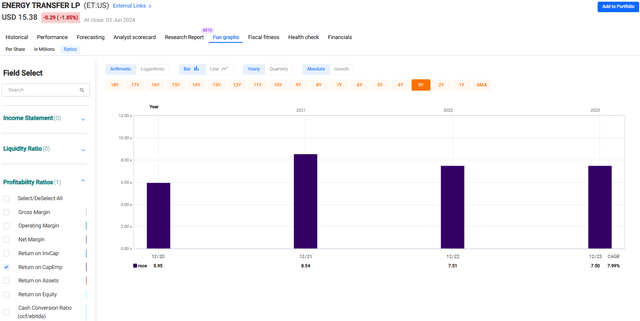
Furthermore, if one does a lookback on Energy Transfer, it appears RoIC is improving.
If management makes good on their 2024 adjusted EBITDA guidance ($15.0 to $15.3 billion) versus 2023 actual ($13.7 billion), by year-end ET investors will enjoy a new RoIC high-water mark.
Despite the positive trend, Energy Transfer continues to lag the peer average. So long as it does, I believe a combination of entity complexity and weaker RoIC is likely to keep a lid on valuation. We will discuss this in the next section.
Enterprise Value-to-EBITDA Valuation
There are many ways to estimate equity valuation. As a rule, I like to utilize several approaches, as appropriate, to get to a Fair Value Estimate. Fair Value is an indifference point: it means an investor is indifferent to accumulating or distributing units or shares.
However, if I had to pick one valuation metrics for energy transportation compaines, I would elect to use EV / EBITDA.
Why?
EV / EBITDA considers entity capitalization including debt, preferred stock, non-controlling interests and balance sheet cash with a cash flow proxy profitability proxy.
Enterprise Value, combining both equity and debt, may be considered capital structure neutral. EBITDA highlights cash earnings sans accrual accounting and cancels tax-jurisdiction effects. Adjusted EBITDA is driven by the business operations of the company.
The table below highlights 2020-to-2024 EV / EBITDA averages for Energy Transfer and peers.
EV / EBITDA (4-year average) – Energy Transfer and Peers
|
EV / EBITDA |
|
|
Energy Transfer |
8.3x |
|
Enterprise Products |
9.9x |
|
MPLX |
9.9x |
|
Kinder Morgan |
11.0x |
|
Plains All America |
9.4x |
Note: EV / EBITDA inputs to determine averages sourced via FAST Graphs.
Discussion
Immediately evident is Energy Transfer’s EV / EBITDA ratio is materially lower than peers. The peer group is fairly tightly grouped and ET is the outlier. I believe this stems from a combination of factors.
First, as noted earlier, Energy Transfer’s company structure is more complicated and continuously changing. Generally, investors dislike complexity.
Second, Energy Transfer’s management was saddled with a “cowboy” label. The higher-risk, slug-it-out mentality reduced some investors’ appetite for an income investment. Notably, however, in recent years the risk profile for ET has changed significantly; however, the Street perceptions turn slowly.
Third, I contend lower capital returns place downward pressure on valuation multiples. While improving, Energy Transfer management’s RoIC results remain lower-end.
Therefore, I believe not more than an 8.5x EV / EBITDA multiple is reasonable and appropriate. That ratio is just a bit higher than the ET four-year average and remains lower than the peer average.
Despite the lower valuation multiple, the common units still appear inexpensive. After running the numbers using 1Q2024 general inputs, management’s 2024 adjusted EBITDA midpoint, then solving for share price, the bottom line is a ~$20 FVE.
Summary
Energy Transfer continues to generate excellent free cash flow and DCF. The year-end 2023 $7.1 billion Crestwood bolt-on acquisition is expected to be immediately accretive, spurring continued bottom-line growth and integration opportunities.
Investors seeking to monitor ET performance may find the following key metrics a good place to start: free cash flow yield, return-on-invested capital, and EV / EBITDA valuation. Following is a quick take on the current state:
-
Energy Transfer free cash flow yield is excellent versus peers or on an absolute basis.
-
RoIC is lower than most peers, but when compared to WACC, management continues to create unitholder value.
-
Despite strong unit price performance, Energy Transfer units remain an attractive investment. When evaluated using a conservative 8.5x EV / EBITDA multiple and estimated 2024 inputs, my current FVE is ~$20.
As always, all relevant comments and questions are welcomed in the reader comment section below.
Please do your own careful due diligence before making any investment decision. This article is not a recommendation to buy or sell any equity. Good luck with all your 2024 investments.
Analyst’s Disclosure: I/we have a beneficial long position in the shares of ET either through stock ownership, options, or other derivatives. I wrote this article myself, and it expresses my own opinions. I am not receiving compensation for it (other than from Seeking Alpha). I have no business relationship with any company whose stock is mentioned in this article.
Seeking Alpha’s Disclosure: Past performance is no guarantee of future results. No recommendation or advice is being given as to whether any investment is suitable for a particular investor. Any views or opinions expressed above may not reflect those of Seeking Alpha as a whole. Seeking Alpha is not a licensed securities dealer, broker or US investment adviser or investment bank. Our analysts are third party authors that include both professional investors and individual investors who may not be licensed or certified by any institute or regulatory body.

