Summary:
- Exxon Mobil’s charts have shown that there is significant resistance overhead, limiting its upside potential.
- Moving averages reflect an uptrend that is weakening as bullish momentum wanes.
- Key indicators show negative divergence, flashing red flags that the bull run could be on it final legs.
- Exxon Mobil is overvalued relative to its growth as valuation multiples surge despite sluggish growth.
- Its stock is a strong sell as technical and fundamental signals point to a very weak outlook.

Thesis
Oil giant Exxon Mobil Corporation (NYSE:XOM) has been on a recent surge, with the stock hitting record highs. However, beneath the surface, a storm is brewing as technical signals converge to the conclusion that Exxon Mobil’s bull run may be on it final legs. In addition, a look at the fundamentals shows that Exxon Mobil is becoming increasingly expensive as its growth fails to justify its premium valuation. Lastly, the economic uncertainties in the U.S. and the disappointing updates on China’s stimulus further dims the outlook for its stock. Therefore, I initiate Exxon Mobil at a strong sell rating.
Daily Analysis
Chart Analysis
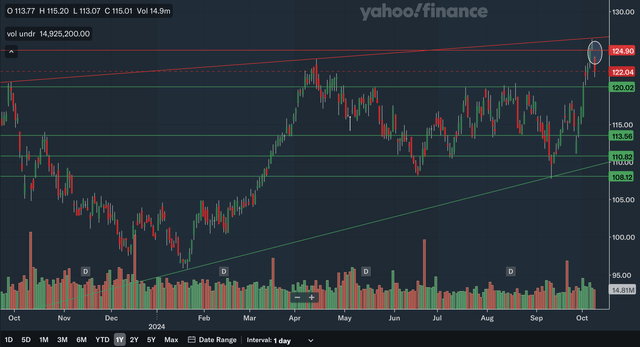
A look at Exxon Mobil’s daily chart shows that there is a significant resistance level nearby but also support beneath its stock. The nearest resistance would be the gap that I have circled at around 125. The next level of resistance would be the upper channel line that Exxon Mobil recently bounced off of and has been hit 3 times in the past year in total. As for support, the nearest level would be at 120 since that zone has been resistance six times in the past year, showing it is an important level. We also have quite a bit of support in the high 100s to low 110s zone, as that zone has been support/resistance a total of 9 times this past year, showing it is highly significant. There is also the lower channel line that is at around 110 and rising. Overall, I believe this shows that Exxon Mobil has support in the short term but also a bit of resistance, limiting its near term upside potential.
Moving Average Analysis
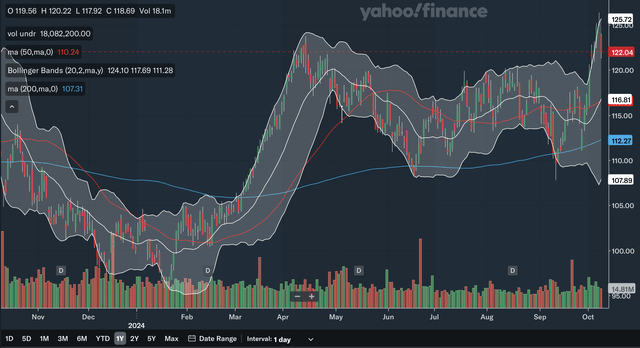
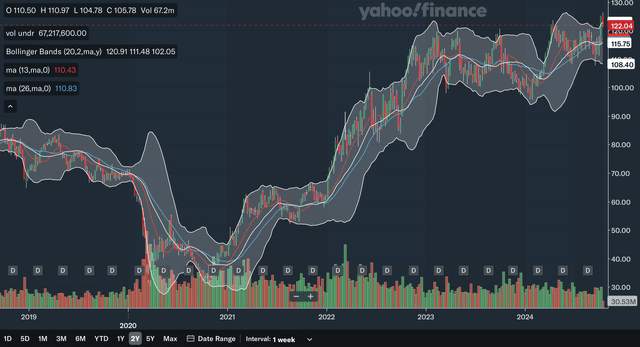
The 50-day SMA and 200 day SMA had a golden cross in early April of this year, and the stock surged as a result. Currently, the 50-day SMA remains above the 200-day SMA, but the gap has narrowed since late May, showing that bullish momentum is waning. The stock is currently trading above both moving averages. As for the Bollinger Bands, the stock recently bounced off the upper band, showing a correction after being overbought. Lastly, the Bollinger Band’s 20-day mid-line is at 116 and rising and will also provide support in this uptrend. From this analysis, in my view, the uptrend for Exxon Mobil is continuing, but the narrowing of the moving averages shows that the uptrend continues to weaken, and the stock could be in for a pullback soon.
Indicator Analysis
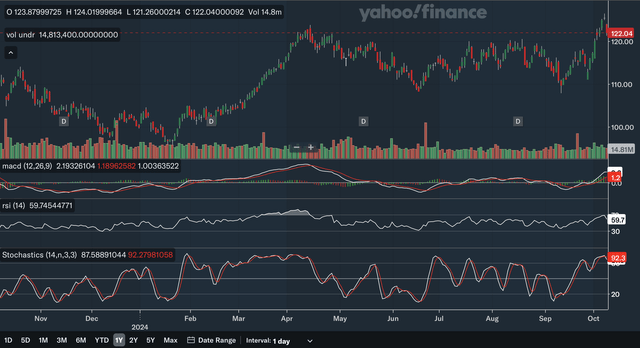
The MACD is currently a healthy margin above the signal line, showing that there is near term bullish momentum for Exxon Mobil. The MACD line broke above the signal line in September and the stock has surged since. There is negative divergence with the MACD as it recorded a higher figure during the April peak than the latest peak. This could be a potentially bearish signal. For the RSI, there is also some worrying divergence, as it hit levels above 70 during the April peak but was below 70 during the latest peak. This is another potential red flag for Exxon Mobil. Lastly, for the stochastics, the %K line just broke below the %D line very recently within the 80 overbought zone, flashing a bearish signal. Overall, the daily indicators show a negative short-term technical outlook for Exxon Mobil as the two divergence signals are causes for concern.
Daily Analysis Takeaway
Overall, I believe it is a net negative outlook for Exxon Mobil in the near term. The charts show that there is support underneath the stock but also some nearby resistance. The moving averages show the uptrend is weakening, and the stock has been recently overbought. Lastly, the indicator analysis was net negative, with the current positive MACD signal being contrasted with worrying signs of negative divergence. From my analysis, the short-term outlook for Exxon Mobil is worrying.
Weekly Analysis
Chart Analysis
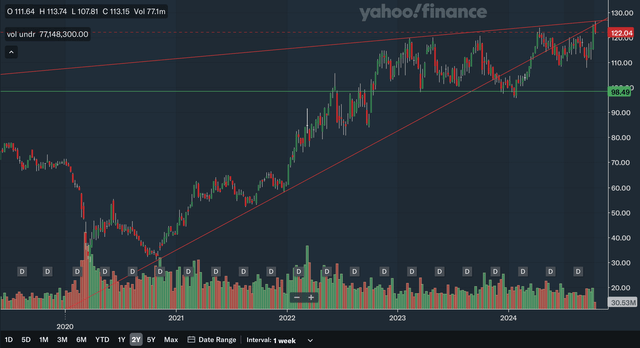
The weekly charts show that there is nearby intermediate term resistance. The upper channel line drawn in the daily analysis is shown here to extend back into early 2023, further proving its significance. Exxon Mobil could have a hard time breaking out from this level, as the recent pullback is a bounce off of this level. There is also an intermediate term uptrend line that was broken in late 2023, but was highly significant before that. Since support becomes resistance once broken, this line could be a source of resistance in the future. The zone of support I identified is in the high 90s, as this level has been both support and resistance all the way back in 2022. The stock has bounced off this level 5 times between 2022 and 2024, showing its significance. Overall, I believe it is clear that Exxon Mobil’s intermediate-term upside is quite limited, as resistance is proving to be a weight on its stock.
Moving Average Analysis
The 13-week SMA and the 26-week SMA recently had two crossovers. The first one is a bearish crossover after months of the 13-week SMA being above the 26-week SMA. The latest crossover is the 13-week SMA regaining above the 26-week SMA. This shows that the stock is quite indecisive in the intermediate term, as there is no sustained trend in either direction currently. The stock is trading above both of the moving averages. For the Bollinger Bands, Exxon Mobil is still currently at the upper limit, showing that it is overbought and could be subject to a further pullback. The 20 week mid-line is below both of the SMAs but should provide support. Overall, in my view, the moving averages paint an uncertain outlook for Exxon Mobil as the multiple crossovers show indecisiveness and the Bollinger Bands show the stock continues to be overbought in the intermediate term.
Indicator Analysis
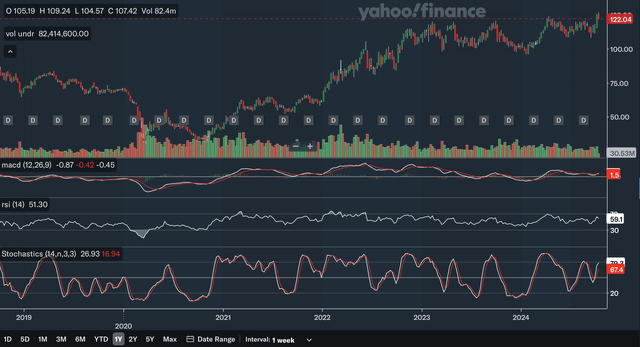
Currently, the MACD line is above the signal line, which is a positive signal. However, the more important signal is the negative divergence, similar to the daily analysis. The current MACD is at very low levels compared to the highs seen in 2021 to 2023, while the stock is higher than back then. This is a large divergence and is a major red flag. For the RSI, it is a similar story. While the stock is at a new high currently, the RSI only sits at around 60, below the highs of 2021 to 2022. These two divergence signals taken together may potentially indicate this bull run is on its final legs. Lastly, for the stochastics, the %K is above the %D and widening the gap, reflecting the near-term upward momentum of the stock. However, the stochastics also shows some divergence, as the recent peak in the stock is met with a relatively low stochastics reading. In my opinion, the weekly indicators show an ominous outlook for Exxon Mobil as all three key indicators show significant negative divergence.
Weekly Analysis Takeaway
I believe the technical outlook for Exxon Mobil is net negative in the intermediate term. The charts show limited upside as there is strong resistance overhead, while the moving averages show indecisiveness of investors. Lastly, the indicators show a concerning outlook, as the divergences are red flags. From my analysis, Exxon Mobil’s intermediate term bull run could be at risk of coming to an end.
Monthly Analysis
Chart Analysis
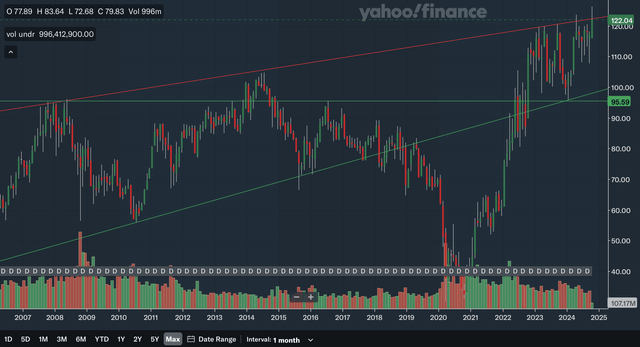
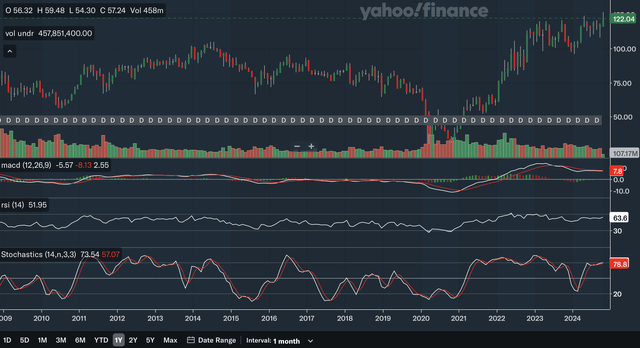
A look at the long-term chart shows that Exxon Mobil’s stock is right at very significant resistance. This is an upper channel line that stretches back into 2007 and been touched in 2014, 2023, and 2024. This line seems to be almost impenetrable, as shown by the long candlestick wicks when the stock nears the line. The closest support level is a lower channel line that stretches back to 2010. Although the line was broken in 2018, the stock regained this line in 2022, and it acted as strong support earlier this year. The other support level identified is in the mid-90s, as it was resistance in 2008 and 2016, and support earlier this year. Both of these longer-term support levels are quite far down. Overall, I believe the monthly charts show that Exxon Mobil has limited upside potential, as there is decades-long resistance weighing on the stock.
Moving Average Analysis
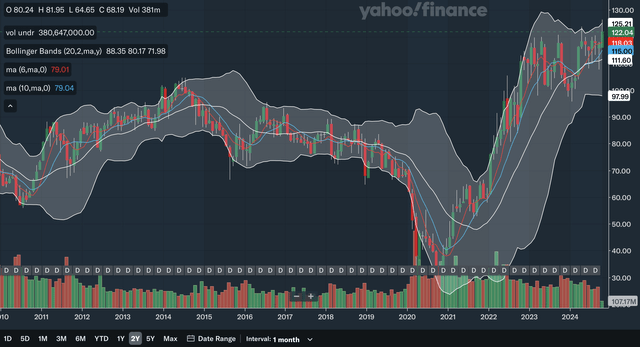
The 6-month SMA and the 10-month SMA had a bullish crossover earlier this year, showing a bullish signal. The two SMA previously had bearish crossover in mid-2023. The gap between the two has been narrowing as of late, perhaps showing a weakening in the bullish momentum. The stock could find support at these SMAs as it is only trading slightly above them. The stock is currently nearing the upper band of the Bollinger Bands. In fact, the candlestick wick for this month touched the upper band, showing it was overbought and also that this line is significant resistance. The 20-month mid-line is below the two SMAs but should also provide support. In my view, the longer-term moving averages show that Exxon Mobil is in a relatively weaker uptrend as the moving average crossed over two times in the past year and a half and the gap between them is currently narrowing, showing slowing momentum.
Indicator Analysis
Currently, the MACD is below the signal line, which is a bearish signal. It also shows the negative divergence, like in the weekly analysis, as the longer term MACD is currently lower than levels seen in early 2023. For the RSI, there continues to be negative divergence. This stock is at all-time highs, but the RSI fails to confirm as there were higher readings, in 2011, 2013, 2022, and 2023. This is a major long-term red flag for Exxon Mobil. Lastly, the stochastics %K line is above the %D line which is a bullish indication. But again, the stochastics show the negative divergence, as the current reading is well below peaks in the past decade. Overall, I believe the long-term divergence of these three key indicators should be highly concerning to investors, as the long term bull run is showing signs of nearing a top.
Monthly Analysis Takeaway
I believe the long-term technical outlook for Exxon Mobil is net negative. The charts show that Exxon Mobil is right at a very long-term resistance level and that could limit further upside, while the moving averages show a relatively weak uptrend. Lastly, the indicators show worrying signs, as the negative divergence of the indicators converges to the conclusion that the bull run is unsustainable.
Fundamentals & Valuation
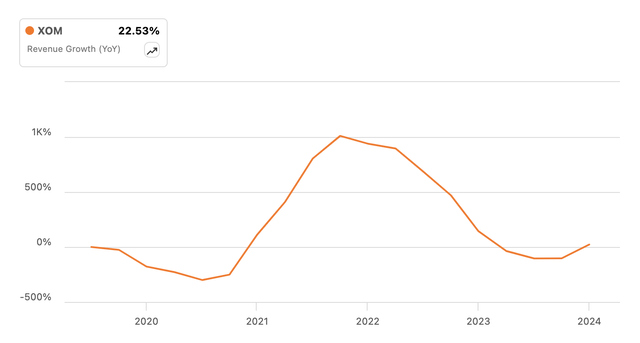
Exxon Mobil reported satisfactory Q2 earnings back in August. They reported $93.06 billion in revenue, beating expectations by $3.38 billion. However, as you can see in the above chart, revenue growth remains at low levels compared to recent years. They also reported an adjusted EPS of $2.14, representing an increase of 12.24% YoY. Other highlights in their earnings include $10.6 billion in operating cash flows, and 15% QoQ growth in their production, as there were record levels of production from heritage Permian, Guyana, and Pioneer. They also had combined share repurchases and dividends of $9.5 billion. The current yield of Exxon Mobil is 3.11%.
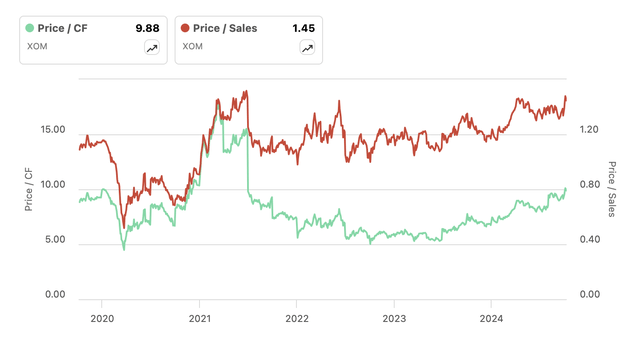
The P/S ratio is near five-year highs, while the P/CF ratio has rebounded significantly from the lows seen in 2022 and 2023. The P/S ratio is currently at around 1.5 much higher than the levels of around 1.0 seen in 2022. The P/CF ratio is currently close to 10 and has doubled from the 2022 lows. These valuation multiples have surged in the past couple of years, to say the least. Meanwhile, Exxon Mobil’s revenue growth is at very modest levels compared to the past few years. Its revenue growth is significantly lower than the strong growth seen in 2021 and 2022. Although it seems that revenue growth may have hit a low and is starting to rebound, there is no guarantee that growth can recover quickly as a soft landing in the U.S. economy is still uncertain, China’s stimulus effects are still uncertain, and the trajectory of the wars in Ukraine and the Middle East is still unknown.
Some economists and financial leaders still believe there is a risk of a slowing in the economy in the U.S. As for China’s stimulus, after initial reports of a ‘Bazooka’, the latest updates disappointed investors, with stocks in Hong Kong plunging as a result. Therefore, I believe Exxon Mobil is currently moderately overvalued when evaluating its growth and the geopolitical and macro environment. Its valuation multiples have rebounded from depressed levels, while growth remains low. Currently, Seeking Alpha has a D+ valuation rating on Exxon Mobil, confirming my analysis that it is indeed currently overvalued.
Conclusion
All is not well with Exxon Mobil stock. On the surface, Exxon Mobil just recently hit an all-time high. But when you dig deeper, there is a major storm brewing underneath the surface and it could get ugly. The technical analysis has generally shown that Exxon Mobil has limited upside as significant resistance hangs on top, its uptrend is weakening, and the top may be in as negative divergence signals flash in all time frames. In addition, as discussed above, Exxon Mobil is overvalued when its growth is evaluated. With continued geopolitical and macro uncertainties, I believe the current setup does not provide a good risk-reward for investors. The convergence of technical and fundamental signals paints a stormy outlook for Exxon Mobil stock and therefore, I initiate it at a strong sell rating.
Analyst’s Disclosure: I/we have no stock, option or similar derivative position in any of the companies mentioned, and no plans to initiate any such positions within the next 72 hours. I wrote this article myself, and it expresses my own opinions. I am not receiving compensation for it (other than from Seeking Alpha). I have no business relationship with any company whose stock is mentioned in this article.
Seeking Alpha’s Disclosure: Past performance is no guarantee of future results. No recommendation or advice is being given as to whether any investment is suitable for a particular investor. Any views or opinions expressed above may not reflect those of Seeking Alpha as a whole. Seeking Alpha is not a licensed securities dealer, broker or US investment adviser or investment bank. Our analysts are third party authors that include both professional investors and individual investors who may not be licensed or certified by any institute or regulatory body.

