Summary:
- I am overall bullish on the energy sector given the currently compressed oil prices, and sector leader XOM is particularly attractive.
- Compared to close peer OXY and the overall sector, XOM offers better profitability metrics and balance sheet strength.
- Yet, Exxon Mobil trades at a lower valuation than Occidental.
- Both enjoy growth catalysts with their expanded exposure to the prized Permian Basin assets.
- However, XOM’s greater capital allocation flexibility and better ROCE enhances its ability to capitalize on growth initiatives.

-Antonio-
XOM and OXY: previous thesis and new developments
My last analysis on Exxon Mobil stock (NYSE:XOM) was titled “Exxon Mobil: Bridgewater Added Energy Shares And So Did I”. As hinted in the title, the article analyzed XOM following the perspective of Ray Dalio’s 4-asset model. I argued why XOM is an attractive option under current conditions for commodity exposure under Dalio’s model. Quote:
XOM’s profit displays strong correlations with natural gas and oil prices. In addition, XOM shares offer a discounted valuation due to recent price corrections. Finally, in contrast to commodity’s notorious price volatilities, XOM enjoys a much more stable earnings growth.
Since that writing, some new catalysts have been evolving to a degree that motivates a reexamination of the stock. Some of these catalysts have an impact on the energy sector as a whole, as represented by the Energy Select Sector SPDR® Fund ETF (XLE), and some of them impact XOM only. And my conclusion is that XOM remains a compelling investment opportunity amid a very elevated overall market and a multitude of macroeconomic uncertainties. I will explain why XOM offers an attractive combination of value, growth, and financial strength, thus leading to a reiteration of my BUY rating.
To accentuate the above attractiveness, I will perform my analysis in a comparative manner by contrasting XOM to another oil major player, Occidental Petroleum Corporation (NYSE:OXY). This comparison is motivated mainly by two factors. First, both XOM and OXY are some of the country’s (or even the world’s) most established oil and gas producers. Secondly, both companies have large footprints in the prized Permian Basin. Both companies have made sizable acquisitions in this lucrative basin, and I will elaborate on this issue more later.
As a last piece of background before diving in, I last covered OXY back in June with a focus on Berkshire’s transactions, as you can also guess from the title of the article “Occidental Petroleum: Berkshire Could Buy More And You Should, Too”. In this article, I will examine the developments surrounding OXY too since that writing. You will see that this reexamination, tighter with the comparison against XOM, resulted in a downgrade of my rating to HOLD from the earlier buy rating.
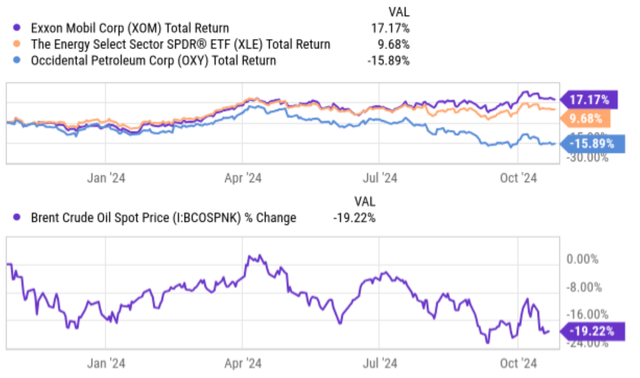
To start, let’s look at the common factor that has impacted both stocks and also the energy sector lately: the change in oil prices. As you can see from the chart below, oil prices, as represented by the Brent Crude Oil Spot Price (BCOSPNK), have been under pressure lately. To wit, Brent Spot Price has declined almost by 20% in the past 12 months, currently hovering around $68 only as of this writing. The decline in oil prices has translated into large profit headwinds and also stock price pressures for both XOM, OXY, and the sector as a whole, although the pressures were distributed unevenly. As an example, XLE lagged the overall market drastically but managed to gain moderately with a total return of 9.6%. In contrast, OXY has suffered a total loss of more than 15% and XOM has enjoyed a robust gain of over 17%.
My overall view is that oil prices cannot stay compressed at the current level for too long for reasons detailed in my earlier writings (such as inflation, geopolitical instability, structural supply-demand imbalance, etc.). I anticipate a recovery in oil prices and a recovery would benefit both XOM and OXY. However, next, I will explain why a potential recovery will likely benefit XOM more than OXY, thus the above performance divergence between these two stocks is likely to persist.
Seeking Alpha
OXY and XOM: profitability comparison
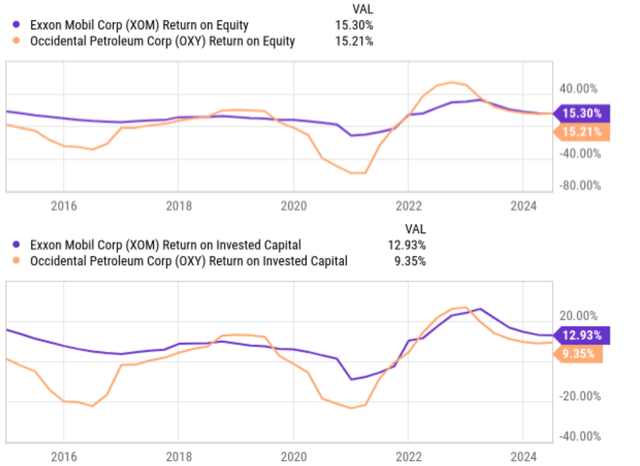
Many investors like to use profitability metrics like margins, Return on Equity (ROE), Return on Asset (ROA), etc. These metrics have their merits and suggest that XOM and OXY have similar levels of profitability. As an example, the chart below shows that XOM’s current ROE is around 15.30%, on par with OXY’s ROE of 15.21%. However, these metrics can be misleading for reasons detailed in our earlier writings. For example, equity could include idle cash and thus underestimate the ROE, which is of particular relevance for this article as we will see a bit later.
For these reasons, I prefer the use of profitability metrics such as ROIC (return on invested capital) or ROCE (return on capital employed). These metrics consider the return on capital (or assets) that are actually employed in the business operation, and you can see from the bottom panel of the chart below, XOM’s current and historical ROIC has been noticeably better than those of OXY.
Seeking Alpha
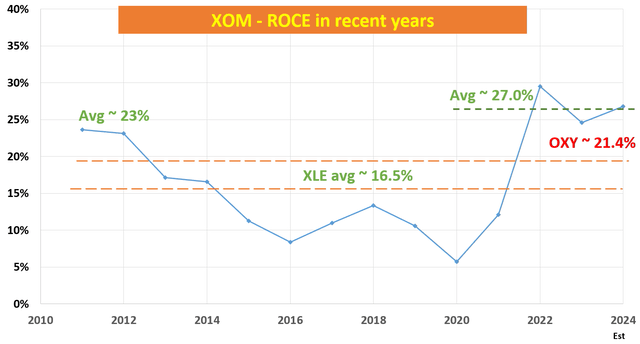
My own analyses of XOM’s and OXY’s ROCE are shown in the chart below. My method for calculating ROCE was detailed in the article quoted above and I will only quote the end results below:
For businesses like XOM and OXY, I consider the following items of capital actually employed in their profit-making: 1) Working capital, including payables, receivables, and inventory, 2) Gross Property, Plant, and Equipment, and 3) Research and development expenses (a relatively minor part for both companies) are also amortized and considered part of its capital employed.
Under these considerations, XOM’s ROCE is on average 27% in the recent 3 years, vs. OXY’s 21.4%. Also, note that both XOM and OXY’s average ROCE is better than the sector average of 16.5% as approximated by XLE’s return on equity.
Seeking Alpha
OXY and XOM: valuation comparison
XOM is not only more profitable but also cheaper. As you can see from the chart below, the forward P/E ratio based on its FY 2024 EPS is estimated to be 14.81. As its EPS is projected to recover in FY 2024 and grow in the next few years, the P/E ratio is expected to further decline. For instance, the forward P/E ratio for FY 2025 is estimated to be 14.31 and 12.34 for FY 2026. In comparison, the forward P/E ratio for OXY is about 15.94 based on its FY 2024 EPS projection, noticeably above XOM’s 14.81. Looking further out, OXY’s P/E ratio is expected to decline as well, thanks to its EPS growth to be similar to XOM’s in FY 2025 and 2026.
I indeed see strong growth catalysts for both companies. However, I am more optimistic about XOM’s growth perspective given its business fundamentals and also capital allocation flexibility, as elaborated on next.

Source: EPS consensus estimates for XOM

Source: EPS consensus estimates for OXY
Other risks and final thoughts
As mentioned earlier, a key reason I chose to compare XOM and OXY is that both companies have large footprints in the prized Permian Basin. Indeed, a top growth catalyst on my list for both companies involves their recent acquisitions to further expand their footprint in this lucrative basin.
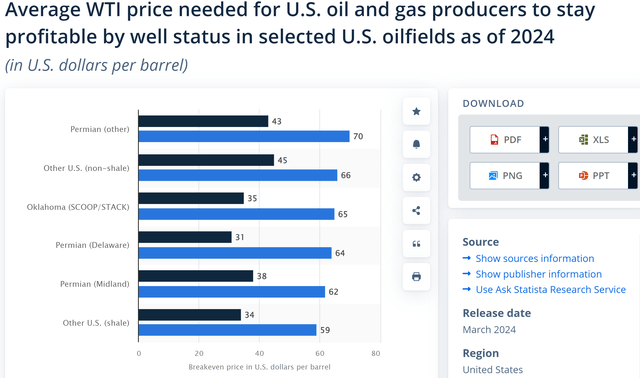
For XOM, it recently closed the purchase of Pioneer Natural Resources. This purchase has already begun to bear fruit on both the top and bottom lines judging by its latest quarterly earnings, as reflected in the record production levels across the Permian area. Together with the ramp-up in Guyana operations, I expected a solid growth trajectory in the next few years. For OXY, it has recently bought CrownRock L.P., also an oil and gas producer based in the Permian Basin. This deal augments OXY’s operation considerably. My estimate for the total price tag for this deal is around $12.5 billion (vs. OXY’s current market cap of around $48B) consisting of about $9.4 billion of cash, the assumption of $1.2 billion of CrownRock’s debt, and about 30 million OXY common shares. To better contextualize the above acquisitions, the Permian basin assets boast some of the most attractive production costs (at least in the U.S.) as you can see from the chart below.
Statista
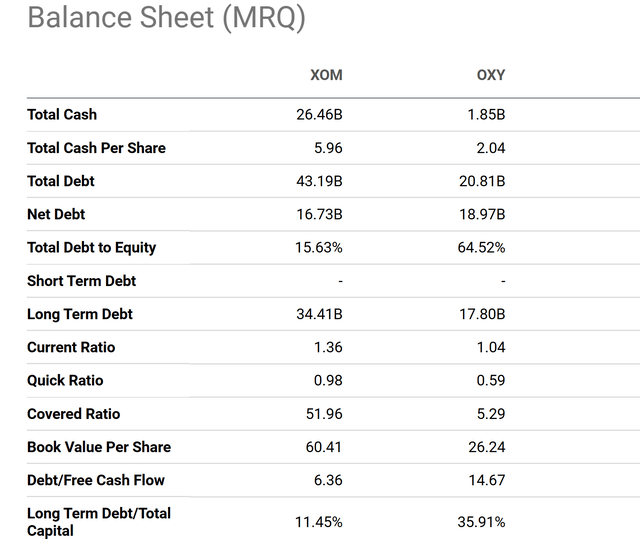
However, I see XOM as better positioned for growth than OXY going forward for at least two reasons. The first one was XOM’s better ROIC and better ROCE as discussed earlier. With a higher ROIC or ROCE, each dollar invested in growth CAPEX tends to lead to higher EPS increases. Second, XOM is also in a better financial position to invest more sustainably and aggressively toward growth than OXY. As you can see from the following chart comparing XOM and OXY stock’s balance sheet data, XOM possesses a significantly larger cash position, holding $26.46 billion compared to OXY’s $1.85 billion.
In the meantime, XOM’s debt levels are also substantially lower than OXY’s when normalized by their earnings. In absolute dollar amounts, XOM’s total debt stands at $43.19 billion, while OXY’s debt burden is $20.81 billion. When normalized by equity, XOM’s debt translates to a much lower debt-to-equity ratio (15.63%) compared to OXY (64.52%). When normalized by free cash flow, XOM’s debt translates to about 6.3 years’ worth of its FCF compared to over 14 years for OXY as seen. The substantially higher cash reserve and lower debt burn provide XOM with greater financial flexibility to navigate potential challenges and invest in growth initiatives.
Seeking Alpha
In terms of downside risks, both XOM and OXY (and other oil peers too) face a common set of risks, such as environmental regulations, fluctuations in oil and natural gas prices, etc. I won’t further delve into these common risks and will concentrate more on the risks that are unique to my above analyses on XOM and OXY. My view is that XOM is sensitive to geopolitical risks and operational challenges compared to OXY because of its larger size and more extensive global reach. Such extensive operations expose it to political instability and regulatory uncertainties in various parts/regions of the world.
Given their recent acquisitions and the magnitude of these acquisitions as mentioned above, I expect integration and merger-related costs to remain elevated in the near term. I am optimistic about the long-term synergistic opportunities, but these costs could create temporary profit headwinds. Finally, XOM has been making considerable investments recently to increase the diversity of its operating portfolio. Besides its traditional oil and gas operations, XOM is also expanding its alternative energy portfolio (such as carbon capture and storage, lithium battery development, etc.). I am optimistic about the long-term benefits of these initiatives, but their financial implications in the near term are uncertain.
To conclude, I am overall bullish on the energy sector under current conditions given the compressed oil prices. As argued in my earlier article, I consider leading oil stocks an attractive option to gain commodity exposure following Dalio’s 4-asset model. In particular, I think sector leaders like XOM are even stronger options. For example, in XOM’s case, its profitability metrics and balance sheet strength are better than close peers like OXY and the overall sector approximated by XLE, yet it is currently trading at lower valuation multiples.
Analyst’s Disclosure: I/we have no stock, option or similar derivative position in any of the companies mentioned, and no plans to initiate any such positions within the next 72 hours. I wrote this article myself, and it expresses my own opinions. I am not receiving compensation for it (other than from Seeking Alpha). I have no business relationship with any company whose stock is mentioned in this article.
Seeking Alpha’s Disclosure: Past performance is no guarantee of future results. No recommendation or advice is being given as to whether any investment is suitable for a particular investor. Any views or opinions expressed above may not reflect those of Seeking Alpha as a whole. Seeking Alpha is not a licensed securities dealer, broker or US investment adviser or investment bank. Our analysts are third party authors that include both professional investors and individual investors who may not be licensed or certified by any institute or regulatory body.
As you can tell, our core style is to provide actionable and unambiguous ideas from our independent research. If your share this investment style, check out Envision Early Retirement. It provides at least 1x in-depth articles per week on such ideas.
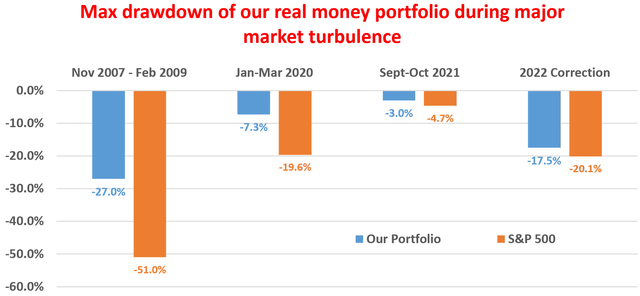
We have helped our members not only to beat S&P 500 but also avoid heavy drawdowns despite the extreme volatilities in BOTH the equity AND bond market.
Join for a 100% Risk-Free trial and see if our proven method can help you too.
