Summary:
- Renowned Shark Tank personality Kevin O’Leary loves energy stocks so much to call them “golden.”
- He especially highlighted the ample cash flow and generous distribution here.
- I will support and extend his argument by looking at both the sector (represented by the Energy Select Sector SPDR® Fund ETF, XLE) and a leading stock (Exxon Mobil Corporation).
- The sector does look golden at both the forest and tree-level.
- Besides the cash flow and distribution, profitability is near a peak level. Yet valuation multiples are compressed to single digits.
baona
Thesis
Kevin O’Leary, the star personality at Shark Tank, recently commented that “Energy Stocks Look Golden.” Quote:
“I love energy. Everybody hates energy… Go where people hate it. Energy is the driving pivot.” O’Leary said. “The cash flow, the distribution… that sector is looking golden right now.”
The main thesis of this article is to substantiate his above view with data and analysis. You will see that the energy sector does look golden on my own dashboard, too (see the first chart in the next section). In the remainder of this article, I will detail my assessment of the sector. Sometimes, the perspective for a sector can be biased by one (or a few leading stocks) in the index. To rule out such bias, the approach I will use is to look at both the forest level and the tree level. As such, I will examine both the energy sector as a whole and the leading stock in the sector. I will approximate the sector by the Energy Select Sector SPDR® Fund ETF (NYSEARCA:XLE), and the leading stock I will examine is Exxon Mobile Corporation (NYSE:XOM).
And the main conclusions from my examinations are:
- The sector is indeed attractive at both the forest and trees level.
- The cash flow and generous distribution are indeed near a cyclical peak level for both XLE and XOM.
- Furthermore, profitability is also near the historical peak level too. Yet valuation multiples are compressed to single digits, simply too low to justify.
- Finally, I will also explain why XOM could provide a few additional pluses compared to the whole sector. It seems to be more expensive and generates a lower yield than XLE. But once you factor in the profitability and its buyback yields, the picture is reversed.
Energy looks golden on my dashboard too
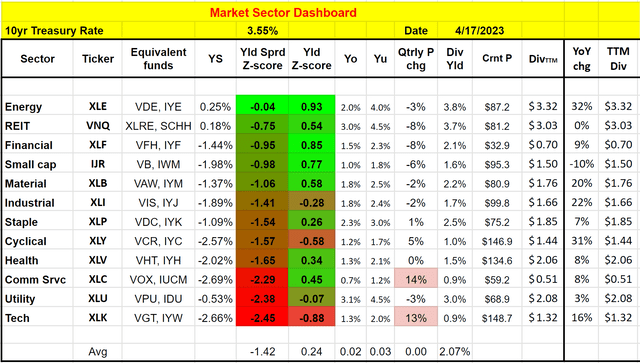
As seen in the chart below, the sector (again, approximated by XLE) is the top 1 value sector revealed by my own dashboard (by the way, you are welcome to download it here). Not only that, but it is also more attractive than the rest of the sectors (say the real estate investment trust, or REIT, sector, the 2nd highest ranked sector) by a good margin both in terms of dividend yield and the yield spread relative to 10-year treasury rates.
Finally, over the past year, the sector has been the one that has the highest dividend growth rates. Its TTM dividend distribution grew a whopping 32% YOY. As to be explained later, for cyclical sectors like commodities, dividend distributions are the best approximations for owners’ earnings the way I see things. And as a result, I view such a large boost in the sector dividends as the most reliable indicator of the sector’s growth and profitability potential, as elaborated on next.
XLE and XOM – the forest and the tree
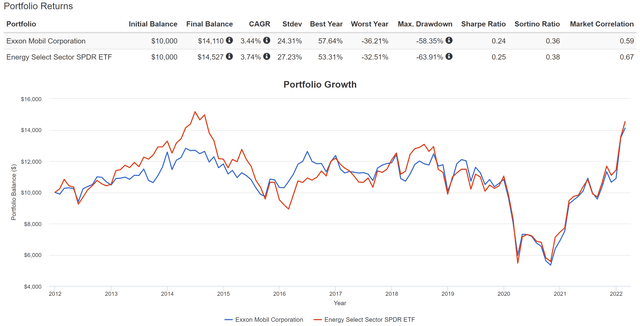
First, a quick intro to XLE and XOM in case there are readers new to these tickers. XLE is arguably the most popular energy sector fund. Currently, it holds a total of 26 stocks, all in the energy sector as seen in the first chart below. And XOM is its largest holding, accounting for nearly 23% of its total assets. Consequently, XLE’s performance is closely tied to the performance of XOM, as reflected in the second chart. Their price movements and returns have been closely mirroring each other in the past.
Source: Seeking Alpha data Source: Portfolio Visualizer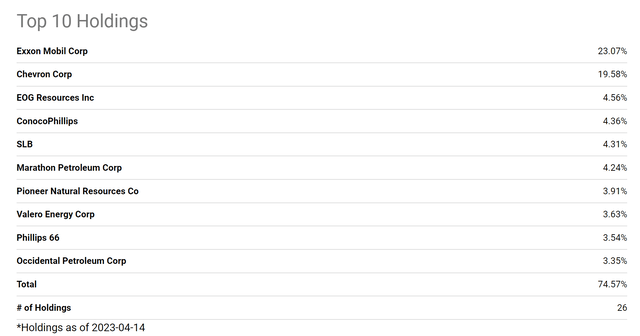
The third chart below provides a further comparison of XLE and XOM, which offers more insights at a more fundamental level. The data used here are compiled from Yahoo Finance, Seeking Alpha, and XLE’s fund descriptions (more on this later) on April 17. Note that some of these numbers (e.g., the valuation multiple) may change a bit when you read this article. But the profitability and consistency metrics are fundamental metrics independent of stock prices.
At first glance, XOM seems to be more expensive than XLE in terms of both bottom-line and topline valuation multiples. Its P/cash ratio of 6.13x is about 4% above XLE’s 5.91x. And its P/Sales ratio is about 26% higher. And later, you will see that its dividend yield is also lower than XLE’s both in absolute and relative terms.
However, in the next section, I will explain: A) the valuation multiples for both XOM and XLE are already too compressed; and B) XOM’s valuation is probably low once you factor in the profitability differences and its buyback yields.
Source: Authored based on data from Yahoo Finance, Seeking Alpha, and XLE’s fund description
XLE and XOM: Profitability comparison
As seen in the chart above, XOM’s operating margin is about 26% higher than XLE (19.7% vs. 16.2%), almost canceling out the 26% difference in the P/sales ratio mentioned above. More fundamentally, XOM’s average profitability in terms of ROCE (return on capital employed) is about 52% higher than XLE’s average of 14.1%, more than enough to offset the premium in its valuation multiples.
The above profitability comparisons were made based on historical averages. And if we compare their current profitability, XOM’s superiority could be even more dramatic as shown in the next chart. As seen, XOM’s ROCE dropped to about 6% during the 2020 COVID pandemic, far below its historical average. Since then, it has staged a sharp V-shaped recovery. To wit, its current ROCE hovers near a cyclical peak of 37.4% based on TTM finances.
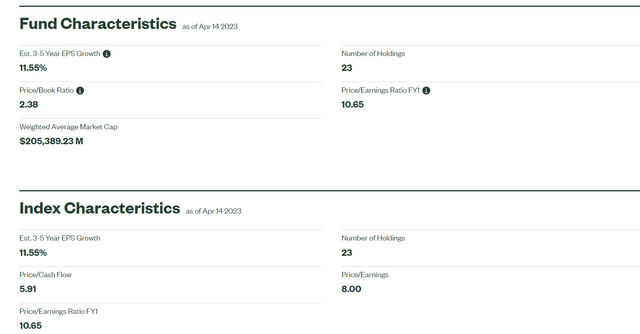
XLE’s profitability is also near a historical peak, but its ROCE is a bit lower than XOM as shown. Since the data required to compute XLE’s ROCE is unavailable, the Return on Equity (“ROE”) of the fund has been used as an approximation here. The ROE of XLE is inferred from its P/E and P/BV multiples from the fund’s descriptions (shown in the second chart below). All told, XLE’s ROE is approximately 20% ~ 25% depending on which P/E multiple you use, substantially below XOM’s ROCE of 37.4%. And note that ROE tends to exaggerate the actual profitability for XLE, as the energy sector overall uses leverage more aggressively.
Source: Authored based on data from Seeking Alpha Source: XLE fund description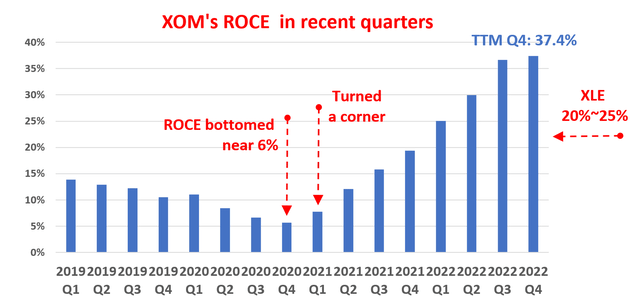
Dividends as a measure of owners’ earnings
O’Leary highlighted distributions, particularly for a good reason. For stocks that are highly cyclical, such as commodity-related stocks, the common accounting EPS is a very misleading indicator of their actual economic earnings (or the so-called owners’ earnings). For companies that consistently pay dividends (like XOM), dividends are a much better indicator of owners’ earnings, probably the most reliable in my view, because it offers greater transparency, stability over the long term, and direct relevance to shareholders’ interests.
As such, the remainder of this analysis will rely on XOM and XLE’s dividend distributions, which are used to approximate their owner’s earnings. And consequently, their dividend yield will be used to approximate the owners’ earning yield (“OEY”).
The next chart compares their dividend yields over the past 10 years. XOM has consistently paid a higher yield (the orange) than XLE (the blue line). However, the trend was reversed in 2020. Currently, XOM’s dividend yield of 3.08% is about 19% below XLE’s 3.8% in relative terms.
Source: Authored based on data from Seeking Alpha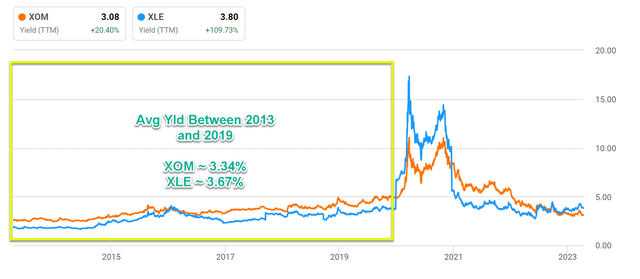
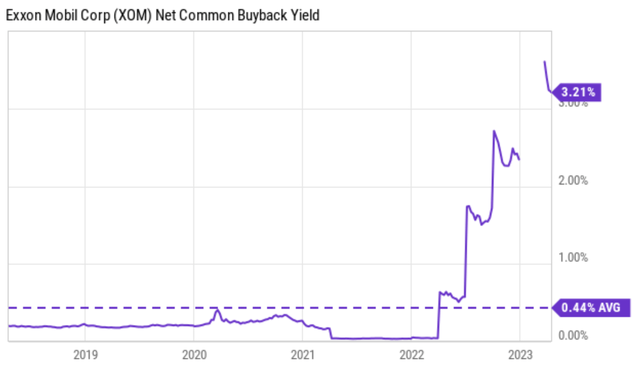
However, when the total shareholder yield is considered, the comparison is the opposite as shown in the next chart. It has been a consistent practice at XOM to repurchase its own shares over the years. And the magnitude of buybacks is another good reflection of its discretionary cash flow. On average, XOM’s buyback yield has been approximately 0.44% over the past 10 years. But it currently stands at an impressive 3.21%. This, when added to its cash dividend yield of 3.08% just mentioned results in a mouthwatering total yield of more than 6% already.
Risks and final thoughts
I won’t repeat the risks associated with either Exxon Mobil Corporation or XLE. These risks (such as environmental, geopolitical, oil prices, et al) have been thoroughly discussed in many other Seeking Alpha articles, including some of our own. Here I will just point out a few risks associated with the use of distributions as a measure of XOM and XLE’s economic earnings, which is an underlying assumption for both O’Leary and my thinking. However, readers need to be aware that dividend distributions do not always reflect business fundamentals.
Many extrinsic factors, such as tax regulations and the political environment could impact a company’s distribution policies. And both factors are currently especially relevant to XOM and the energy sector. These companies’ current dividend distributions are probably influenced by the current political climate, and the tax levied on share repurchases could also influence the balance between cash distributions and repurchases. As such, readers are cautioned to examine if the nominal dividend yields need to be adjusted. And this earlier article provides more details of my own approach to making adjustments.
Nonetheless, dividend distributions, together with the approach presented here, always serve as an excellent starting point in evaluating potential investment opportunities. And my results indeed show that the energy sector is golden. My results fully support the claim that O’Leary made about the sector’s cash flow and distributions. In addition, I also want to add that both for Energy Select Sector SPDR® Fund ETF and Exxon Mobil Corporation, the divergence between their current profitability and valuation compression is too large to ignore. And finally, I’ve looked at other leading stocks in the sectors such as Chevron Corporation (CVX) and Energy Transfer LP (ET), and the conclusions are consistent with this article. The sector is indeed golden both at the forest and tree levels.
Analyst’s Disclosure: I/we have no stock, option or similar derivative position in any of the companies mentioned, and no plans to initiate any such positions within the next 72 hours. I wrote this article myself, and it expresses my own opinions. I am not receiving compensation for it (other than from Seeking Alpha). I have no business relationship with any company whose stock is mentioned in this article.
Seeking Alpha’s Disclosure: Past performance is no guarantee of future results. No recommendation or advice is being given as to whether any investment is suitable for a particular investor. Any views or opinions expressed above may not reflect those of Seeking Alpha as a whole. Seeking Alpha is not a licensed securities dealer, broker or US investment adviser or investment bank. Our analysts are third party authors that include both professional investors and individual investors who may not be licensed or certified by any institute or regulatory body.
As you can tell, our core style is to provide actionable and unambiguous ideas from our independent research. If your share this investment style, check out Envision Early Retirement. It provides at least 1x in-depth articles per week on such ideas.
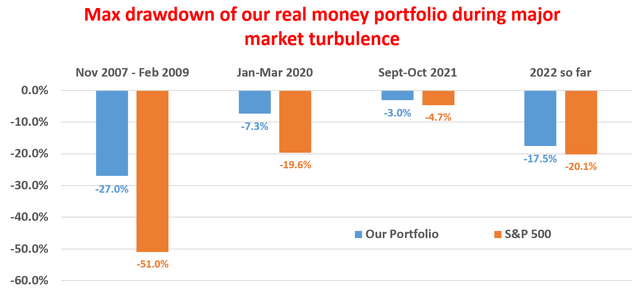
We have helped our members not only to beat S&P 500 but also avoid heavy drawdowns despite the extreme volatilities in BOTH the equity AND bond market.
Join for a 100% Risk-Free trial and see if our proven method can help you too.
