Summary:
- The energy sector has outperformed the overall market in the last four months.
- Our analysis suggests a favorable entry point soon for energy stocks, particularly Exxon Mobil.
- Elliott Wave Theory and Fibonacci Pinball provide a methodology for understanding market behavior and making investment decisions. We show how we apply it to this setup.
AleksandarNakic/E+ via Getty Images
By Levi at Elliott Wave Trader; Produced with Avi Gilburt
Did you know that (NYSE:XOM) has outperformed the overall market (SPY) during the last four months? With the hype of all things AI, one would think just the opposite. But if you look at the numbers from when we turned quite bullish on the energy sector back in January, this is what you will discover. From when we published “Opportunity Is Knocking – Should You Answer?” (XOM) is up nearly +19% vs a return of +5% for (SPY).
And, in the last 4 weeks the (SPY) is decidedly weaker than (XOM) and the energy sector (XLE). In the article mentioned above as well as the piece from March 26th entitled, “Opportunity Knocked – Did You Answer? What’s Next?,” we laid out the analysis with the synergy between Fundamentals with Lyn Alden and the Technicals with Zac Mannes and Garrett Patten. It’s now time for an update as to where we find ourselves in the greater context of the chart. It would seem that a more favorable entry will present itself soon. Here’s why.
The Wave Setups Feature
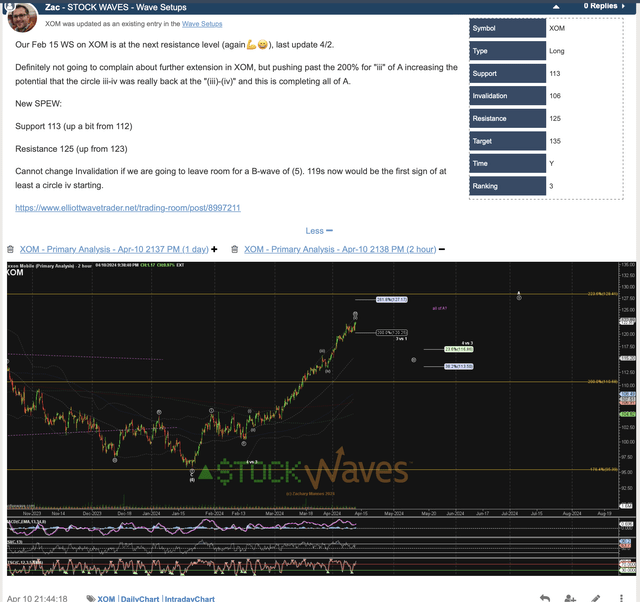
At any one time, we will have 40 to 50 active Wave Setups with both long and short positions. These setups are constantly monitored and updated as needed. Back on April 10th Zac put out several of the energy charts that were striking their initial targets as posted to our members on February 15th. This is the update post for (XOM):
by Zac Mannes – StockWaves – Elliott Wave Trader
Note the specific levels for support, resistance, and invalidation. These are always clearly stated in the Wave Setups table for each respective chart in play.
The Current Picture For XOM
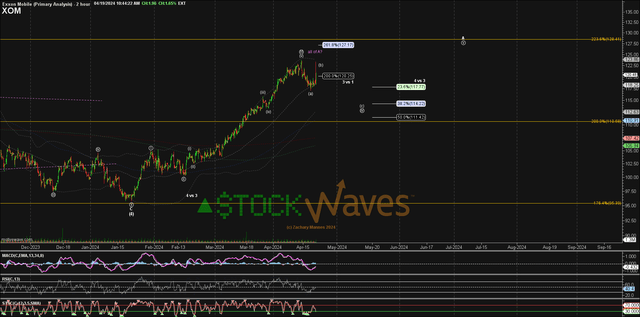
Just Friday, Zac updated some of the main energy charts that we follow. Here is the latest for (XOM):
post by Zac Mannes by Zac Mannes – StockWaves – Elliott Wave Trader

You can see that there are a few possibilities in the near term. One is that the price struck on the morning of April 12th is all of the ‘A’ wave as anticipated. If so, then the chart should next fill out a ‘B wave’ and could drop down to the 38% or even the 62% retracement of the ‘A’ wave rally. It is more likely though to follow the path projected by Zac in white. This is a wave ‘iv’ pullback that would target approximately $114 in a standard retrace.
Whether this is a wave ‘iv’ pullback or something deeper like the larger ‘B’ wave, the larger context is telling us that (XOM) and the energy sector as a whole should see higher levels over the next several months.
Each chart that we follow has specific levels that tell us that our primary scenario as anticipated is further confirming our projection, or if we should begin to shift our weight to the alternative path on the chart. This is because we view the markets from a probabilistic vantage point. What does this mean?
Looking At The Markets Through A New Lens
Avi Gilburt writes extensively about our methodology, Elliott Wave Theory and Fibonacci Pinball. For an introductory understanding of this, start here with part one of the six part series that Avi shared with the readership some time back.
When this theory is correctly applied, it will provide context to where we find ourselves in the markets at any one point in time. We know of no other methodology that can do this. Now, this is not hocus-pocus, balderdash, poppycock, or anything of the kind. It is rudimentary human behavior playing out before our very eyes via the structure of price on the charts. Following is a brief excerpt from the article mentioned in the prior paragraph:
“So, if you are interested in a methodology which will open your minds and eyes as to how markets really work, then let’s move right into the overview.
Back in the 1930’s, an accountant named Ralph Nelson Elliott identified behavioral patterns within the stock market which represented the larger collective behavioral patterns of society en masse. And, in 1940, Elliott publicly tied the movements of human behavior to the natural law represented through Fibonacci mathematics.
Elliott understood that financial markets provide us with a representation of the overall mood or psychology of the masses. And, he also understood that markets are fractal in nature. That means they are variably self-similar at different degrees of trend.
Most specifically, Elliott theorized that public sentiment and mass psychology move in 5 waves within a primary trend, and 3 waves within a counter-trend. Once a 5 wave move in public sentiment has completed, then it is time for the subconscious sentiment of the public to shift in the opposite direction, which is simply the natural cycle within the human psyche, and not the operative effect of some form of ‘news’.” – Avi Gilburt
How Can This Help Me With XOM?
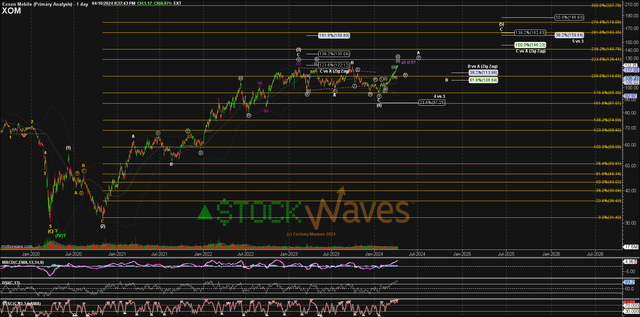
Take a look at the following chart posted by Zac back a week ago:
by Zac Mannes – StockWaves – Elliott Wave Trader
Now, please recall that the market is fractal in nature. Also, price will display self-similarity at all degrees of the structure. This means that the smaller forms and patterns will repeat in larger ones. And it is this very key fact that gives this methodology its true utility and power.
The above chart tells us that after a brief pullback in either the wave ‘iv’ of ‘A’ or a deeper ‘B’ wave of the larger wave [5] on the chart to the upper right, we should then find ourselves in the ‘C’ wave of that wave [5] with a possible price target of $160 or higher.
Note back on the Wave Setups post for (XOM) that this scenario would invalidate should price move under $106 before entirely completing as shown.
Continuing Education
We have an extensive Education library available at Elliott Wave Trader. As well, we want to teach others this methodology. Three times a week, we have beginner and intermediate-level videos where we show the exact way we count the waves and give in-depth analysis techniques. This methodology, if you give it the chance, will change the way you invest forever.
There are many ways to analyze and track stocks and the market they form. Some are more consistent than others. For us, this method has proved the most reliable and keeps us on the right side of the trade much more often than not. Nothing is perfect in this world, but for those looking to open their eyes to a new universe of trading and investing, why not consider studying this further? It may just be one of the most illuminating projects you undertake.
If you would like notifications as to when our new articles are published, please hit the button at the bottom of the page to “Follow” us.
Analyst’s Disclosure: I/we have no stock, option or similar derivative position in any of the companies mentioned, but may initiate a beneficial Long position through a purchase of the stock, or the purchase of call options or similar derivatives in XOM over the next 72 hours. I wrote this article myself, and it expresses my own opinions. I am not receiving compensation for it. I have no business relationship with any company whose stock is mentioned in this article.
Seeking Alpha’s Disclosure: Past performance is no guarantee of future results. No recommendation or advice is being given as to whether any investment is suitable for a particular investor. Any views or opinions expressed above may not reflect those of Seeking Alpha as a whole. Seeking Alpha is not a licensed securities dealer, broker or US investment adviser or investment bank. Our analysts are third party authors that include both professional investors and individual investors who may not be licensed or certified by any institute or regulatory body.
STOCK WAVES: Where fundamental analysis meets technical analysis for highest-probability investment opportunities! Get leading Elliott Wave analysis from our team, along with fundamental insights and macro analysis from top author Lyn Alden Schwartzer.
“Stockwaves is my bread and butter, and that’s only catching maybe 10% of the charts they throw out! I had 7-10x+ trades with SW last year, and dozens more that were “slackers” (LOL) with “only” 3-4-5x returns. Amazing!” (Nicole)
Click here for a FREE TRIAL.
