Summary:
- Lyn Alden discusses how the Energy sector is under-owned but has gradually increasing demand that is expected to push energy prices upward. Exxon Mobil Corporation will be a beneficiary of this.
- Exxon Mobil stock is in the middle of a larger rally structure, with a projected price target of as high as $140 over the next several months.
- Our Elliott Wave Theory methodology can provide guidance and risk management in trading and investing in Exxon Mobil and many others.
HAKINMHAN/iStock via Getty Images
By Levi at Elliott Wave Trader; Produced with Avi Gilburt.
Well, if you did answer back in January of this year, then you have outperformed the overall market as measured by the S&P 500 Index (SP500). Exxon Mobil Corporation (NYSE:XOM) is up approximately +13% from the time of publication of the article “Opportunity Is Knocking – Should You Answer” vs. SPDR® S&P 500 ETF Trust (SPY), which is up a bit less than +10% in the same period. Will this outperformance continue? How can we manage this trade and protect our profits? Let’s discuss below.
Energy Sector Macro View With Lyn Alden
“Overall, the energy sector continues to be an uncrowded and under-owned space by most investors, and pays good dividends to those who hang around for the ride. Energy prices don’t need to blow out for these companies to produce attractive total returns from these levels. My preference is toward companies with long-lived reserves.
The two main risks to that thesis as we look out for the rest of the decade are either 1) lower than expected global demand or 2) higher than expected global output. I expect gradual demand increases and supply increases with risks of supply disruptions here and there, but overall for energy prices to push upward in large part because the denominator (currency) is falling.
So, one way to protect the thesis is to own companies that benefit from greater production. I view higher than expected supply as a more likely risk than major demand destruction, and so that’s the side I prefer to have more protection on.”
Getting Specific With ExxonMobil
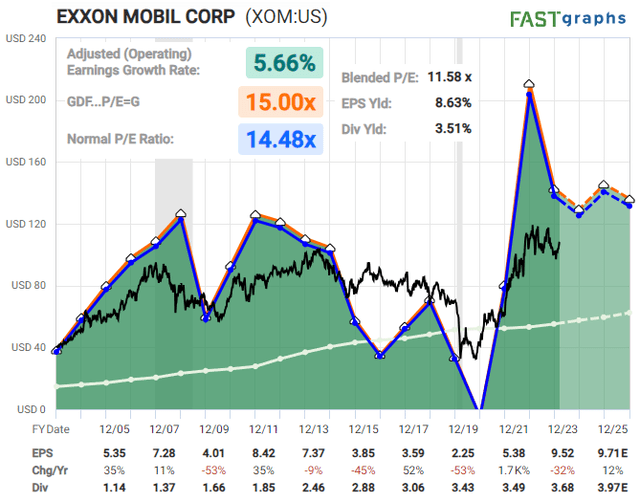
“I’m bullish the whole energy complex and don’t have a firm view on the relative performance of different names. I like holding a bunch of different ones to spread out operational risk, jurisdictional risk, and to get exposure to different types/sources of oil. For me, it’s more of a macro play than a company-specific play.” – Lyn Alden.
Chart by Lyn Alden – FastGraphs
*F.A.S.T. Graphs 101*
*Black line: the current and historical stock price
*Blue line: what the stock price would be if were at its historically average price/cash-flow ratio
*Orange line: a conservative measure of valuation (a 15x price/cash-flow in this case)
*White line: dividends paid that year (and the payout ratio is relative to the orange line)
*Dark/light green: the transition between historical earnings numbers and consensus analysts’ forecast earnings numbers.
How To Use Our Methodology To Protect Profits And Manage Trades
For the purposes of the discussion herein, let’s assume that you, the reader, have a basic understanding of how our methodology works. If you would like to view the fundamentals of this, please see part one of the six-part article series by Avi Gilburt here. It is a comprehensive explanation of the how’s and why’s of the proper application of Elliott Wave Theory and Fibonacci Pinball.
Remember, stocks and indexes typically advance on 5 waves and correct in 3 wave structures. It is this very structure of price that repeats in similar forms on all time frames. Some call this self-similarity. Others refer to it as the fractal nature of the markets. In any name, the result is the same. We can use these forms and structures to project what is more likely to take place going forward. Here’s how that shapes up in XOM.
This Methodology Applied To The Exxon Mobil Chart
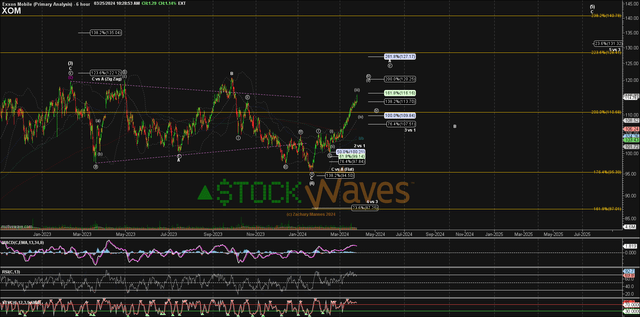
Let’s take a look at Zac’s latest chart for XOM:
Chart by Zac Mannes – StockWaves – Elliott Wave Trader
As you can see, we are in the heart of a larger rally structure. This was anticipated, and thus far has played out as projected. But, please keep in mind that projections are not prophecies. Yes, using our methodology they play out more often than not. However, we must have a proper risk management system in place to oversee our positions.
Here’s what to keep in mind as price continues to fill in the Exxon Mobil Corporation chart. Note that from the low marked wave “C” of [4] earlier this year we have a 5 wave structure forming. At the open of this week, price struck near exact at the 1.618 extension of the initial waves circle “i” and “ii” up from that major low. This is typical behavior.
The standard support in a structure like this is now at the $110 area and we should see a corrective pullback. That could be an opportunity for a short term long position or adding to an existing trade. What would tell us when this supposition needs adjustment? Should price move under $107.50 in the near term then the micro count as illustrated here may need updating. The larger picture projection would only change with a move under the $100 level.
For now, we are anticipating this rally to carry price to as high as the $140 level over the next several months. Along the way, we will continually monitor how the structure of price fills in the chart and adjust accordingly.
You May Be Skeptical
And that’s OK. Even skeptics can become successful beneficiaries of this methodology. I would venture to say that many of our more than 8,000 current members were at one time such skeptics. What caused the shift in their opinion? They saw with their own eyes the power and utility of Elliott Wave Theory when correctly practiced. When you see this in real-time, it truly is a sight to behold.
Conclusion
Back in January we were able to identify a favorable risk vs. reward setup for Exxon Mobil stock. If this setup is a bust, we will simply move on to the next, as there are a myriad of them in the markets at any one time.
Yes, there are nuances to the analysis. Once familiar with our methodology, our members discover a powerful ally on their side to provide guidance and risk management in their trading/investing.
There are many ways to analyze and track stocks and the market they form. Some are more consistent than others. For us, this method has proved the most reliable and keeps us on the right side of the trade much more often than not. Nothing is perfect in this world, but for those looking to open their eyes to a new universe of trading and investing, why not consider studying this further? It may just be one of the most illuminating projects you undertake.
(Housekeeping Matters)
If you would like notifications as to when our new articles are published, please hit the button at the bottom of the page to “Follow” us.
Analyst’s Disclosure: I/we have no stock, option or similar derivative position in any of the companies mentioned, but may initiate a beneficial Long position through a purchase of the stock, or the purchase of call options or similar derivatives in XOM over the next 72 hours. I wrote this article myself, and it expresses my own opinions. I am not receiving compensation for it. I have no business relationship with any company whose stock is mentioned in this article.
Seeking Alpha’s Disclosure: Past performance is no guarantee of future results. No recommendation or advice is being given as to whether any investment is suitable for a particular investor. Any views or opinions expressed above may not reflect those of Seeking Alpha as a whole. Seeking Alpha is not a licensed securities dealer, broker or US investment adviser or investment bank. Our analysts are third party authors that include both professional investors and individual investors who may not be licensed or certified by any institute or regulatory body.
STOCK WAVES: Where fundamental analysis meets technical analysis for highest-probability investment opportunities! Get leading Elliott Wave analysis from our team, along with fundamental insights and macro analysis from top author Lyn Alden Schwartzer.
“Stockwaves is my bread and butter, and that’s only catching maybe 10% of the charts they throw out! I had 7-10x+ trades with SW last year, and dozens more that were “slackers” (LOL) with “only” 3-4-5x returns. Amazing!” (Nicole)
Click here for a FREE TRIAL.
