Summary:
- Exxon Mobil’s Q1 earnings disappointed market expectations, with a decline in net income and revenues compared to the same period last year.
- Management attributes the earnings disappointment to inventory and non-cash tax adjustments, but highlights ongoing cost savings and a strengthened balance sheet.
- Despite a history of volatile trend movements, the stock’s strong cash flow generation and sustainable dividend yield make it an attractive investment option even at these elevated levels.
JHVEPhoto
Shares of Exxon Mobil (NYSE:XOM) have encountered rounds of selling pressure following the release of the oil giant’s most recent earnings report. For the first-quarter period, Exxon Mobil recorded $8.22 billion in net income (or per-share earnings of $2.06), disappointing market expectations (consensus estimates were looking for EPS of $2.20) and indicating an annualized decline of 28% relative to the $2.79 EPS figure ($11.43 billion in net income) that was reported during the same period last year.
First-Quarter Earnings (Exxon Mobil)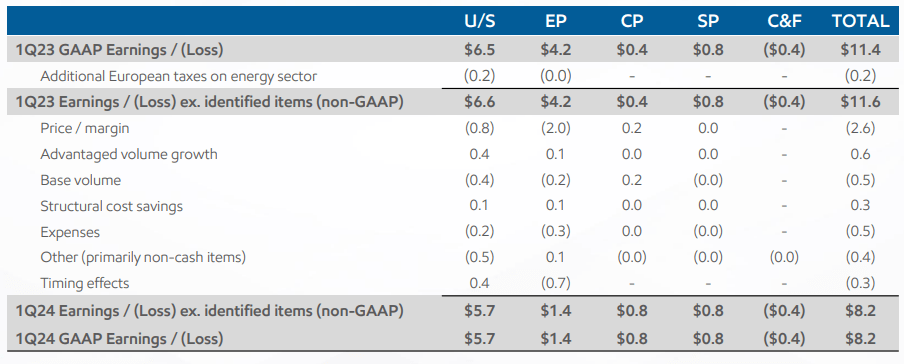
On the revenue side, Exxon Mobil generated a bit better performance at $83.08 billion, which surpassed analyst estimates of $78.35 billion but still marked a 4.02% annualized decline when compared to the $86.56 billion in revenues recorded during the same period last year. Overall, the energy market has fallen victim to broader industry trends, as falling prices in natural gas and refining margin deterioration have weighed on earnings results.
Cash-Flow Figures (Exxon Mobil)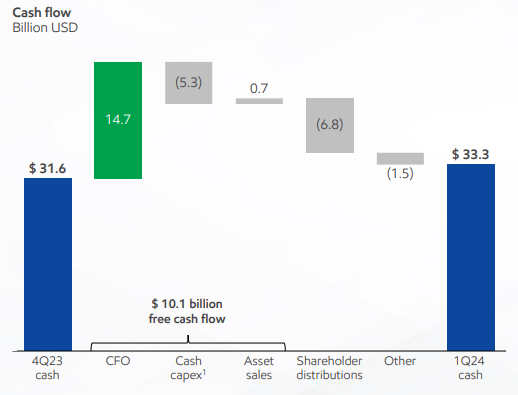
Management has also attributed disappointments in earnings results to inventory and non-cash tax adjustments, with CEO Darren Woods adding:
An important driver of this improved earnings power is our ongoing focus on structural cost savings, which reached $10.1 billion in the quarter vs. 2019, furthering our progress toward our goal of $15 billion by 2027. Capex in the quarter was $5.8 billion as we continue to invest in advantaged growth projects that will drive future earnings and cash flow…
At the same time, we further strengthened our balance sheet, bringing our net debt to capital down to 3%, the lowest in more than a decade. To reward our shareholders, we distributed $6.8 billion in cash, including $3.8 billion in dividends. For all of 2023, ExxonMobil was the third-largest total dividend payer in the S&P 500. Only Microsoft and Apple paid more.
For loyal investors focused on the stock’s strong 3.28% dividend yield, management’s strategic efforts to bolster cash flow figures and dividend stability should be viewed as encouraging. However, when we look at the price history in share prices themselves, a much more erratic picture starts to materialize for those with long positions in XOM.
As a short re-cap, our previous buy-rating on this stock was published in early August 2021, titled “Exxon Punished After Impressive Earnings”, at a time when XOM was trading at just $57.57 per share. Of course, our bullish thesis revolved around the idea that Exxon Mobil shares were experiencing unjustified selling pressure despite clearly positive strength in the company’s corporate earnings reports. Since then, XOM has appreciated by an incredible 102.8% – and total returns for our long position have generated market-beating gains of 124.31%. During the same period of time, the S&P has returned much more tepid gains of just 17.94%. In light of these inspiring gains, we will need to outline new support and resistance levels which can be used to manage our position going forward.
XOM: Monthly Chart (Income Generator via TradingView)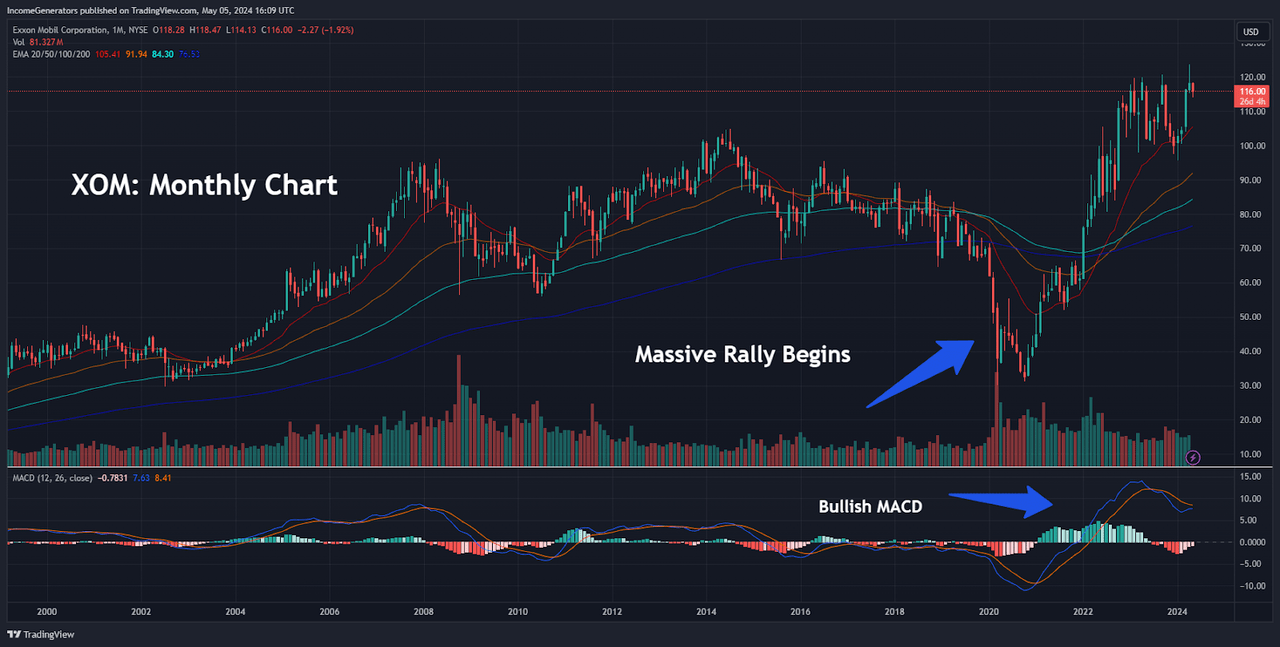
On the monthly charts, we can see that Exxon Mobil’s long-term trend activity has encountered extended periods of time, which must have been quite depressing for loyal XOM shareholders. For example, anyone purchasing the stock in the early 2000s (and holding those positions for the next two decades) would likely have seen almost zero appreciation in share prices. Of course, the stock’s attractive dividend yield does offset a portion of these negatives – but it is quite clear at this stage that the opportunity cost XOM investors have had to shoulder during this period of time has been extensive and undeniable.
Fortunately, XOM has managed to post an impressive turnaround in these bearish trends following the long-term low in share prices ($30.11) which printed during the early COVID-19 markets of March 2020. Most significantly, the July 2014 highs of $104.76 have been overcome in clearly convincing fashion, and share prices are currently consolidating at these upper levels with very little to be seen in the way of downside corrections. From a technical perspective, share prices have managed to hold support at the stock’s 20-month exponential moving average (EMA), and bullish readings in the monthly Moving Average Convergence Divergence (MACD) indicate further XOM trend strength.
XOM: Triple-Top Resistance Breaks (Income Generator via TradingView)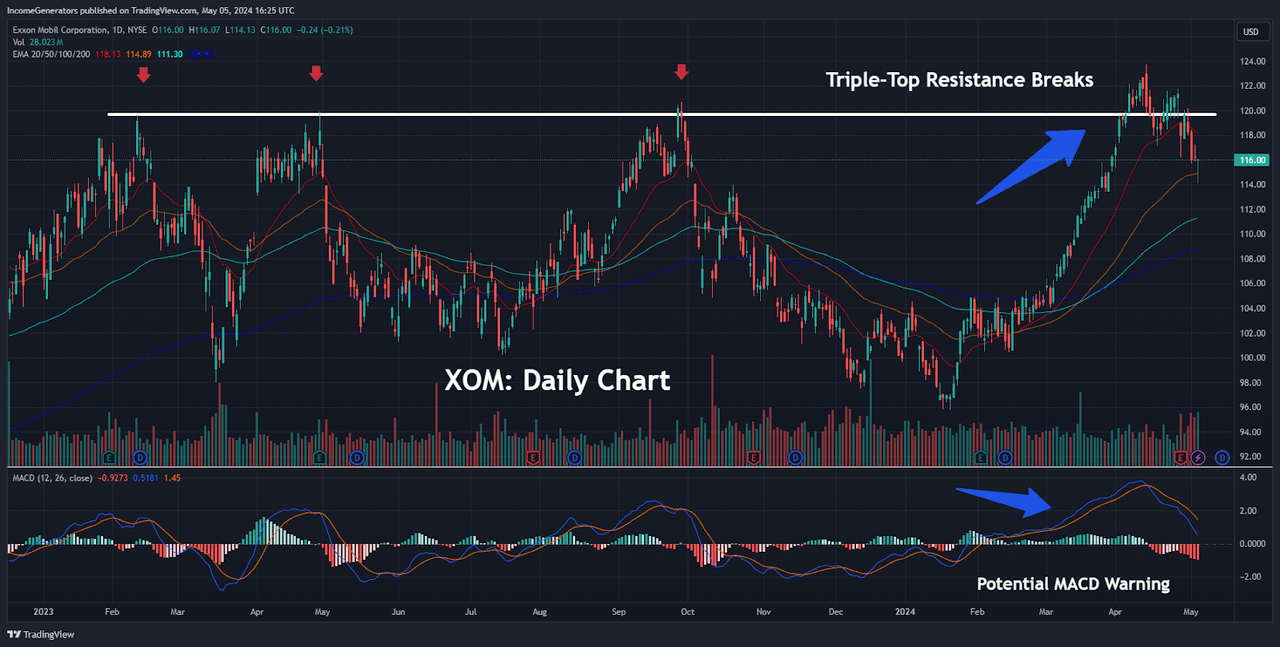
Taking a closer look at this upper consolidation pattern, we have highlighted the XOM daily chart, which already shows an upside break of a prior triple-top resistance zone. Since prices are already trading at elevated levels, it is surprising to see the stock display such a high level of trend momentum. But we should also highlight potential warning signs in the daily MACD indicator, which has started to look as though a bearish cross might be imminent. Of course, we are not there yet (and this indicator is still holding in positive territory), but this is definitely one trading signal that should be monitored by anyone considering XOM long positions near current levels.
XOM: Near-Term Uptrend (Income Generator via TradingView)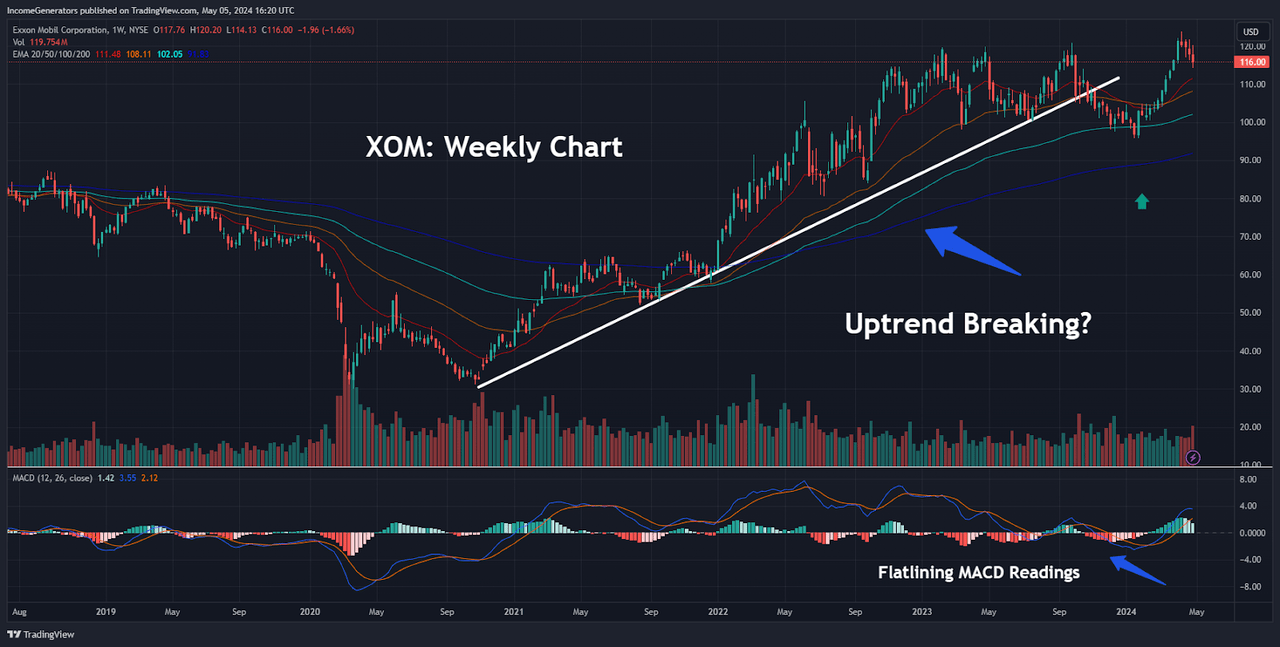
Other bearish counter-points to the bullish analysis can be visualized on the weekly chart, where the stock’s near-term uptrend structure has already failed to support price action. Beginning with the October 2020 lows of $31.11, ultimate support for this uptrend failed in October 2023 – but the 100-week EMA did manage to contain prices and prevent further declines, allowing the stock to record a higher high (at $123.75) in early April 2024. On balance, this makes it much more difficult to argue that the broader uptrend has been invalidated. As long as the stock can continue to print higher highs, any suggestion that a true reversal is in place should be viewed with skepticism (in our view).
XOM: Highly Erratic Price History (Income Generator via TradingView)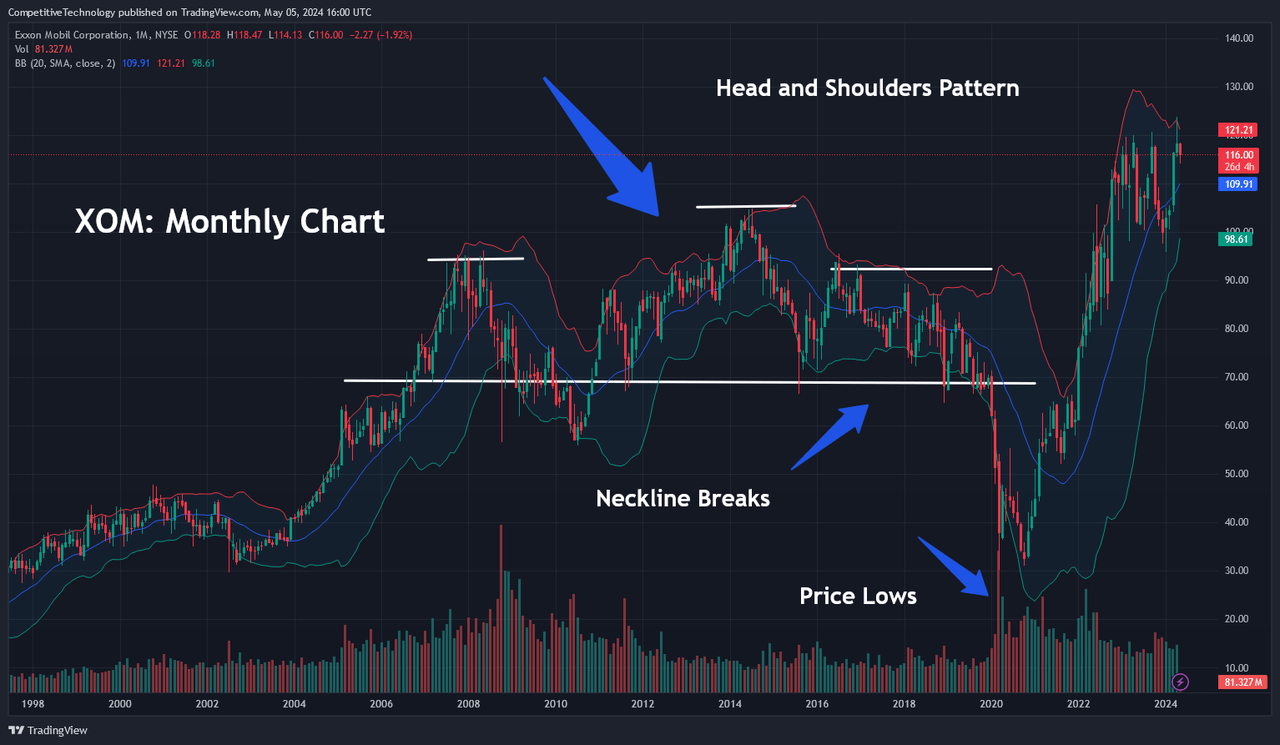
But while we remain bullish on the stock due to its continued strength in cash flow generation and management’s proven ability to maintain stable dividend payouts, we think it is also important to highlight some of the erratic trend activity that has defined XOM stock performance over time. With share prices trading at the upper-end of a bull trend, downside corrections are always a possibility – and a prior example of this type of event occurred in July 2014, when XOM posted highs at $104.76 that would later define integral portions of a head-and-shoulders pattern. In the chart above, we can see that this pattern signaled a collapse in share prices that resulted in the terminal lows of $30.11 in 2020.
XOM: Pivot-Point Region (Income Generator via TradingView)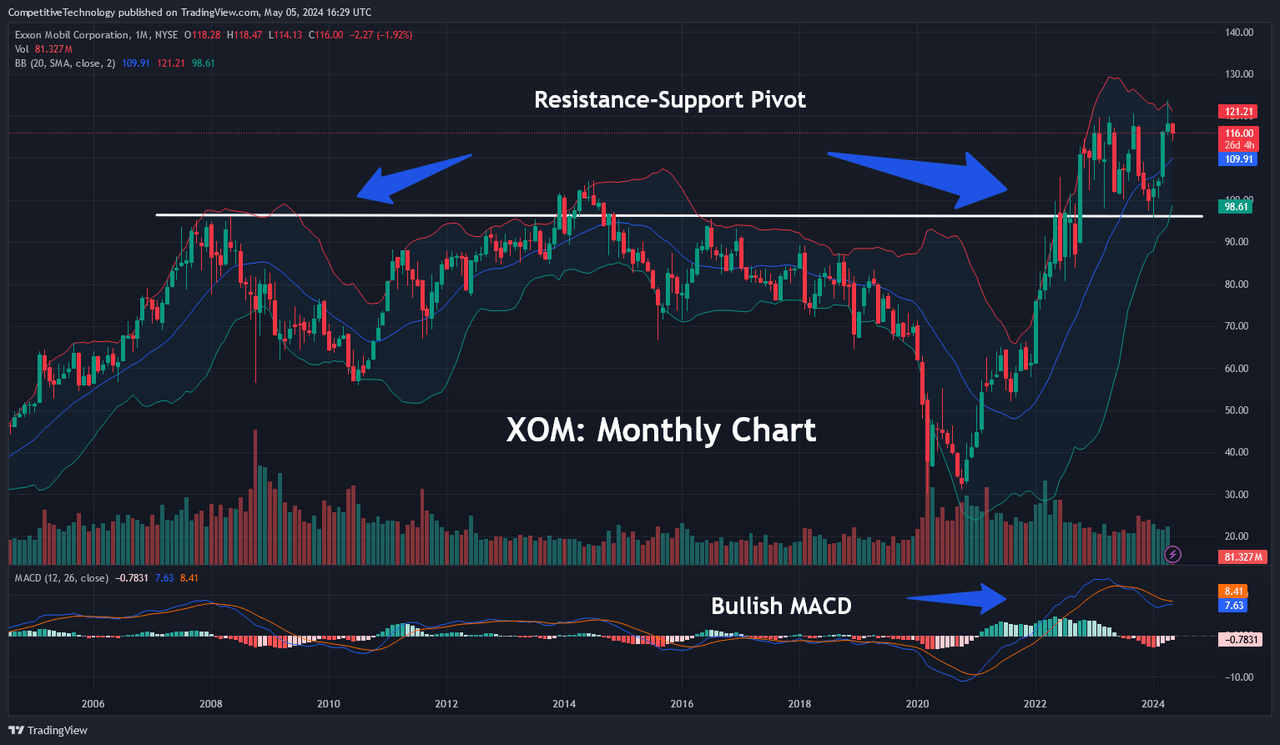
Given this broader perspective on share prices, it would not be surprising to hear that sections of the investment market might be reluctant to invest in a stock that has experienced these types of erratic downward-upward price moves. Of course, these concerns are entirely legitimate, and portfolio security is a topic that should always be top-of-mind for every investor. That said, Exxon Mobil’s latest earnings report continues to show strong evidence of cash flow generation and a sustainable dividend yield. When we combine these factors with long-term price action that continues to find support at key technical levels, we think that investors looking for a time-tested company and added exposure to energy markets can still capitalize on the current bull run in XOM.
We would reconsider our positive stance on the stock if share prices fail at our pivot-point region, which is currently located near $98.60 (outlined in the chart above). However, given the fact that share prices continue to post higher highs (even after a substantial bull run in valuations) and monthly MACD indicator readings remain in strongly positive territory, we think the current uptrend has the potential to continue. Of course, the stock is not cheap (relative to historical averages) but pullbacks thus far have been relatively minor – and dividend investors waiting to buy at lower levels might not see better opportunities over the next quarter. With well-documented supply constraints and seemingly constant geopolitical turmoil in the Middle East influencing markets, energy prices should remain supportive for the time being – and XOM’s attractive dividend yield creates a favorable incentive for investors looking to buy at current levels.
Analyst’s Disclosure: I/we have a beneficial long position in the shares of XOM either through stock ownership, options, or other derivatives. I wrote this article myself, and it expresses my own opinions. I am not receiving compensation for it (other than from Seeking Alpha). I have no business relationship with any company whose stock is mentioned in this article.
Seeking Alpha’s Disclosure: Past performance is no guarantee of future results. No recommendation or advice is being given as to whether any investment is suitable for a particular investor. Any views or opinions expressed above may not reflect those of Seeking Alpha as a whole. Seeking Alpha is not a licensed securities dealer, broker or US investment adviser or investment bank. Our analysts are third party authors that include both professional investors and individual investors who may not be licensed or certified by any institute or regulatory body.
