Summary:
- Although Exxon Mobil beat earnings and raised the dividend, earnings growth trajectories are still negative when looking at the last 3 years of growth.
- This is my largest holding due to a large bet in 2020, but I am now not adding at this time.
- Exxon is finally selling at a premium to the Graham Number, signaling it may not be a great time to buy.
- I do believe that Exxon is however the best of the integrated oil majors to weather a lower oil price environment due to their lower upstream exposure versus competition in this energy sub-segment.
Michael H
I’m not selling, but not adding either
I’ve noted before in a few of my articles that Exxon Mobil (NYSE:XOM) was on most days still my largest single stock holding [it’s currently in competition with Amazon (AMZN) and Google (GOOGL)]. I’ve reduced this a few times, spreading the love around to other dividend payers to diversify a bit, or else Exxon would have easily crossed 5% of my total holdings. This was because I went in heavily during ultra-low oil prices during Covid, when I noticed Exxon dropping below book value and paying a somewhat uncertain 10% dividend yield.
The stock was and still is a Dividend aristocrat [although the free cash flow situation had me worried there for a minute in 2020] and is absolutely worth holding on to for the dividend growth alone if you have it. I, however, would not be adding here as it finally is priced a bit ahead of the Graham Number valuation with not much growth anticipated in earnings for the next couple of years.
Since my last article
Seeking Alpha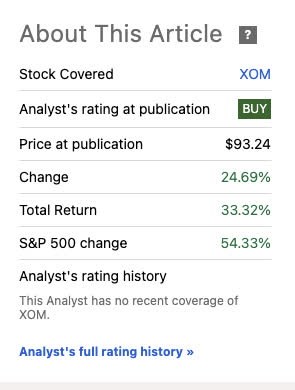
It’s been a long while since I last covered this stock back in 2022, it had an overall nice total return but as we can see, not an S&P 500 beating return.
In 2022, here were the Graham Number valuations as I saw it during that period:
The stock was trading right at its Graham Number value and, at the time, had a higher earnings per share than the trailing twelve months currently [but Exxon does have a higher book value now].
For those not familiar with the Graham Number, it is my favorite way of evaluating companies that produce profits from mostly tangible assets. This was popularized By Benjamin Graham in the Intelligent Investor as a simple way to see if a company was both a good deal based on its P/E ratio and its P/B ratio. The simple calculation was to determine a price where the price-to-earnings times the price-to-book does not cross 22.5 [his magic number].
A price target can be built by simply taking the square root of [EPS X Book Value X 22.5]. Later in this article I will build the same model for all 3 in the above excel spread as of Nov 1st 2024.
Year-to-date performance
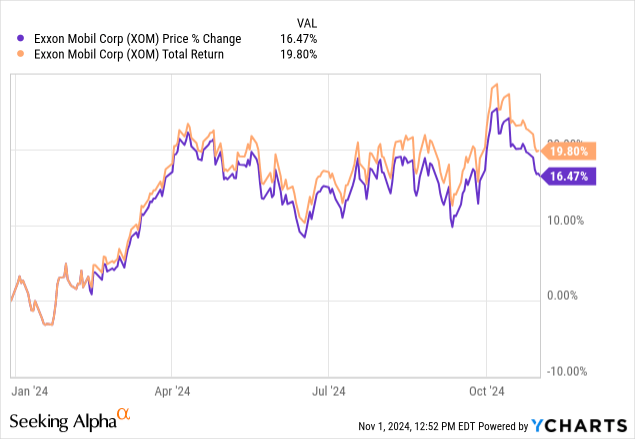
At one point this year Exxon did have a total return that exceeded the S&P 500 (SPY), but has since receded to about 19.8% in TR whereas the S&P 500 is a tad over 20%
This has actually been a good year for Exxon, especially in the face of lower oil prices.
Most recent earnings results
Exxon Mobil investor relations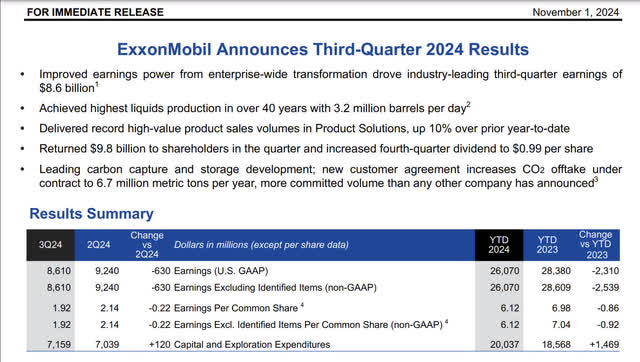
So here we find ourselves in a situation where earnings per share and free cash flow per share are in a slight downward trend. We are also near the eve of a new administration which may or may not be encouraging excess oil exploration, leading to further glut and lower oil prices. Exxon is one of the best-integrated oil majors to weather that kind of storm, with energy products being the leading revenue exposure segment versus upstream. However, forward earnings will still see a net negative effect on the bottom line, most likely in this situation.
Additional info from the most recent quarter:
Brent averaged $80/bbl in 3Q24, down ~$5/bbl vs. prior quarter, reflecting uncertainty in supply and demand balances
• Natural gas prices improved during 3Q24 supported by summer demand and supply concerns in Europe
• Refining margins weakened during 3Q24 as record global demand was more than met by additional supply
• Chemical margins improved slightly vs. 2Q24 due to lower North America feed costs; industry remained at bottom-of cycle conditions driven by Asia Pacific.
On top of the drop in oil prices, refining margins will still trend lower with oil if demand doesn’t pick up for gasoline, jet fuel and diesel. China is still largely to blame for this as their economy stagnates.
Share price versus WTI trends
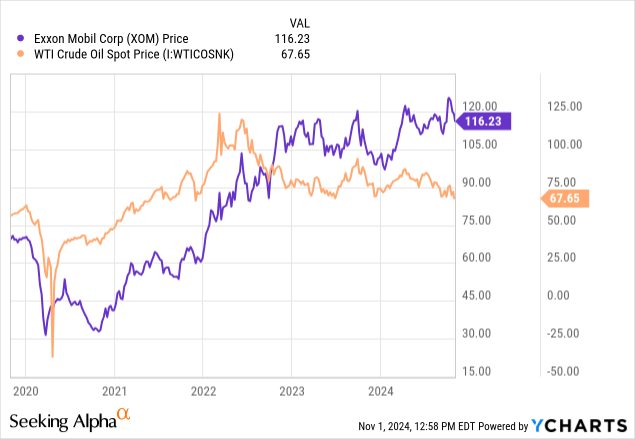
Speaking of lower oil prices, here is the price action of Exxon Mobil for the past 5 years versus the price of spot WTI crude oil. Exxon has been able to maintain its elevated price above crude, which is in large part because the company is well diversified amongst energy products like gasoline and diesel, as well as petrochemical by-products. In fact, upstream is now only about 11% of their revenue exposure, with energy products being the meat of the business at 77%.
Reflexive trends
On a 5-year basis
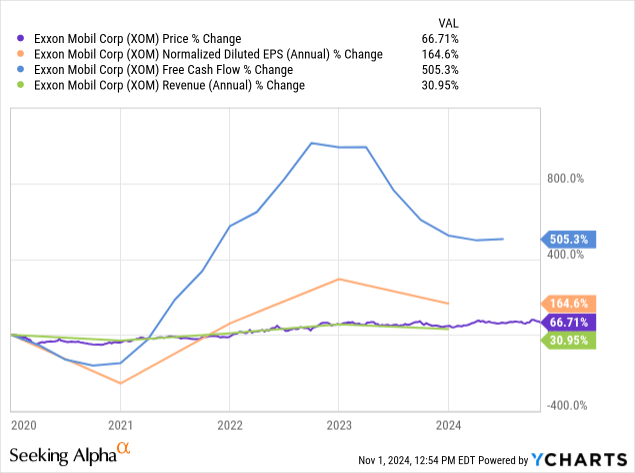
Even though Exxon Mobil has had a major rebound in free cash flow and earnings per share since the Covid break down in oil prices, revenue has only increased 30.95% versus the other profitability metrics that are well ahead of price growth in this 5-year period [2019-ytd]. Even though buyers at the bottom in 2020 have witnessed excellent total returns, the stock itself is only up 66.71% in this 5-year look-back.
On a 10-year basis
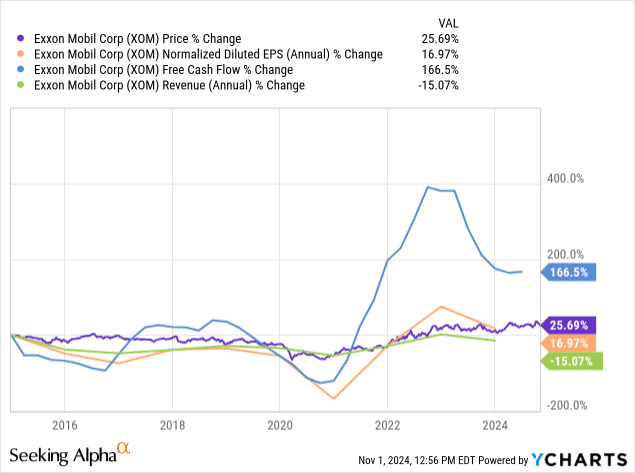
Looking out even further on a 10-year basis, the stock price has pretty much followed bottom-line profitability metrics, but the top line is really the issue hurting Exxon at this time. With the closing of the Pioneer deal in May, I would hope to see revenue growth in future years based on the acquisition, but some profitability measures per share will be offset by the dilution this deal created since it was an all stock transaction.
Revenue exposure
Data courtesy Exxon Mobil Q2 2024 Data:
| Segment | 3 Months ended June 30,2024 | Percent of total |
| Upstream US | 6729 | 7.47% |
| Upstream non-US | 3317 | 3.68% |
| Energy Products US | 26415 | 29.35% |
| Energy Products non-US | 43014 | 47.8% |
| Chemical Products US | 2213 | 2.45% |
| Chemical Products non-US | 3620 | 4.02% |
| Specialty Products US | 1538 | 1.7% |
| Specialty Products non-US | 3115 | 3.46% |
| Corporate and Financing | 25 | .02% |
| Total | 89986 |
This is an area that still keeps me invested in Exxon Mobil for the long run. Although they are fully integrated with upstream and downstream segments, I do like their large exposure to end energy products as the largest slice of the revenue pie currently. In the case of Chevron (CVX), they are more exposed upstream, with about 21% exposure as of the most recent quarter data.
The dividend, growth and free cash flow coverage
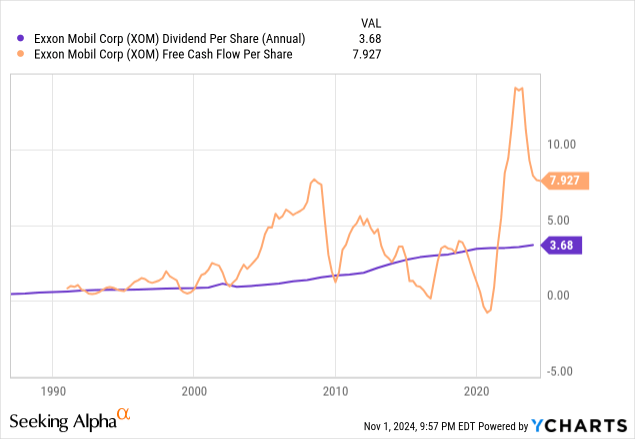
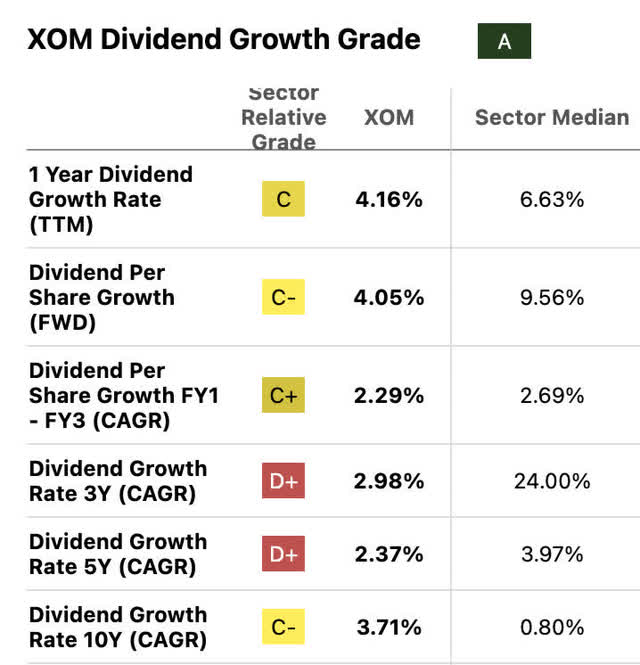
The Exxon dividend when looking at free cash flow per trend numbers is well covered and really only faced issues during the Covid collapse in oil and gas demand. At 42 years of dividend growth, this is one of the most reliable payers in the oil and gas sector. The dividend growth, however, is very slow and steady, with Exxon being very careful due to the cyclical nature of their business.
Growth
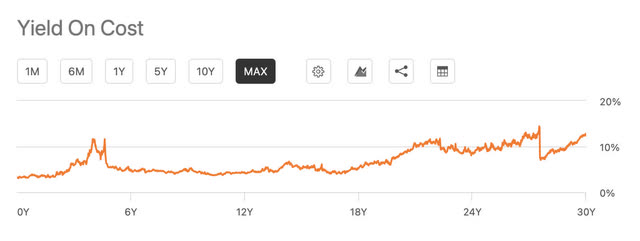
Yield on cost
Case in point of the slow growth I mentioned. An owner of Exxon stock from 30 years ago has a nice yield on cost in excess of 10%, but most dividend aristocrats and kings I’ve reviewed normally have a yield on cost of 30% or more if you’ve held for 30 years +. As you can see with the spike in yield on the left-hand side of the chart, the Covid dip buyers were able to grab a rare yield on cost similar to the 30-year holders.
This is a good-sized, reliable dividend, just don’t expect it to grow at a fast rate.
Balance sheet
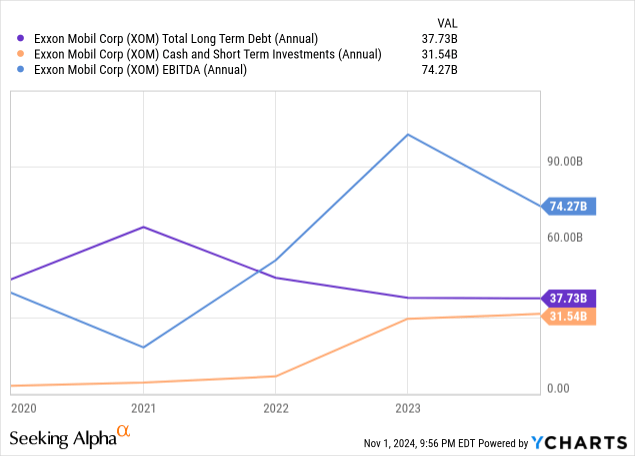
Like all the oil and gas majors, they run a very conservative balance sheet, with long-term debt nearly equivalent to cash on the balance sheet. With borrowing in the oil and gas sector becoming more difficult with green energy ESG initiatives hindering leveraging in this sector. This is still a great and mostly self funding balance sheet. EBITDA runs way ahead of long-term debt, so there is a lot of room to leverage if ever needed, but probably not at favorable rates due to the sector they operate in.
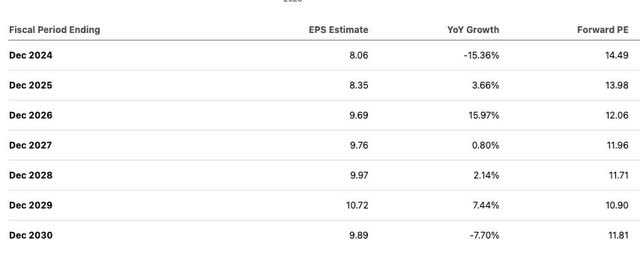
Analyst growth expectations
Growth estimates are pretty flat looking in the next 5 years, with an overall upward trajectory, but won’t exceed 2023 EPS until 2026. So overall, these are negative bottom line growth rates if we look at the 5-year time frame of 2022 to 2027.
Valuation
| STOCK | TTM EPS | BOOK VALUE | GRAHAM NUMBER | DISCOUNT/PREMIUM |
| XOM | 8.35 | 59.9 | 106.08 | 107% |
| CVX | 9.1 | 86.27 | 132.90 | 115% |
| OXY | 4.37 | 26.24 | 50.79 | 97.5% |
Looking at the integrated oil majors and their discount or premium to the Graham Number, 2 of these 3 names are now trading at a premium to the Graham Number, and only Occidental Petroleum is trading at a discount. Occidental also has the highest upstream revenue exposure of the 3 so the discount may be factoring in expected lower oil prices going forward. Exxon is still probably the best of the 3 if we face declining oil prices.
Risks and summary
The direction of oil is uncertain, based on this upcoming election I believe oil prices could be in for a prolonged dip in a Trump victory or could maintain elevated prices in a Harris administration. A dip into the territory of $107 or below would be a good time to start adding in my opinion for Exxon Mobil, and as I mentioned earlier, could be the best out of these 3 integrated oil majors to have sustainable margins in either a high volume oil glut environment or a restrictive environment. Hold.
Analyst’s Disclosure: I/we have a beneficial long position in the shares of XOM, OXY, CVX either through stock ownership, options, or other derivatives. I wrote this article myself, and it expresses my own opinions. I am not receiving compensation for it (other than from Seeking Alpha). I have no business relationship with any company whose stock is mentioned in this article.
The information provided in this article is for general informational purposes only and should not be considered as financial advice. The author is not a licensed financial advisor, Certified Public Accountant (CPA), or any other financial professional. The content presented in this article is based on the author's personal opinions, research, and experiences, and it may not be suitable for your specific financial situation or needs.
Seeking Alpha’s Disclosure: Past performance is no guarantee of future results. No recommendation or advice is being given as to whether any investment is suitable for a particular investor. Any views or opinions expressed above may not reflect those of Seeking Alpha as a whole. Seeking Alpha is not a licensed securities dealer, broker or US investment adviser or investment bank. Our analysts are third party authors that include both professional investors and individual investors who may not be licensed or certified by any institute or regulatory body.


