Summary:
- The P/E ratio is not an effective measure of a company’s valuation in our view, which is primarily based on its net cash position and future free cash flow expectations.
- AT&T has a large net debt position, a capital-intensive business model, and deteriorating free cash flow, which are the worst qualities when it comes to assessing cash-based intrinsic value.
- A back-of-the-envelope intrinsic value calculation suggests there could be more downside to come for AT&T, even as our fully-populated three-stage DCF-derived fair value range remains slightly more optimistic.
- Despite a seemingly attractive dividend yield, AT&T’s cash-based sources of intrinsic value indicate that its dividend is far from safe. We think another dividend cut in the coming years cannot be ruled out.
Brandon Bell
By Brian Nelson, CFA
People love shortcuts. It’s understandable. If there is an easier way to do something, why not, right? But there’s one shortcut I wish investors wouldn’t take, and it is using multiple analysis as a form of valuation. This may sound sacrilege, but the P/E ratio tells you very little about a company’s value. It’s just not helpful in my opinion. The value of a stock is based almost entirely on its net cash position on the balance sheet and expectations of its future free cash flow – and earnings, or the E in the denominator of the P/E ratio, says very little about a company’s cash-based sources of intrinsic value, or that which is a key driver behind a company’s share price.
The story of AT&T (NYSE:T) is an important cautionary tale. The company is reeling over concerns about potential liabilities associated with lead cables, but the company’s financials should have been enough to steer one away from the stock. If you’re wondering whether to consider buying or selling AT&T at this point, you’ve probably been focusing on many of the wrong things when it comes to investing. For starters, AT&T has two of the worst qualities when it comes to intrinsic-value considerations: 1) Net debt stood at $134.7 billion at the end of the first quarter of 2023, and 2) deteriorating free cash flow generation (with the company shelling out billions in capital expenditures in the first quarter of 2023) whereupon the firm’s dividend liabilities in the quarter were twice as much as its free cash flow generation.
These types of companies are the worst kind of companies in the world, in my view. They have huge net debt positions, substantial capital-expenditure requirements (they are capital-intensive), and are currently experiencing dwindling free cash flow, while the market remains beholden to their dividend, which may not be sustained even under normalized conditions. Now, all of this plus contingent legal liabilities associated with lead cables. The outcome of what could happen to AT&T and Verizon (VZ) regarding lead cables and their impact on the environment is a very important consideration, but it certainly shouldn’t be the only reason why you should be running away from these types of stocks. I don’t care about their dividend yields. Their cash-based sources of intrinsic value are absolutely horrible.
Let’s back up a bit and talk about what drives intrinsic value and how the stock market works. The market tries to uncover a fair price of a stock through buying and selling. Those that believe a stock is undervalued will buy the stock, driving the stock higher to what they believe is intrinsic value. Those that believe a stock is overvalued will sell the stock, driving the stock lower to what they believe is its intrinsic value. Both buyers and sellers drive the stock higher and lower, respectively, to uncover what may be the market’s opinion of the stock’s intrinsic value. Some investors are sophisticated while others are not, but the “wisdom of crowds” generally prevails with the market price being a good approximation of a company’s intrinsic value, most of the time.
Now, what is the market looking at in determining a company’s intrinsic value? A company’s intrinsic value is a function of net cash on the balance sheet and future expected free cash flows. One sums up a company’s net cash position and future expected discounted enterprise free cash flows and then divides that sum by diluted shares outstanding. For AT&T, however, the company has a huge net debt position (not a net cash position), and its capital expenditures of $4.3 billion in the first quarter alone eroded most of the company’s operating cash flow of $6.7 billion. Here, we can see that it is because the firm is overleveraged and extremely capital intensive that it has a low P/E ratio. Its intrinsic value per share and share price are weighed down heavily by these dynamics, while its accounting earnings are not, resulting in a deceptively low P/E ratio.
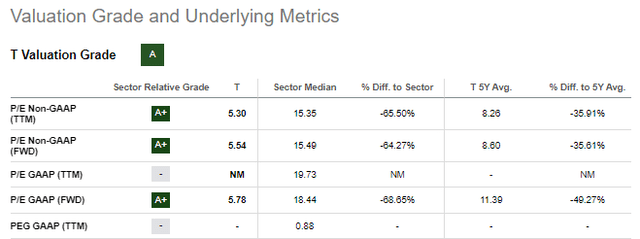
AT&T’s forward P/E is in the single digits. (Seeking Alpha)
Here, we have a company in AT&T with the worst dynamics when it comes to cash-based intrinsic value, but most investors may be licking their chops over a forward P/E ratio of about 5-6x (image above). However, let’s talk real valuation for AT&T, first doing a back-of-the-envelope calculation for the company for illustrative purposes. If we assume that AT&T generates ~$16.2 billion in annual free cash flow going forward, a level that it achieved last year, and using a steady-state perpetuity with a 8% discount rate, equity value before accounting for its massive net debt position, is ~$200 billion [$16.2 billion / 0.08]. Deducting the company’s ~$135 billion net debt position, one could see a reasonable valuation of AT&T’s equity of around ~$65 billion, which is approximately 65% of its stock market capitalization of nearly $100 billion at the time of this writing.
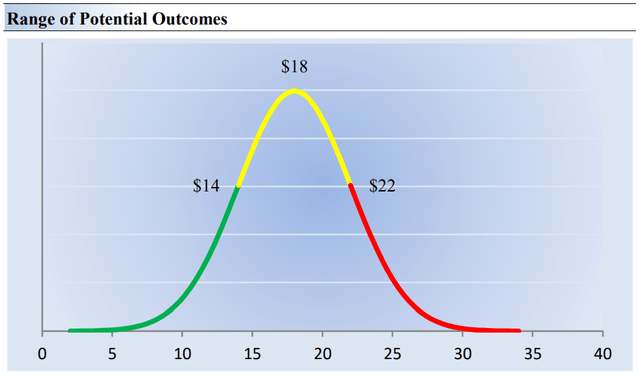
AT&T’s fair value estimate range. (Valuentum)
Let’s not get ahead of ourselves. I’m not saying that we value AT&T at 65% of its existing price (market capitalization). We don’t. But what I am saying is that the market could easily value AT&T 30%-40% lower than even today’s depressed levels, and it still might make sense for a lot of investors based on this analysis. After all, operating cash flow in the first quarter of this year was down over 12% on a year-over-year basis, while capital spending was essentially flat. With that said, our fully-populated, three-stage discounted cash-flow derived fair value estimate range (which is far more involved than the illustrative back-of-the-envelope calculation) is much more optimistic than the back-of-the-envelope valuation calculation. It has a higher per-share fair value estimate range than that implied by the back-of-the-envelope calculation. But the point is nonetheless valid: There could be even more downside than even the low end of our fair value estimate range.
With all these moving parts at AT&T (and now potential liabilities associated with lead cables), it’s important to apply the concept of a margin of safety within the analytic context. Our discounted cash flow process values each firm on the basis of the present value of all future free cash flows. Though we estimate AT&T’s fair value at about $18 per share, every company has a range of probable fair values that’s created by the uncertainty of key valuation drivers such as future earnings or future free cash flow. After all, if the future were known with certainty, we wouldn’t see much volatility in the markets as stocks would trade precisely at their known fair values. In the image above, we show this probable range of fair values for AT&T. We think the firm may be attractive below $14 per share (the green line), but quite expensive above $22 per share (the red line). The prices that fall along the yellow line, which includes our fair value estimate, represent a reasonable valuation for the firm, in our opinion. That said, however, we would not be surprised if shares continue to be under considerable pressure.
That’s not all to be concerned about either. These cash-based sources of intrinsic value that are important to the DCF framework also factor into a company’s future expected dividend health. For example, a company with substantial net cash on the balance sheet is much better able to meet future expected dividend obligations, while a company that generates free cash flow far in excess of cash dividends paid has improved financial flexibility to cover the payout and potentially deleverage. Though we expect AT&T to eventually improve its free cash flow to be able to cover its payout in the near term (as a dynamic that is also reflected in our DCF-derived fair value estimate range), the long-term picture still isn’t great, especially as it relates to its dividend. Here is how we think about AT&T’s long-term dividend health.
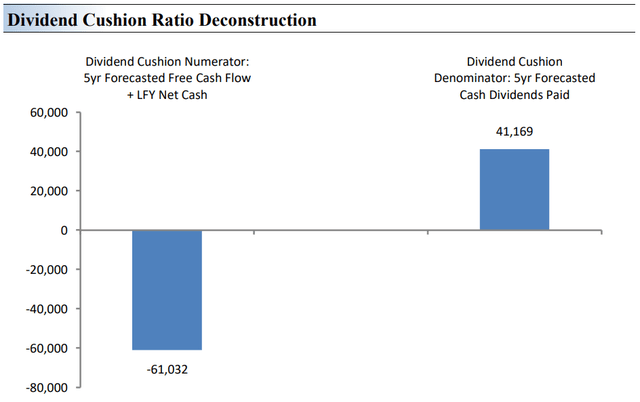
AT&T’s Dividend Cushion Ratio Deconstruction (Valuentum)
We like to use the Dividend Cushion ratio in our analysis. In the image above, we reveal the numerator and denominator of the Dividend Cushion ratio. At the core, the larger the numerator, or the healthier a company’s balance sheet and future free cash flow generation, relative to the denominator, or a company’s cash dividend obligations, the more durable the dividend. In the context of the Dividend Cushion ratio, AT&T’s numerator is smaller than its denominator suggesting weak dividend coverage in the future. Its Dividend Cushion ratio stands at -1.2, where we would prefer companies have Dividend Cushion ratios far greater than 1 to be considered healthy.
The image above puts sources of free cash in the context of financial obligations next to expected cash dividend payments over the next 5 years on a side-by-side comparison. Because the Dividend Cushion ratio and many of its components are forward-looking, our dividend evaluation may change upon subsequent updates as future forecasts are altered to reflect new information, but AT&T’s dividend health looks bleak. Any contingent liabilities associated with lead cables would only further jeopardize its already-fragile dividend health. Things are looking pretty dire at AT&T these days.
Concluding Thoughts
AT&T’s forward estimated dividend yield of 8%+ may seem attractive at face value, but the company’s cash-based sources of intrinsic value are horrible. Not only is the company saddled with a tremendous amount of net debt to the tune of a whopping $134.7 billion, resulting in an annualized net debt to adjusted EBITDA ratio of 3.22x, but the company operates a capital-intensive model that eats into its operating cash flow.
AT&T continues to have trouble figuring out how to stabilize free cash flow and grow it, too, and for those reasons, we doubt the market may ever grow comfortable in the sustainability of its payout going forward, particularly considering the recent dividend cut. AT&T’s Dividend Cushion stands at -1.2 (negative 1.2), indicating very poor dividend quality, and we have no interest in AT&T’s shares, which are trading at levels first reached decades ago. There could be further downside to come. As our October 2022 article noted, we remain cautious.
This article and any links within are for informational and educational purposes only and should not be considered a solicitation to buy or sell any security. Valuentum is not responsible for any errors or omissions or for results obtained from the use of this article and accepts no liability for how readers may choose to utilize the content. Assumptions, opinions, and estimates are based on our judgment as of the date of the article and are subject to change without notice.
Analyst’s Disclosure: I/we have no stock, option or similar derivative position in any of the companies mentioned, and no plans to initiate any such positions within the next 72 hours. I wrote this article myself, and it expresses my own opinions. I am not receiving compensation for it (other than from Seeking Alpha). I have no business relationship with any company whose stock is mentioned in this article.
Brian Nelson owns shares in SPY, SCHG, QQQ, DIA, VOT, BITO, RSP, and IWM. Valuentum owns SPY, SCHG, QQQ, VOO, and DIA. Brian Nelson's household owns shares in HON, DIS, HAS, NKE, DIA, and RSP. Some of the other securities written about in this article may be included in Valuentum's simulated newsletter portfolios. Contact Valuentum for more information about its editorial policies.
Seeking Alpha’s Disclosure: Past performance is no guarantee of future results. No recommendation or advice is being given as to whether any investment is suitable for a particular investor. Any views or opinions expressed above may not reflect those of Seeking Alpha as a whole. Seeking Alpha is not a licensed securities dealer, broker or US investment adviser or investment bank. Our analysts are third party authors that include both professional investors and individual investors who may not be licensed or certified by any institute or regulatory body.
