
Summary:
- GameStop will share its Q4 2023 earnings on March 26 after market close.
- I expect GameStop to beat analysts’ estimates for revenue and EPS on strong video game sales in Q4 and prudent cost management.
- My price target for GameStop stock is $21.18 per share, implying 62% upside.
Dennis Diatel Photography
While its stock is nowhere near the peak it reached during the meme stock mania of 2021, GameStop Corp. (NYSE:GME) has the potential to rebound from current levels, in my opinion, when it posts its Q4 and full year 2023 results on March 26 after market close. Analysts expect the video game retailer to report Q4 revenue of $2.05 billion and an EPS of $0.25, whereas full year estimates are for $5.53 billion in revenue and an EPS of $0.13.
That said, I expect GameStop to beat analysts’ estimates due to stronger video game sales in the holiday season compared to 2022. Although my model forecasts another YoY decline in sales, I don’t believe the projected decline warrants the discount the stock is trading at relative to its peers. As such, I’m rating GameStop as a buy with a price target of $21.18 per share, representing 62% upside from current levels.
Video Game Sales Rebound
Since GameStop is a video game retailer, the company’s sales are impacted by the strength or weakness in consumer spending on video games. In 2021, US consumer spending on video games reached $60.4 billion driven by strong demand for next-gen consoles PlayStation 5 and Xbox Series X.
In 2022, however, US consumer spending on video games declined 5% YoY to $56.6 billion mainly due to a light slate of new releases and macroeconomic conditions that led consumers to change their spending patterns. As a result, GameStop’s 2022 sales saw a 1.4% decline. While some may argue that GameStop’s declining sales are mainly due to its outdated brick and mortar business model, I don’t share that view as there’s still demand for buying video games from physical locations.
A survey conducted by YouGov last August found that 16% of US gamers show preference for purchasing video games at a physical store. Given that the number of video gamers in the US is estimated to be 212.6 million, this means that GameStop has an addressable market of more than 34 million gamers in the US.
With that in mind, video game spending in the US increased in 2023 to $57.2 billion driven by a strong holiday season where video game sales reached $7.91 billion in the period from November 26th to December 30th. According to Circana’s executive director of video games, Mat Piscatella, the spike in video game sales in 2023 was due to “one of the best release slates in industry history”.
Revenue Projection
The aforementioned information is critical to forecast GameStop’s revenues for Q4 and the full year 2023. GameStop realizes revenues from the sale of hardware, accessories, software, and collectibles. The video game segment in the company’s revenue comprises hardware, accessories, and software. Meanwhile, the collectibles segment includes the sales of action figures, replicas, and trading cards.
In terms of the video game segment, GameStop’s revenues from hardware, accessories, and software represented 8.59% of total video game spending in 2021 and 8.77% in 2022. As such, I’m forecasting GameStop’s share of 2023’s total video game spending to be 8.68% representing its average share in the past 2 years. Based on this, my projection for GameStop’s full year revenues from hardware, accessories, and software to be $4.9 billion which would result in this segment realizing just more than $2 billion in Q4 2023.
GME’s earnings reports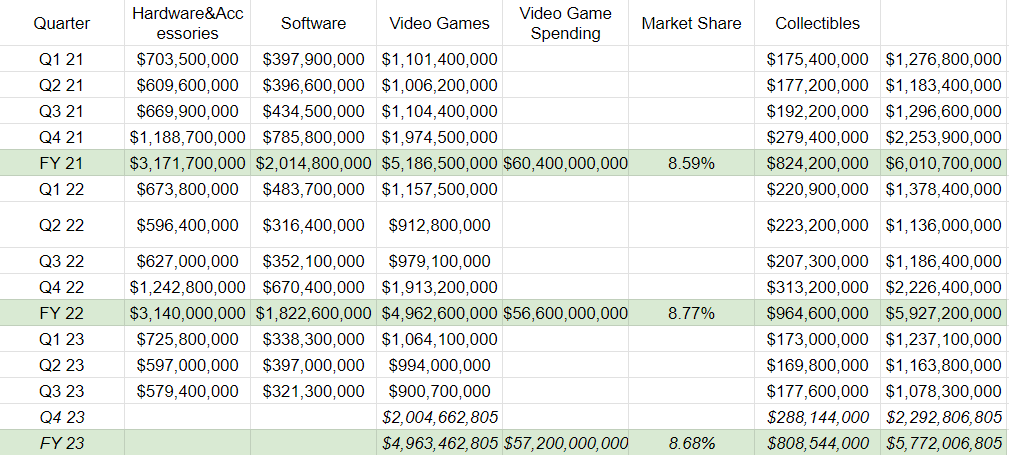
As for the collectibles segment, toy sales declined 8% in 2023 in unit sales and dollar terms. Even in the holiday season, toy sales declined 8% in dollar terms and 6% in unit sales. This means that shoppers bought fewer toys and also traded down in prices to cheaper toys. As such, I’m forecasting GameStop’s collectibles revenue to decline 8% YoY given its 28% market share in the US collectibles toys market. Such a decline means that my projection for GameStop’s collectibles revenue for the full year 2023 is $808.5 million resulting in Q4 revenue of $288.1 million.
Based on my projections for GameStop’s video game and collectibles segments, I expect the company to report Q4 revenues of almost $2.3 billion and full year revenue of $5.7 billion. These figures are higher than analysts’ estimates of $2.05 billion and $5.53 billion, respectively.
|
Revenue Segment |
Q4 |
Full Year |
|
Video Games |
$2,004,662,805 |
$4,963,462,805 |
|
Collectibles |
$288,144,000 |
$808,544,000 |
|
Total Revenue |
$2,292,806,805 |
$5,772,006,805 |
EPS Projection
Moving on to the rest of GameStop’s income statement, the company’s gross margin averaged 25.1% in the first 3 quarters of 2023 which is my projection for Q4’s gross margin. This would be in line with GameStop’s historical performance as Q4’s gross margin is less than Q3, resulting in a gross profit of 25.18% for the full year. Therefore, I’m projecting the company’s cost of revenue for Q4 and the full year to be $1.7 billion and $4.3 billion, respectively, leading to gross profits of $362.8 million and $1.3 billion, respectively.
|
Quarter |
Revenue |
CoR |
Gross Profit |
Gross Margin |
|
Q1 21 |
$1,276,800,000 |
$946,700,000 |
$330,100,000 |
25.85% |
|
Q2 21 |
$1,183,400,000 |
$862,500,000 |
$320,900,000 |
27.12% |
|
Q3 21 |
$1,296,600,000 |
$978,000,000 |
$318,600,000 |
24.57% |
|
Q4 21 |
$2,253,900,000 |
$1,875,700,000 |
$378,200,000 |
16.78% |
|
FY 21 |
$6,010,700,000 |
$4,662,900,000 |
$1,347,800,000 |
22.42% |
|
Q1 22 |
$1,378,400,000 |
$1,079,900,000 |
$298,500,000 |
21.66% |
|
Q2 22 |
$1,136,000,000 |
$853,800,000 |
$282,200,000 |
24.84% |
|
Q3 22 |
$1,186,400,000 |
$894,800,000 |
$291,600,000 |
24.58% |
|
Q4 22 |
$2,226,400,000 |
$1,726,600,000 |
$499,800,000 |
22.45% |
|
FY 22 |
$5,927,200,000 |
$4,555,100,000 |
$1,372,100,000 |
23.15% |
|
Q1 23 |
$1,237,100,000 |
$949,800,000 |
$287,300,000 |
23.22% |
|
Q2 23 |
$1,163,800,000 |
$857,900,000 |
$305,900,000 |
26.28% |
|
Q3 23 |
$1,078,300,000 |
$796,500,000 |
$281,800,000 |
26.13% |
|
Q4 23 |
$2,292,806,805 |
$1,714,698,633 |
$578,108,172 |
25.21% |
|
FY 23 |
$5,772,006,805 |
$4,318,898,633 |
$1,453,108,172 |
25.18% |
In terms of operating costs, the company only recognizes selling, general, and administrative costs as well as asset impairments. Since the company hasn’t recognized any impairment charges since Q4 2022, I’m not projecting any impairment charges in 2023.
As for selling, general, and administrative costs, GameStop has managed this cost to represent 27% of revenues in the first 3 quarters of 2023. Meanwhile, this cost has historically increased by 22.37% QoQ in Q4 due to the seasonality of GameStop’s business. Based on this, I’m projecting selling, general, and administrative costs to be $362.8 million in Q4, leading the full year figure to be $1.3 billion.
|
Quarter |
SG&A |
QoQ Change |
|
Q1 21 |
$370,300,000 |
|
|
Q2 21 |
$378,900,000 |
2.32% |
|
Q3 21 |
$421,500,000 |
11.24% |
|
Q4 21 |
$538,900,000 |
27.85% |
|
FY 21 |
$1,709,600,000 |
– |
|
Q1 22 |
$452,200,000 |
-16.09% |
|
Q2 22 |
$387,500,000 |
-14.31% |
|
Q3 22 |
$387,900,000 |
0.10% |
|
Q4 22 |
$453,400,000 |
16.89% |
|
FY 22 |
$1,681,000,000 |
– |
|
Q1 23 |
$345,700,000 |
-23.75% |
|
Q2 23 |
$322,500,000 |
-6.71% |
|
Q3 23 |
$296,500,000 |
-8.06% |
|
Q4 23 |
$362,825,125 |
22.37% |
|
FY 23 |
$1,327,525,125 |
– |
Based on my projections, I expect GameStop to post an operating income of $215.2 million in Q4 and $125.5 million for the full year, leading to operating margins of 9.4% and 2.2%, respectively.
|
Quarter |
Gross Profit |
% of Revenue |
Impairment |
Operating Income/Loss |
Operating Margin |
|
Q1 21 |
$330,100,000 |
29.00% |
$600,000 |
-$40,800,000 |
-3.20% |
|
Q2 21 |
$320,900,000 |
32.02% |
$0 |
-$58,000,000 |
-4.90% |
|
Q3 21 |
$318,600,000 |
32.51% |
$0 |
-$102,900,000 |
-7.94% |
|
Q4 21 |
$378,200,000 |
23.91% |
$6,100,000 |
-$166,800,000 |
-7.40% |
|
FY 21 |
$1,347,800,000 |
28.44% |
$6,700,000 |
-$368,500,000 |
-6.13% |
|
Q1 22 |
$298,500,000 |
32.81% |
$0 |
-$153,700,000 |
-11.15% |
|
Q2 22 |
$282,200,000 |
34.11% |
$2,500,000 |
-$107,800,000 |
-9.49% |
|
Q3 22 |
$291,600,000 |
32.70% |
$0 |
-$96,300,000 |
-8.12% |
|
Q4 22 |
$499,800,000 |
20.36% |
$200,000 |
$46,200,000 |
2.08% |
|
FY 22 |
$1,372,100,000 |
28.36% |
$2,700,000 |
-$311,600,000 |
-5.26% |
|
Q1 23 |
$287,300,000 |
27.94% |
$0 |
-$58,400,000 |
-4.72% |
|
Q2 23 |
$305,900,000 |
27.71% |
$0 |
-$16,600,000 |
-1.43% |
|
Q3 23 |
$281,800,000 |
27.50% |
$0 |
-$14,700,000 |
-1.36% |
|
Q4 23 |
$578,108,172 |
15.82% |
$0 |
$215,283,047 |
9.39% |
|
FY 23 |
$1,453,108,172 |
23.00% |
$0 |
$125,583,047 |
2.18% |
This leaves interest income, other losses, and tax benefits to forecast in GameStop’s income statement. For these items, I’ll be using the same figures as Q3 2023. However, these items could vary from my projections depending on how GameStop managed its cash holdings in Q4 2023.
Accordingly, I’m projecting GameStop to report a Q4 net income of $226.8 million and a full year net income of $170.4 million, leading to EPS of $0.74 and $0.56, respectively. These projections are higher than analysts’ estimates of a Q4 EPS of $0.25 and a full year EPS of $0.13.
|
Q4 2023 |
FY 2023 |
|
|
Revenue |
$2,292,806,805 |
$5,772,006,805 |
|
CoR |
$1,714,698,633 |
$4,318,898,633 |
|
Gross Profit |
$578,108,172 |
$1,453,108,172 |
|
SG&A |
$362,825,125 |
$1,327,525,125 |
|
Operating Income |
$215,283,047 |
$125,583,047 |
|
Interest Income |
$12,900,000 |
$47,100,000 |
|
Other Loss |
$2,500,000 |
$4,900,000 |
|
Income Before Tax |
$225,683,047 |
$167,783,047 |
|
Tax Benefit |
$1,200,000 |
$2,700,000 |
|
Net Income |
$226,883,047 |
$170,483,047 |
|
OS |
305,514,315 |
305,514,315 |
|
EPS |
$0.74 |
$0.56 |
Valuation
Based on my projections, GameStop would be trading at an EV/Sales multiple of 0.62 compared to an industry average of 1.29. That said, I believe the company should still trade at a discount relative to its peers due to its declining sales which is why I have a target EV/Sales multiple of 1. Therefore, my price target for GameStop is $21.18 per share, implying 62% upside from its current share price of $13.10.
|
Projected Sales |
$5,772,006,805 |
|
EV |
$3,570,000,000 |
|
EV/Sales |
0.62 |
|
Industry Average |
1.29 |
|
Target Multiple |
1 |
|
Price Target |
$21.18 |
|
Upside |
62% |
Risks
As the core of my bullish thesis on GameStop is its potential to beat analyst estimates when it announces its full year financial results, risks to my thesis include an expected slowdown in video game spending this year due to a weaker release slate compared to 2023. As is, Circana’s Mat Piscatella is forecasting video game spending in 2024 to decline between 2% to 10% YoY. However, Piscatella expects spending to rebound in 2025 due to the much anticipated release of GTA VI.
Another risk facing GameStop is the new investment policy that allows CEO Ryan Cohen and the management team to invest in the same securities as the company, instead of the previous policy of investing in investment grade short-term income securities. As a result, GameStop’s cash balance of $909 million could dwindle rapidly if its investments turn sour.
Conclusion
With the stock trading near multi-year lows, I believe GameStop could be an opportunity at current levels ahead of its upcoming earnings report on March 26. As is, I expect the company to beat analyst estimates for revenue and EPS in light of strong video game sales in the holiday season in addition to its prudent cost management. Considering the steep decline GameStop is trading at relative to its peers, I’m rating it as a buy with a price target of $21.18 per share, implying 62% upside from its current valuation.
Analyst’s Disclosure: I/we have no stock, option or similar derivative position in any of the companies mentioned, and no plans to initiate any such positions within the next 72 hours. I wrote this article myself, and it expresses my own opinions. I am not receiving compensation for it (other than from Seeking Alpha). I have no business relationship with any company whose stock is mentioned in this article.
Seeking Alpha’s Disclosure: Past performance is no guarantee of future results. No recommendation or advice is being given as to whether any investment is suitable for a particular investor. Any views or opinions expressed above may not reflect those of Seeking Alpha as a whole. Seeking Alpha is not a licensed securities dealer, broker or US investment adviser or investment bank. Our analysts are third party authors that include both professional investors and individual investors who may not be licensed or certified by any institute or regulatory body.