Summary:
- GameStop’s shares are still up 20-25% after it reported GAAP profitability in Q4 even though GAAP profitability should’ve been expected.
- Consensus revenue estimates are too high given the current macro environment and upcoming store closures.
- GameStop’s sales, general, and administrative expenses are weighing on GameStop’s profitability, so management will have to make tradeoffs between profitability and company culture as layoffs occur.
Editor’s note: Seeking Alpha is proud to welcome Daniel B. Wilson as a new contributor. It’s easy to become a Seeking Alpha contributor and earn money for your best investment ideas. Active contributors also get free access to SA Premium. Click here to find out more »
Justin Sullivan
GameStop’s (NYSE:GME) erratic and unpredictable price action, driven by retail investors and traders, has created an opportunity for sophisticated investors. Thanks to the market overreacting after last quarter’s earnings, and revenue estimates being too high, there is now an opportunity to short GameStop. Additionally, my discounted cash flow models demonstrate that GameStop is worth 60-75% less than what it’s currently trading at, increasing the odds of a successful short trade. Various relative valuation models also confirm that GameStop is severely overvalued.
Retail Investor Expectations
When earnings were announced in March, GameStop was up ~50% at one point because it was GAAP profitable for Q4. Since then, it has shed ~25-30% of its value for good reason. Positive earnings in the last quarter should have been expected since Q4 usually accounts for ~40% of GameStop’s revenue due to the holiday season.
Given that revenues are typically much higher in Q4, GameStop’s 2.1% operating margin during this period was disappointing. For context, the industry’s average operating margin is about 4% year-round. Plus, GameStop’s overall operating margin during FY 2022 was -5.09%. Over the next few quarters, negative net income margins will deter retail investors and create selling pressure on GameStop. The shorts will soon benefit from the unwarranted net 20-25% gain being erased.
Long-Term Operating Margins
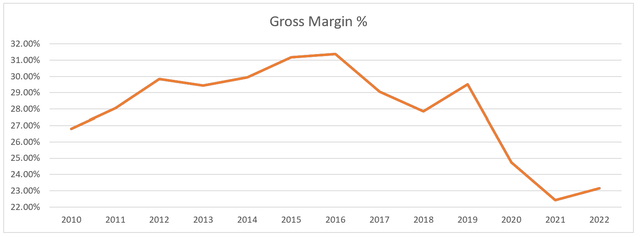
To become profitable long-term, GameStop must reduce its SG&A expenses. The chart below shows GameStop’s historical gross margins, which represent roughly the amount that management can spend on SG&A to break even.
GameStop’s gross margins have declined from 31% in 2016 to 23-24% (in line with general retail and Best Buy). Revenue from used video games declining has put pressure on gross margins. The ease of purchasing new video games online directly from software publishers, sometimes at lower prices, has reduced the demand for physical copies. As a result, the supply and demand of used video games have declined. GameStop’s gross margins for used video games were last reported at 45% in 2016, whereas gross margins for new consoles, which now make up a larger portion of the company’s revenue, were last reported at only 9%
While GameStop’s gross margin is 23-24%, GameStop’s SG&A, as a percentage of revenue, has been in the high-20s. On the other hand, Best Buy has SG&A margins of 17-19%, which means that GameStop needs to reduce its spending on SG&A by one-third to be in a similar position (and for the stock to be worth $5-$8 per share). If revenue contracts more, management will have to cut SG&A further.
Although management has indicated efforts to decrease SG&A as a percentage of revenue, it remained high throughout 2022. This raises the question of whether management can reduce SG&A expenses enough without harming the business. Although the SG&A decrease from Q4 2021 to Q4 2022 looks promising, it is misleading because it was a one-time decrease. Management could easily cut SG&A, for FQ4, by reducing its exposure to the NFT business it entered in FQ4 2021. The path to positive EBIT margins will likely be long and painful because going forward, worker layoffs may be necessary.
Revenue Decline
Analyst estimates from Yahoo Finance have GameStop’s FY 2024 revenue nearly equal to GameStop’s FY 2023 revenue. This makes little sense considering the current state of the consumer electronics market and expected store closures. In Best Buy’s latest investor presentation, the company projected a 3-6% decline in store sales due to weakening demand for consumer electronics. This should translate to lower sales for the electronics that GameStop sells, such as keyboards, consoles, and headsets. Additionally, GameStop has been aggressively reducing its store count. Since 1,723 store leases will expire in 2023, GameStop’s revenue will likely fall substantially due to management choosing not to renew them. Although the 16% decline modeled below seems on the high end, a 5-10% decline in store count is still likely.
Also, it’s worth noting that management can cut stores aggressively because they did not issue guidance in the latest conference call. Part of the reason for not issuing guidance may be because they plan on removing stores. In fact, it would be in the best interest of GameStop for management to cut non-performing stores because doing so would lead to margin expansion.
Another factor that investors aren’t talking about is the indirect cost of distress. When revenues decline consistently, the only way to maintain margins is to lay off staff. This deters talent and can ruin a company’s culture.
Put simply, analyst estimates for revenue are too high, so future revenue misses should be expected.
Valuation
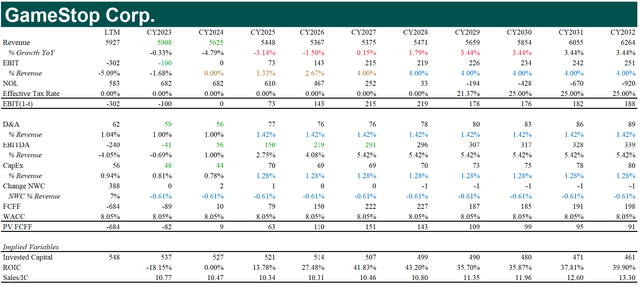
DCF #1: Optimistic Case
The Story: Management needs to close only a fraction of their stores. The worst-performing stores will be closed, increasing GameStop’s average revenue/store. Operating margins will rebound over the next few years because management will find ways to cut SG&A quickly. Gross margins will stay at 23-24% (in line with the industry).
Inputs
Revenue: median analyst estimates are used for CY2023 and CY2024. Revenue growth then moves linearly from -4.79% to 3.44% over five years (3.44% is the 10-year t-bond rate which is considered a proxy for the growth rate of the economy).
EBIT margins: median analyst estimates are used for CY 2023. Then, EBIT margins move linearly from 0% in CY2024 to 4% in CY2027 (4% is the industry average EBIT margin). EBIT margins then stay at 4% in perpetuity.
D&A: median analyst estimates are used for CY2023 and CY2024. To calculate D&A for 2025-2032, the 10-year historical average D&A/Revenue ratio (1.42%) is multiplied by the predicted revenue for each year.
Capital Expenditures (CapEx): median analyst estimates are used for CY2023 and CY2024. To calculate capital expenditures for 2025-2032, the 10-year historical average CapEx/Revenue ratio (1.28%) is multiplied by predicted revenue for each year.
Net Working Capital: The 8-year historical average (Net Working Capital)/Revenue ratio (-0.61%) is multiplied by the predicted change in revenue for each year.
Terminal Value Calculation: I assume the weighted average cost of capital (WACC) is equivalent to the return on invested capital (ROIC) in perpetuity. This assumption makes sense because GameStop faces fierce competition from online and brick-and-mortar retailers. In competitive industries, the economic returns, defined as WACC-ROIC, should go to 0. Therefore, the equation to determine the terminal value is (CY2032 FCFF rate)/(WACC-(terminal growth rate)). The terminal growth rate used is the risk-free rate (this is how NYU Professor Aswath Damodaran teaches it).
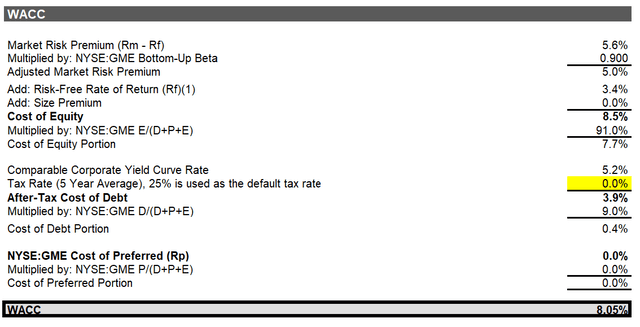
Notes: the market risk premium was pulled from Professor Aswath Damodaran’s website:
Notes: Levered beta = (unlevered beta)*(1+(1-t)*(Debt/Equity)). I assume that GameStop’s tax rate is 25% when levering up the beta.
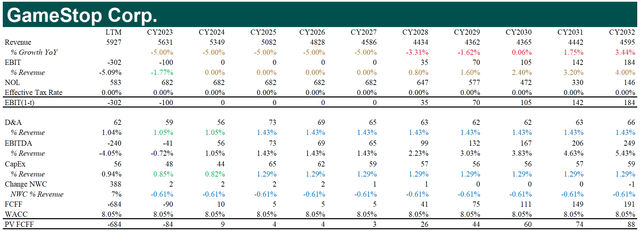
DCF #2: Pessimistic Case
Situation #2: GameStop will close approximately 5% of its stores annually, impacting its revenue. Improving GameStop’s operating margins will be challenging due to the majority of its stores being barely profitable or unprofitable. After cutting 30%+ of GameStop’s stores, management will have to rely on headcount reductions to become profitable. Over time, GameStop’s EBIT margin will move towards the industry average. Gross margins will stay at 23-24% (in line with the industry).
Inputs
Revenue: Revenue declines 5% annually from CY2023-CY2027, in line with estimated store closures over the next five years. GameStop closed 5%, 12%, and 5% of its stores in 2020, 2021, and 2022 respectively. Then, revenue growth moves linearly from -5% to 3.44% over the next five years as management needs to close fewer underperforming stores.
EBIT margins: The median analyst estimate is used for CY2023. Operating margins will be 0% from CY2024-CY2027 as management struggles to cut SG&A and store count simultaneously. Operating margins then move linearly towards the industry average operating margin of 4% as revenues stabilize.
WACC, D&A, Capital Expenditures, Net Working Capital: Same as last DCF.
Relative Valuation – Comparable Analysis
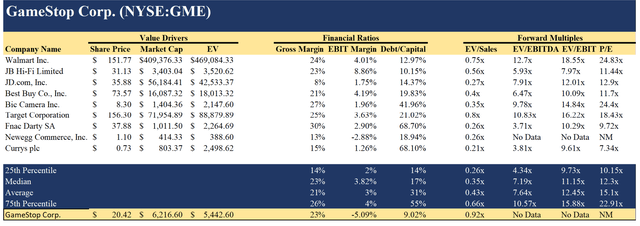
Commentary: Compared to its peer group, GameStop has the highest forward EV/Sales ratio, but the lowest operating margin. In theory, companies with higher EV/Sales ratios should have higher EBIT margins, so this doesn’t make sense. GameStop should be trading between the 25th percentile forward EV/Sales (0.26x, $6.78/share, 67% downside) and the median forward EV/Sales (0.35x, $8.53/share, 58% downside). A strong argument could also be made that GameStop should be trading between the 0th and 25th percentile forward EV/Sales ratio due to its weak fundamentals (0x-0.26x, 0$-$6.78/share, 67%-100% downside).
Relative Valuation – Regression
S&P Capital IQ The following chart is a linear regression of P/S (dependent variable) vs. net income margin (independent variable) (S&P Capital IQ)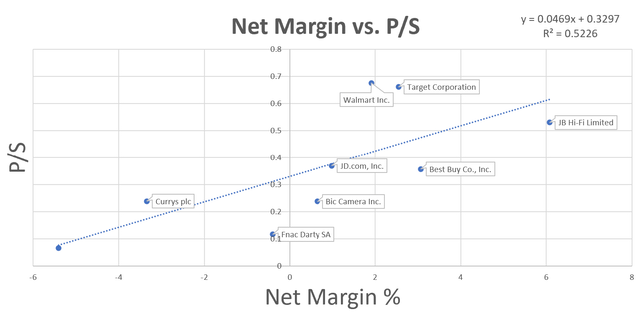

Commentary: After plugging in GameStop’s net margin into the equation P/S = 0.0469*(Net Margin %) + 0.3297, the expected P/S is 0.078 ($1.52/share, 93% downside). Of the companies that are predicted to be undervalued (points that are below the line), Best Buy (BBY) appears to be the most interesting.
Risks
GameStop currently has a short interest of 21%, which creates the risk of a short squeeze. Furthermore, GameStop is now dominated by traders rather than investors. This means its price may be subject to wild fluctuations based on trading algorithms, mood, and momentum, rather than fundamentals. Unfortunately, GameStop’s elevated volatility increases the likelihood of being stopped out of a trade. As a result, a wider stop loss will be necessary when trading GameStop, which also increases the potential downside.
It’s also worth noting that GameStop may never trade at fair value. If institutional investors are scared to go short and retail investors expect GameStop to “go to the moon” because of a short squeeze, GameStop will always trade a premium.
Conclusion
Near-term catalysts will likely drive down GameStop’s share price over the next few quarters. The degree to which GameStop is overvalued creates safety when going short.
An interesting spread trade would involve taking a long position in Best Buy and shorting GameStop. Best Buy’s excellent ROIC speaks to the quality of its business, and its valuation looks attractive. However, further research on Best Buy’s intrinsic value is advised. Overall, the risk-reward ratio of this trade seems favorable.
Analyst’s Disclosure: I/we have no stock, option or similar derivative position in any of the companies mentioned, and no plans to initiate any such positions within the next 72 hours. I wrote this article myself, and it expresses my own opinions. I am not receiving compensation for it (other than from Seeking Alpha). I have no business relationship with any company whose stock is mentioned in this article.
Seeking Alpha’s Disclosure: Past performance is no guarantee of future results. No recommendation or advice is being given as to whether any investment is suitable for a particular investor. Any views or opinions expressed above may not reflect those of Seeking Alpha as a whole. Seeking Alpha is not a licensed securities dealer, broker or US investment adviser or investment bank. Our analysts are third party authors that include both professional investors and individual investors who may not be licensed or certified by any institute or regulatory body.

