Summary:
- Sell covered calls on GM for a potential 22.7% annualized return, with GM trading at $44.75 and March’s $45.00 calls priced at $4.30.
- Earn $479 profit from call premium, stock appreciation, and dividends on a $4,475 investment if GM trades above $45.00 by March 21.
- Profit even if GM stays below $45.00, down to a net stock price of $40.21, reducing risk through covered calls.
- Selling covered calls on GM offers a strategic approach to managing uncertainty and generating consistent returns.
- GM is showing impressive improvements, and GM’s EPS and P/E ratio trends provide reasonable indications of stock price appreciation.
jetcityimage/iStock Editorial via Getty Images
Summary
- A possible 22.7% annualized return from GM, including covered call premium, price appreciation, and dividend, is possible.
- GM is showing impressive improvements.
- Announced a new $6B share repurchase authorization, on track to achieve their target of less than 1B shares.
- Good technical entry point resulting from short-term fear of vehicle overstocking announcements from competitors.
- GM EPS and P/E ratio trends provide reasonable indications for stock price appreciation.
Sell Covered Calls
My answer to uncertainty is to sell covered calls on GM six months out. GM is trading around $44.75 on September 30, 2024, and March’s $45.00 covered calls are at or near $4.30. One covered call requires 100 shares of stock to be purchased. The stock will be called away if it trades above $45.00 on March 21. It may even be called away sooner if the price exceeds $45.00, but that’s fine since capital is returned sooner.
The investor can earn $430 from the call premium, $25 from stock price appreciation, and $24 from the dividend. This totals $479 in estimated profit on a $4,475 investment, a 22.7% annualized return since the period is 172 days.
If the stock is below $45.00 on March 21, investors will still make a profit on this trade, down to the net stock price of $44.75 minus the $4.30 covered call premium and $0.24 dividend, or $40.21. Selling covered calls reduces your risk.
GM Improvements
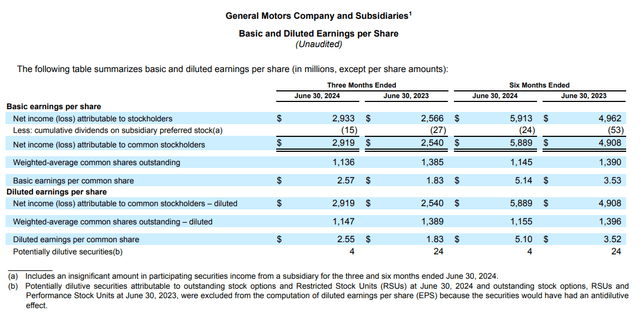
As shown in its filings, GM’s revenue grew 19.9% to $5.889B in January-June 2024 versus $4.908B in January-June 2023. Basic earnings per share jumped 45.6% from $3.53 to $5.14
GM is 88.4% owned by institutions, with only 3.5% short interest. It has a 33.2% net profit margin, with a return on equity of 21.1% and a return on invested capital of 16.6%. Google’s S&P credit rating is BBB. Only 1.7% of total assets are considered intangible, hard-to-value, non-physical assets. Its price-to-book ratio is 0.7.
81.24% of GM’s revenue comes from the U.S., so a slowdown in international markets such as China will not affect them as much.
TipRanks.com (TipRanks.com)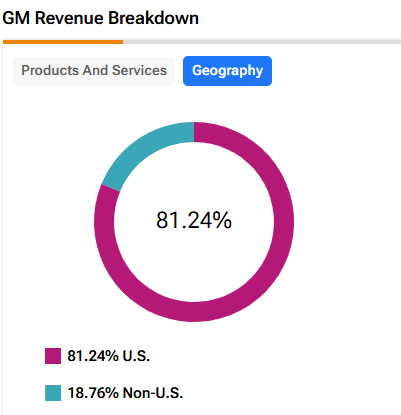
GM North America’s breakeven point of about 10-11 million units is drastically lower than it was under old GM.
GM’s underfunded pension and other post-employment benefit obligations have improved from $30.8 billion at year-end 2014 to $10.2 billion.
The company has had eight consecutive quarters of YoY U.S. retail sales growth, supporting total company revenue CAGR of ~16% over the last 24 months.
Total U.S. EV deliveries ~22K, up 40% YoY, outpacing industry growth of 11%; production continues to ramp up, guided by demand.
GM has reduced its cost base by $2 billion in 2023-2024 cuts.
GM says they will only produce to meet demand and not overstock, as recently seen by competitors.
The company has a new $6B share repurchase authorization and is on track to achieve its target of less than 1B shares.
GM Risks
Of course, GM could trade below the $40.21 breakeven point for this trade. Auto stocks often sell off severely because of macroeconomic concerns, even if the bottom-up story looks attractive.
U.S. auto ownership is facing some disruption from ride-hailing services such as Uber and Lyft, car-sharing, and autonomous vehicles. More days spent working from home instead of the office also cut into the miles driven by cars in the U.S. There is still the demand for cars even though fewer cars may drive more miles.
The EV market auto manufacturers are chasing is anything but certain. Customers are not necessarily ready to purchase EVs until prices come down, the range of use expands, and electrical supply is reassured. The fact that much of the battery supply currently comes from China and disposal of the batteries seems somewhat of an environmental hazard does not help. The EV market will expand, but the pace is not precise.
GM has more vehicles made on the same platform as ever before, which allows them to cut costs, but this also means a recall can affect millions more vehicles than in the past.
Union strikes can be a real drain on profitability. The good news is that union negotiations are not planned until the spring of 2028.
In summary, I still like this GM investment since the covered call does reduce some downside risk and most of the risks I mentioned will probably not have much impact in the next six months before the March 21 expiration date.
Technical Entry Point
The stock price declined from $67.21 on January 3 due to multiple fears. I see the September 30 trading price of $44.75 as having much of that risk already priced in.
I’ve added the red Fibonacci lines, using the high and low of the past five years for GM. It’s interesting to note how the market pauses or bounces off these Fibonacci lines. They can be one clue as to where the stock price may be headed. GM is currently at the 78.6% Fibonacci retracement level but could go lower. However, I believe that GM will trade above $45.00 by March for the reasons in this article.
ThinkOrSwim (www.ThinkOrSwim.com)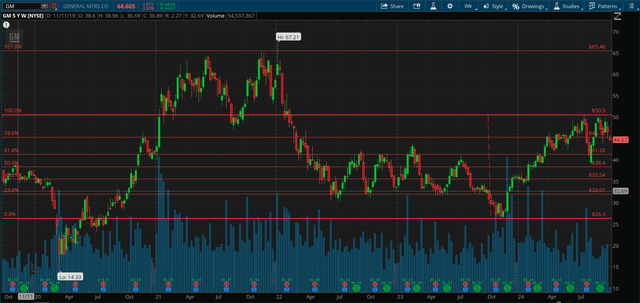
The seven most accurate analysts have an average one-year price target of $57.60, indicating an 84% potential upside from the September 30 trading price of $45.00 if they are correct. Their ratings are five buys, one hold, and one sell. Analysts are just one of my indicators, and they are not perfect, but they are usually in the ballpark with estimates or at least headed in the right direction. They often seem a bit optimistic, so I suspect prices may end up lower than their one-year targets to be on the safe side.
Trends In Earnings Per Share and P/E Ratio
The black line shows GM’s stock price for the past seven years. The numbers below the graph show that GM’s adjusted earnings were $7.07 in 2021, $7.59 in 2022, and $7.68 in 2023. They are projected to earn $10.03 in 2024, $10.02 in 2025, and $10.50 in 2026.
GM’s forward P/E ratio is currently 4.6, but if the market assigns a 6.37 P/E as it has in the past and GM earns $10.02 in 2025, the stock could eventually trade at $63.82.
FASTGraphs.com (www.FASTGraphs.com)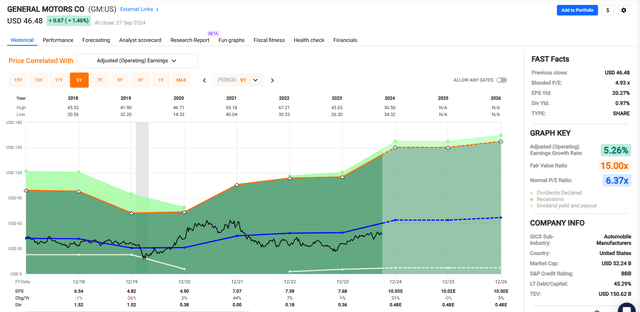
Ratings Summary and Factor Grades
GM shows buy or strong buy on all ratings and “A” or “B” on all factor grades.
SeekingAlpha.com (www.seekingalpha.com)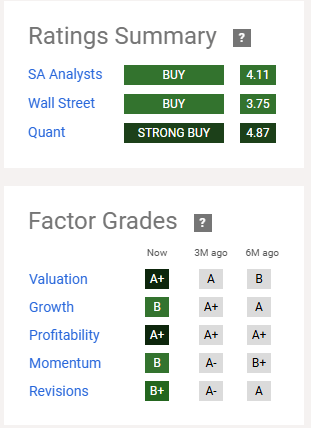
Takeaway
GM’s stock prices should rise due to its current undervaluation and improvements. Even if GM’s stock price only moves from $44.75 to $45.00 by March 21, a 22.7% potential annualized return, including the covered call premium, small price appreciation, and dividend, is possible.
Analyst’s Disclosure: I/we have no stock, option or similar derivative position in any of the companies mentioned, and no plans to initiate any such positions within the next 72 hours. I wrote this article myself, and it expresses my own opinions. I am not receiving compensation for it (other than from Seeking Alpha). I have no business relationship with any company whose stock is mentioned in this article.
Seeking Alpha’s Disclosure: Past performance is no guarantee of future results. No recommendation or advice is being given as to whether any investment is suitable for a particular investor. Any views or opinions expressed above may not reflect those of Seeking Alpha as a whole. Seeking Alpha is not a licensed securities dealer, broker or US investment adviser or investment bank. Our analysts are third party authors that include both professional investors and individual investors who may not be licensed or certified by any institute or regulatory body.

