Summary:
- The Fed is now expected to hike rates to 5.5% or even 5.75%, effectively 7.5% to 7.75%, including QT.
- The bond market is convinced a recession is coming in late 2023 or early 2024. Stocks are likely to fall 10% to 15% from here.
- But the world’s best cloud computing titans, Microsoft Corporation and Amazon.com, Inc., are good for table-pounding buys today!
- Amazon is 55% historically undervalued and has the potential for 7.5x returns in the next six years and could more than triple by 2025.
- Microsoft is 5% undervalued and offers a 120% upside over the next six years and 14% long-term returns. At its Ultra Value price of $174 (35% discount), its six-year return potential rises to 200%. However, the lowest-risk U.S. company is unlikely to fall 31% and trade at 10X cash-adjusted earnings.
FAST Graphs, Factset
This article was published on Dividend Kings on Tuesday, March 7th.
—————————————————————————————
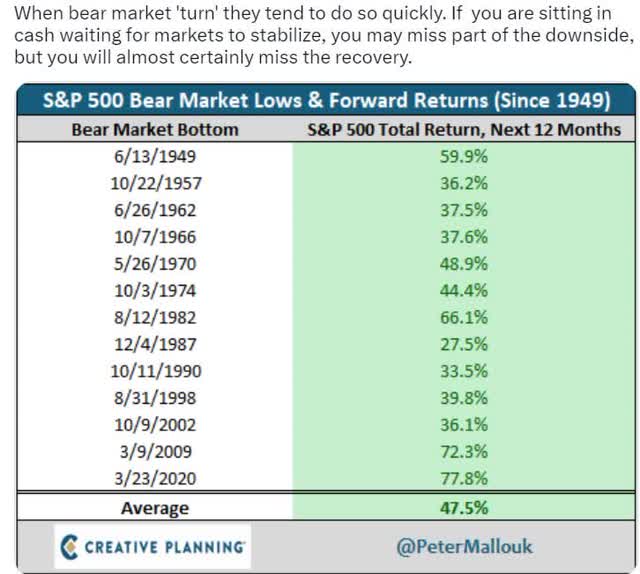
Bear markets are wonderful, though they never feel that way while you’re in them. Why? Because this is exactly the best time to buy the world’s best companies at reasonable to downright face-slapping great prices.
Bear market lows can’t be predicted with consistency. And you never know except in hindsight when they have occurred. But the rallies off the final lows are almost always astonishing.
And this is just the S&P 500 (SP500). Individual blue-chips can deliver even more incredible life-changing returns coming out of a bear market.
Consider the examples of Amazon.com, Inc. (NASDAQ:AMZN) and Microsoft Corporation (NASDAQ:MSFT), the kings of cloud computing.
What kind of 12-month returns following a bear market can you get with these world-beater growth stocks?
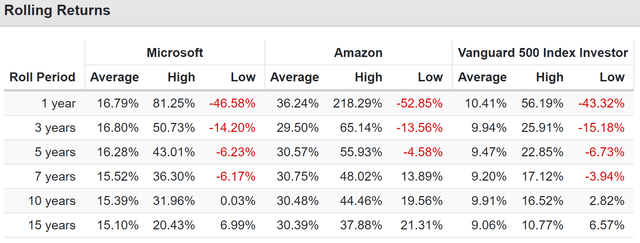
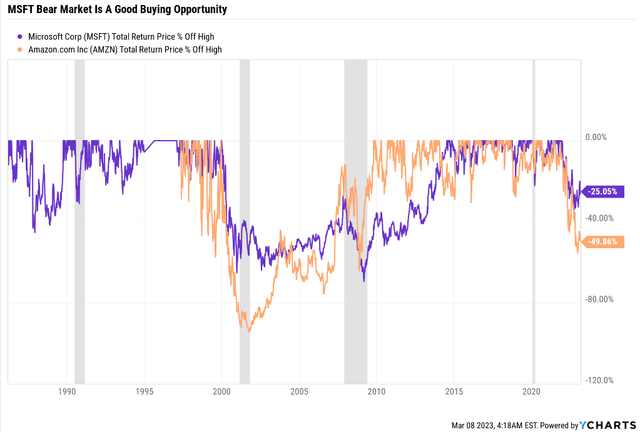
Microsoft And Amazon Rolling Returns Since The Tech Crash
Microsoft can fall almost 50% in a year but can almost double after a bear market bottoms.
Amazon can get cut in half in 12 months but can more than triple in the 12 months after a bear market low.
I’m not a market timer; none of the best investors in history are.
I can’t tell you when Amazon or Microsoft will bottom or if they already have.
But I can tell you that now is a great time to buy both cloud computing titans for the long term.
Let’s take a look at what the market is LIKELY to do in the coming months and why even if AMZN and MSFT fall more, anyone buying today is likely not to care that they missed the ultimate bottom.
What The Short-Term Market Outlook Looks Like Now
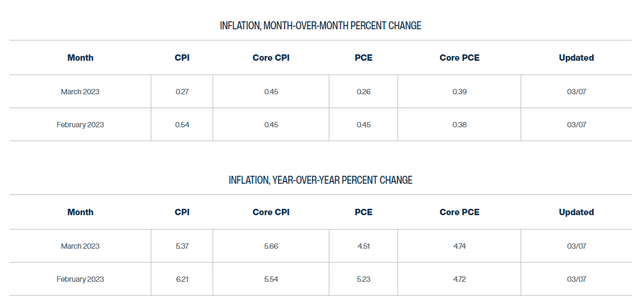
The market is obsessed with the Fed, and the Fed is obsessed with inflation data. In other words, data is driving this market.
According to the Cleveland Fed’s real-time inflation model, core inflation appears stuck at 4.7% and might remain so through the end of April.
Annualizing the month-over-month forecast for core PCE gives a reading of 4.9%. So, based on the Fed’s #1 inflation metric, inflation appears stuck at 5%.
What does this mean for the Fed?
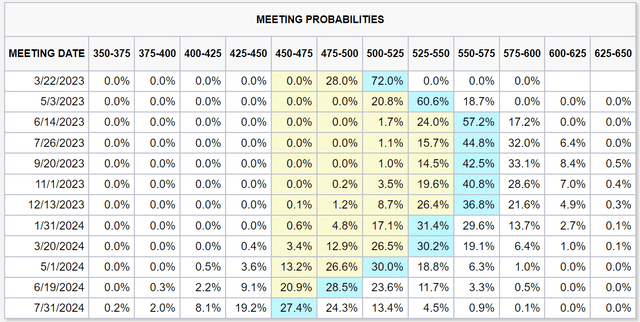
According to the bond market, it means the Fed is likely to:
- Hike 50 in March
- most likely stops at 5.5%
- a 43% chance the Fed stops at 5.75%
- is likely to cause a recession by early 2024 and cut steadily starting next year.
So what does history tell us that means for stocks and bonds?
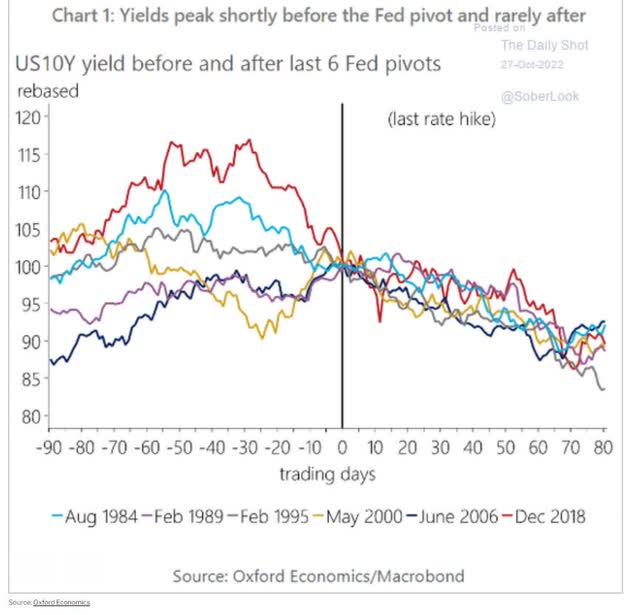
Historically 10-year yields peak one month before the Fed’s final hike.
- bond yields peak from May through August, given the current data.
What about the stock market? Historically, stocks bottom at peak earnings pessimism, which occurs halfway through a recession.
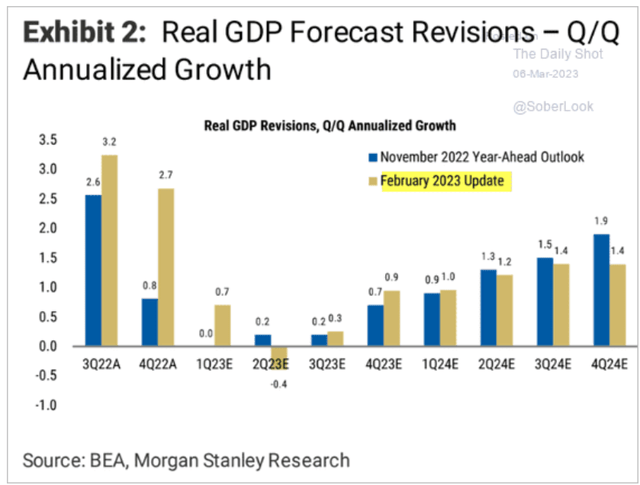
Morgan Stanley’s latest estimate for peak earnings pessimism is September 2023, though they don’t expect a recession.
Morgan Stanley expects a single negative quarter of growth in the 2nd quarter, followed by slow but accelerating growth through the end of next year.
They expect the market to likely bottom around September, potentially coinciding with the debt ceiling resolution.
- Congressional Budget Office thinks early September is the X date for the U.S. default
- S&P and Bloomberg think Congress could take it down to the wire
- like in 2011, when the debt ceiling was raised 12 hours before the U.S. default
- why S&P downgraded US to AA+ stable.
If the bond market is correct, the recession will likely begin at the end of 2023 or in Q1 2024.
- implying a potential historical market bottom sometime in Q1
- peak earnings pessimism.
So there is our reasonable and prudent POTENTIAL time frame for a market bottom. But how low might stocks fall?
S&P Bear Market Bottom Scenarios If Recession Started In The First Half Of 2023
| Earnings Decline | S&P Trough Earnings | X 25-Year Average PE Of 16.8 | Decline From Current Level | Peak Decline From Record Highs |
| 0% | 219 | 3685 | 7.8% | -23.5% |
| 5% | 208 | 3501 | 12.5% | -27.4% |
| 10% | 197 | 3316 | 17.1% | -31.2% |
| 13% (average since WWII) | 190 | 3206 | 19.8% | -33.5% |
| 15% | 186 | 3132 | 21.7% | -35.0% |
| 20% | 175 | 2948 | 26.3% | -38.8% |
(Sources: Dividend Kings S&P 500 Valuation Tool, Bloomberg.)
Had the recession begun when everyone expected it, in Q1 2023, we could expect the S&P to historically bottom around 3,200. That’s a 34% peak decline, which is also the historical average.
But if the recession is now beginning in the first half of 2024, things look a lot different.
S&P Bear Market Bottom Scenarios If Recession Started In The First Half Of 2024
| Earnings Decline | S&P Trough Earnings | X 25-Year Average PE Of 16.8 | Decline From Current Level | Peak Decline From Record Highs |
| 0% | 235 | 3947 | 1.3% | -18.1% |
| 5% | 223 | 3749 | 6.2% | -22.2% |
| 10% | 211 | 3552 | 11.2% | -26.3% |
| 13% (average since WWII) | 204 | 3434 | 14.1% | -28.7% |
| 15% | 199 | 3355 | 16.1% | -30.4% |
| 20% | 188 | 3157 | 21.0% | -34.5% |
(Sources: Dividend Kings S&P 500 Valuation Tool, Bloomberg.)
If the recession begins next year, which is looking like an increasing possibility, then the historical POTENTIAL S&P bottom is closer to 3,434:
- we hit 3,490 on October 13th, 2022.
In other words, if the recession is postponed to next year, the market’s historical average bottom would be expected to be just slightly below the October low.
S&P Bear Market Bottom Scenarios If Recession Started In The First Half Of 2025
| Earnings Decline | S&P Trough Earnings | X 25-Year Average PE Of 16.8 | Decline From Current Level | Peak Decline From Record Highs |
| 0% | 261 | 4388 | -9.7% | -8.9% |
| 5% | 248 | 4169 | -4.3% | -13.5% |
| 10% | 235 | 3949 | 1.2% | -18.0% |
| 13% | 227 | 3818 | 4.5% | -20.8% |
| 15% | 222 | 3730 | 6.7% | -22.6% |
| 20% | 209 | 3511 | 12.2% | -27.2% |
(Sources: Dividend Kings S&P 500 Valuation Tool, Bloomberg.)
The October low was the final if the recession was postponed until 2025.
- stocks might bounce around within a range
- historically; stocks achieve a new record high two years after bottoming.
Bottom Line: No One Knows When The Market Will Bottom, And It Wouldn’t Help You Buy MSFT Or AMZN If You Did
Knowing a recession’s precise start and end would not make you a better stock investor.
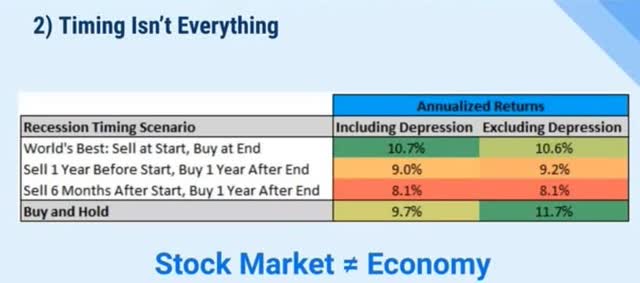
The stock market isn’t the economy, so perfect economic timing wouldn’t have beaten buy-and-hold investing since 1926 except during the Great Depression.
If you believe another Depression is coming, why are you even on Seeking Alpha reading about stocks? Go hide in your bunker before it’s too late!;)
Remember, my son, that any man who is a bear on the future of this country [America] will go broke.” – JPMorgan
Ok, but how can AMZN and MSFT not keep falling if stocks fall?
It’s always and forever a market of stocks, not a stock market.
During the Great Recession, Altria Group, Inc. (MO) bottomed in December at a very safe 15% yield and then was up 10% when the market bottomed on March 9th.
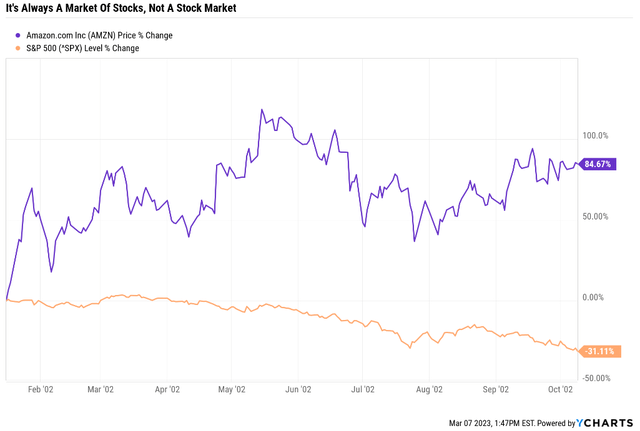
During the tech crash, Amazon bottomed on January 16th, 2002, and had nearly doubled when the market stopped falling on October 9th, 2002.
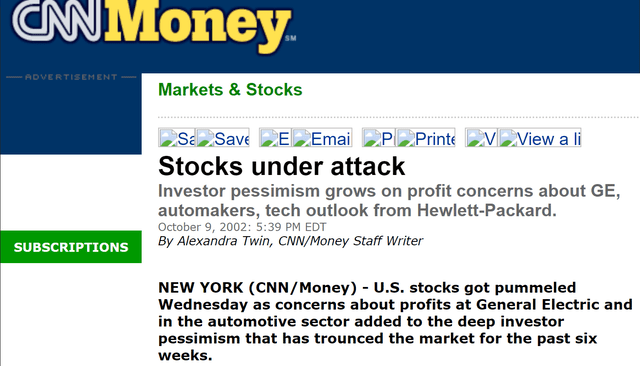
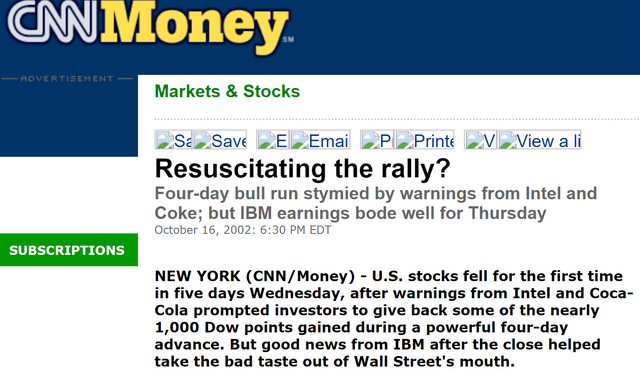
Would anyone on October 9th, 2002, have guessed that was the market bottom?
With headlines like these?
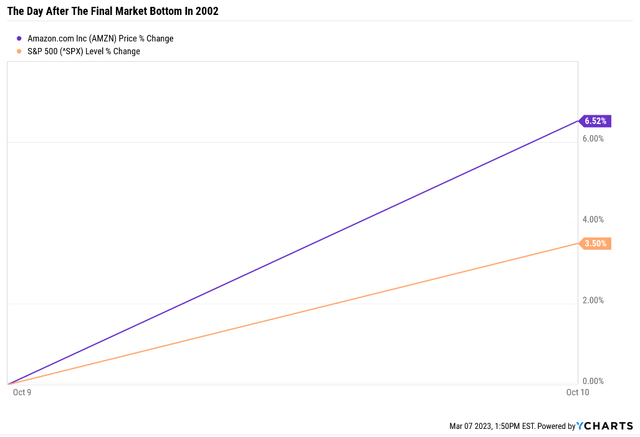
And then this happened.
The day after the tech crash, bottom stocks roared 3.5% higher, and Amazon, having already soared 85%, jumped 7% more.
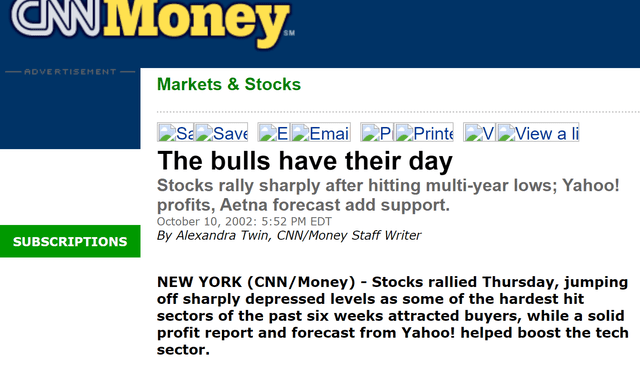
Would you have bought Amazon after it was up 100% off its Jan 2002 lows? It was so OBVIOUSLY a bear market rally! Except it wasn’t.
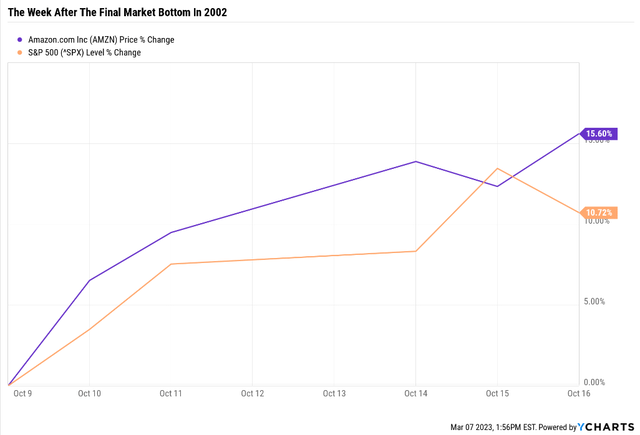
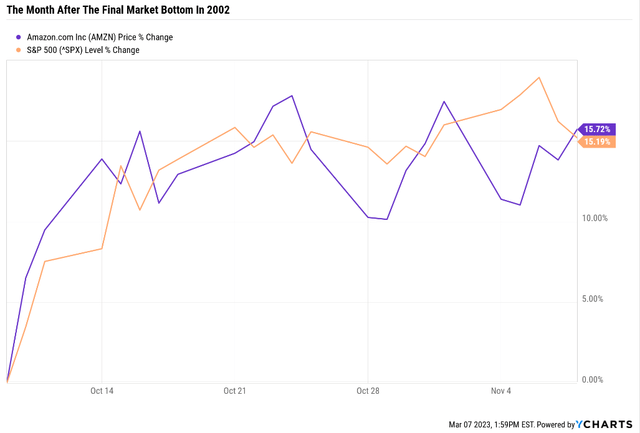
How about one week after the bottom? When the market was up 11%, and that’s after a four-day rally? When AMZN was up 16% in five days and 117% off its lows?
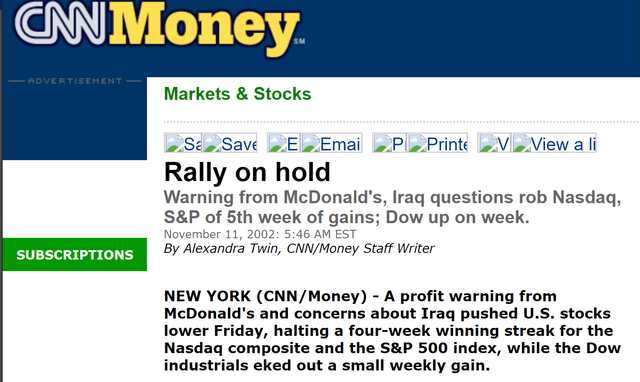
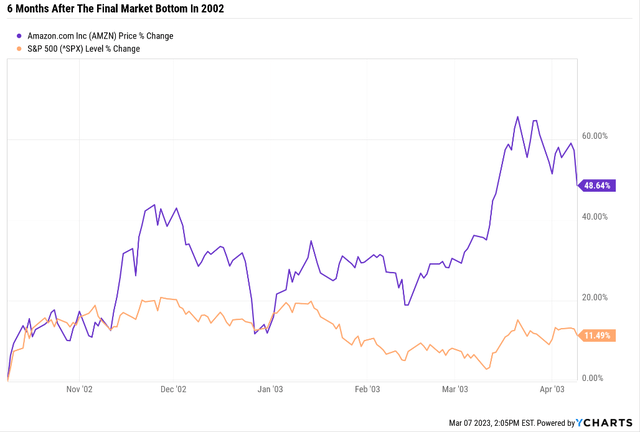
What about one month after the 2002 bottom? Would you have finally been convinced that the “dust had settled” and that buying stocks or Amazon specifically was safe?
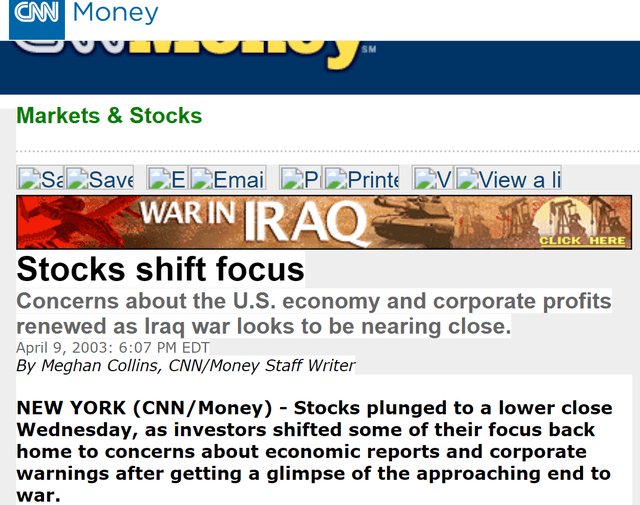
So obviously, a bear market rally that was stalling! Only suckers would be buying Amazon after it was 117% above its January lows! Heck, the media was even telling you the crash wasn’t over!
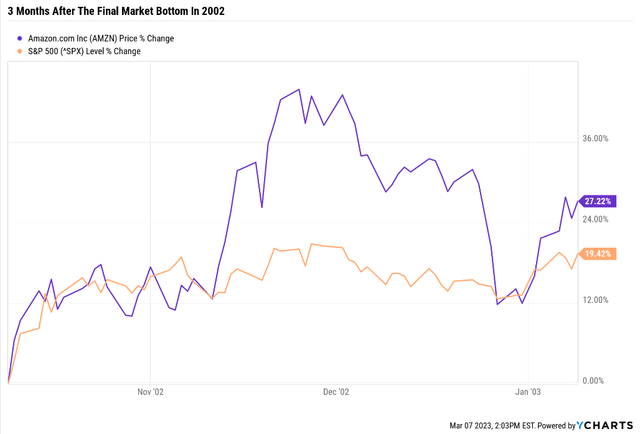
What about three months after the bottom?
Still looks like a sucker rally to me!
- Amazon is now 137% off its lows.
What about six months after?
It’s still a sucker’s rally! Unsafe to buy any stocks! ESPECIALLY Amazon, which is up 178% off its lows!
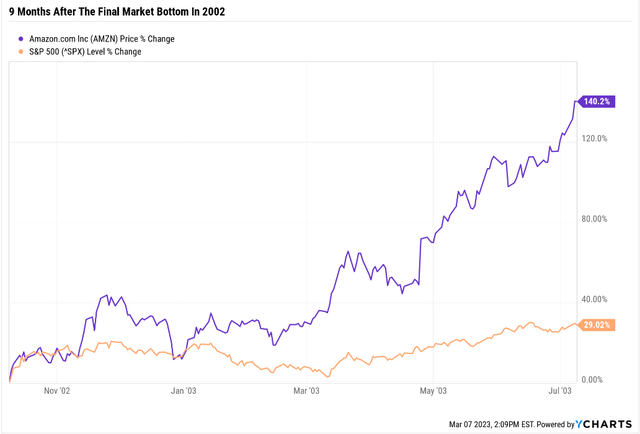
Only a fool would buy into a sucker rally when the economy is in trouble!
Amazon is now up 350% off its lows. And stocks are up 29%…is it finally safe to buy stocks? Buy Amazon? Do you think you would have done it?
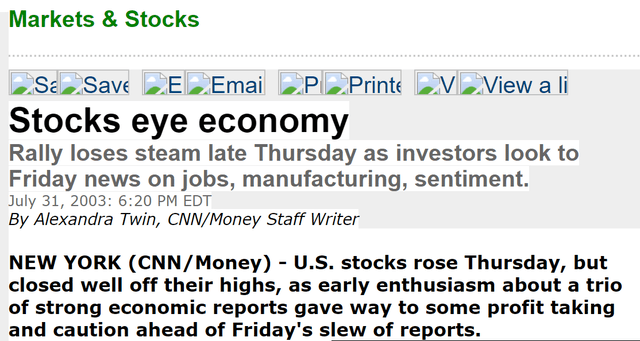
CNN, CNBC, and Jim Cramer will never tell you it’s safe to get back into the market. Not until long after it really is.
And Robert Kiyosaki? And his fellow doomsday prophets? The ones predicting a 60% to 90% market crash will never tell you it’s a good time to buy stocks.
It’s one year after the bottom, and the entire time bears have sounded smart…and bulls made money.
- Amazon is up 541% off its Jan 2002 lows.
Why Timing The Bottom Is Stupid, Reckless, And Completely Unnecessary
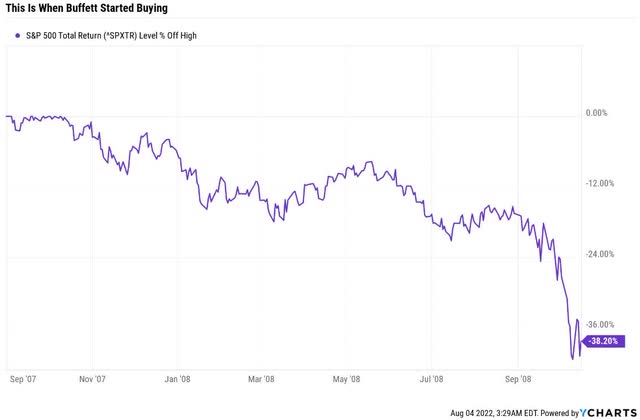
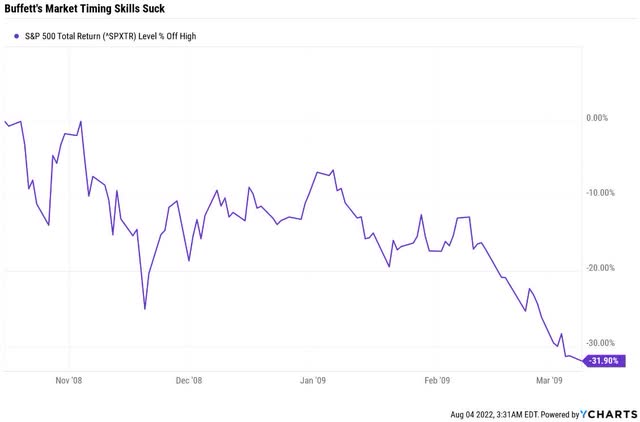
October 16th, 2008, Buffett publishes “Buy American: I Am.” in the NYT.
It was a great buying opportunity for the greatest investor of all time.
Bears were screaming that stocks obviously had to fall more. Guess who was dead wrong and who was 100% right? I’ll give you one guess.
Buffett was dead wrong! Bears were 100% right! The Oracle of Omaha has obviously lost his touch!
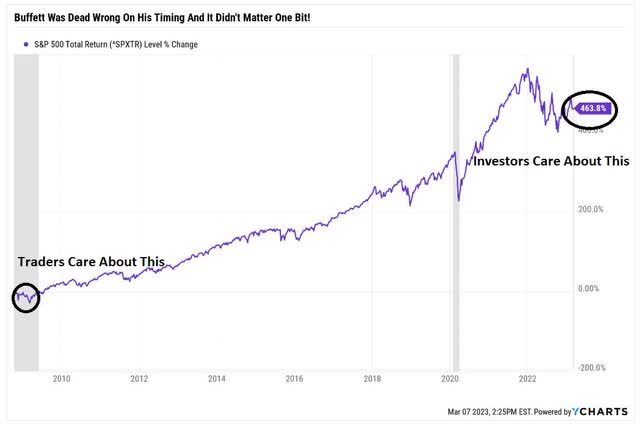
And guess what that 32% decline after a 38% decline actually meant for long-term investors?
Buffett spectacularly blew the timing, and any fool who was dumb enough to listen to him got slaughtered! They lost 32% in less than three months!
And today, those same idiots are sitting on 464% returns…four bear markets later!
Ok, so maybe buy-and-hold investors did OK listening to Buffett.
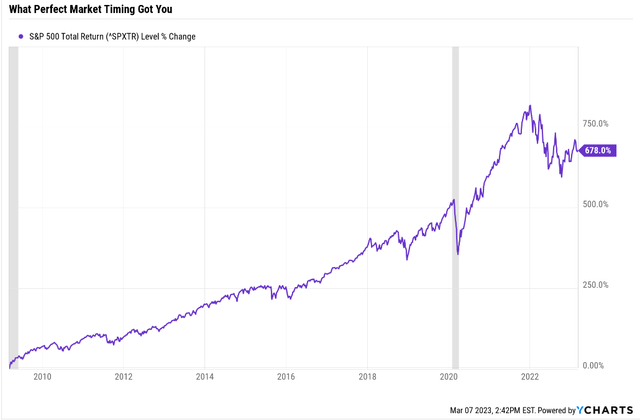
But what about people who waited and got into the market 31% lower!? Surely they ended up better off than the buy and holders, right? Indeed, anyone who could have predicted the exact bottom of the Great Recession did a bit better.
$1000 invested with Buffett in October 2008: $5,640 today = 12.2% annually.
$1,000 invested with perfect market timing (and ignoring four bear markets since): $6780 = 13.6% annually.
That’s $1,140 more, an impressive amount that comes to an extra 1.4% annual returns. And all you had to do was perfectly time the exact bottom.
But do you think anyone who got stupid lucky in the Great Recession managed to recognize their luck and buy and hold the entire time since? Through all this?
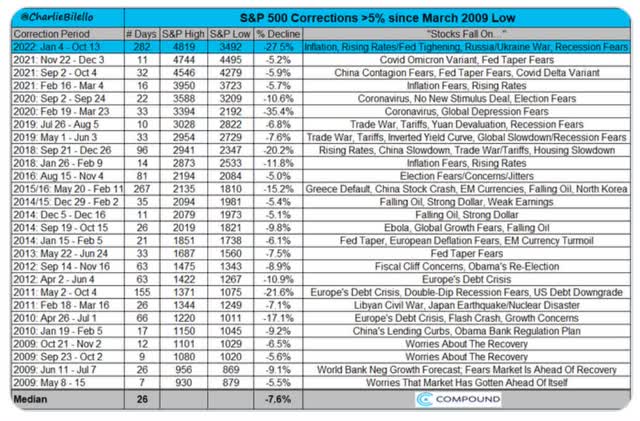
Since the Great Recession low, we’ve had 27 pullbacks, corrections, and bear markets. I guarantee anyone who was “genius” enough to nail the bottom in 2009 hasn’t held on since then.
Not when they “proved” they could boost their returns by 1.4% annually through perfectly timing every market downturn since;)
Why Timing Amazon And Microsoft Is Especially Reckless, Stupid, And Totally Unnecessary
What if the S&P falls 20% and Amazon falls even more? What if it falls by 30%?
What kind of extra returns could you earn by perfectly nailing that bottom? Here are the benefits of God-like omniscience.
- 43% better returns.
That’s not 43% better returns per year, but over an investing lifetime.
Still, it sounds darn impressive.
But there’s only one problem with that plan.
Amazon is expected to grow by almost 30% long-term.
| Company | Cloud Computing Sales Growth Through 2028 | Cloud Computing Market Share |
| Amazon | 16.4% | 40.2% |
| Microsoft | 13.4% | 32.0% |
| Alphabet | 18.7% | 14.7% |
(Source: FactSet Research Terminal.)
Thanks to its incredible 40% market share in cloud computing.
Amazon Profit Margin Consensus Forecast
| Year | FCF Margin | EBITDA Margin | EBIT (Operating) Margin | Net Margin |
| 2022 | -2.8% | 13.8% | 2.4% | -0.2% |
| 2023 | 3.5% | 14.6% | 3.9% | 3.2% |
| 2024 | 6.8% | 16.1% | 6.1% | 4.9% |
| 2025 | 8.6% | 17.2% | 7.7% | 5.8% |
| 2026 | 11.3% | 19.7% | 9.5% | 7.6% |
| 2027 | 13.6% | 20.9% | 10.9% | 8.9% |
| Annualized Growth 2022-2027 | 40.70% | 8.64% | 35.47% | 29.54% |
(Source: FactSet Research Terminal.)
Its free cash flow MARGIN is expected to grow at 41% annually through 2027.
Amazon Medium-Term Growth Consensus Forecast
| Year | Sales | Free Cash Flow | EBITDA | EBIT (Operating Income) | Net Income |
| 2022 | $510,594 | -$14,398 | $70,664 | $12,223 | -$1,027 |
| 2023 | $559,852 | $19,367 | $81,579 | $21,863 | $17,772 |
| 2024 | $638,492 | $43,691 | $103,096 | $38,775 | $31,594 |
| 2025 | $719,939 | $62,202 | $124,120 | $55,515 | $41,931 |
| 2026 | $807,828 | $91,029 | $158,845 | $76,500 | $61,676 |
| 2027 | $906,995 | $122,955 | $189,977 | $99,061 | $81,083 |
| Annualized Growth 2022-2027 | 12.18% | 58.73% | 21.87% | 51.97% | 46.15% |
| Cumulative 2022-2027 | $3,633,106 | $339,244 | $657,617 | $291,714 | $234,056 |
(Source: FactSet Research Terminal.)
Its free cash flow is expected to grow at almost 60% annually through 2027.
And it’s AA-rated balance sheet? Just take a look.
(Source: FactSet Research Terminal)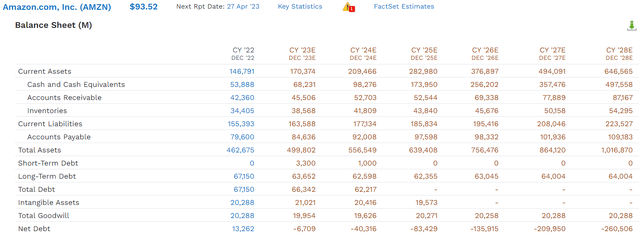
How about $260 billion in net cash by 2028?
That’s more than Apple Inc. (AAPL) had when it began the largest shareholder return in history.
But here is the real reason why I would not recommend trying to nail the bottom on Amazon, which has already been as low as $82.
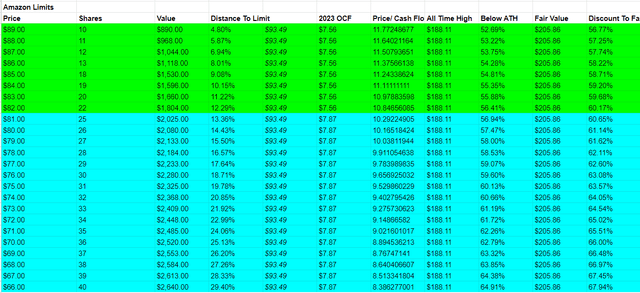
I know because I nailed the bottom so far. I managed to buy Amazon at $82, a 60% historical discount to fair value.
Could it fall more? Sure, and if it does, I’ll buy more. I have limits all the way down to $66. Not because I think AMZN will hit 68% undervalued and become the most undervalued Ultra SWAN in history. But purely because the market can be totally insane at times.
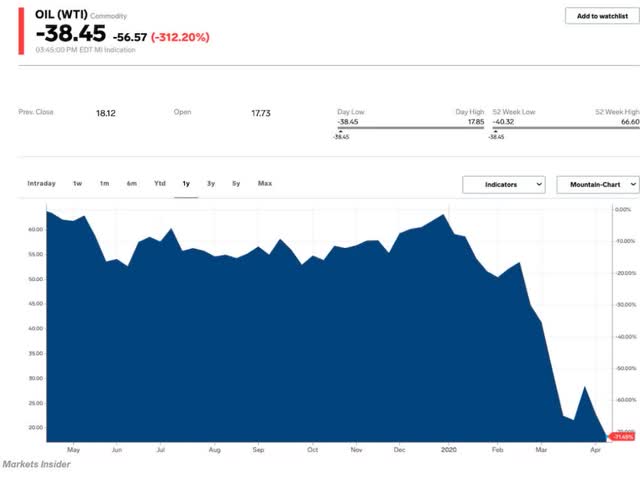
If oil can hit -$38 then Amazon could potentially become 68% undervalued.
- Enterprise Products Partners L.P. (EPD) hit a 65% discount to fair value during the Pandemic (when oil hit -$38)
- the most undervalued Ultra SWAN I’ve ever seen so far.
But am I worried about anyone buying Amazon today?
- fair value: $205.86
- current price: $93.54
- discount: 55% (11.3X forward cash flow vs 26X historical)
- DK quality rating: 99% low risk 13/13 Ultra SWAN
- DK rating: Potential Ultra Value Buffett-style table-pounding buy.
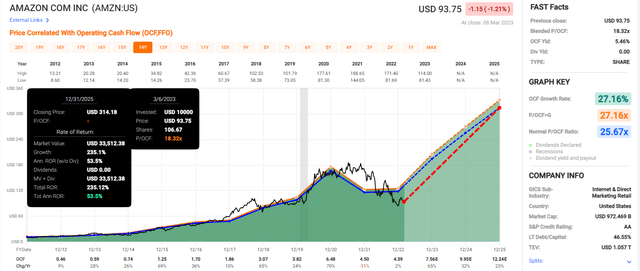
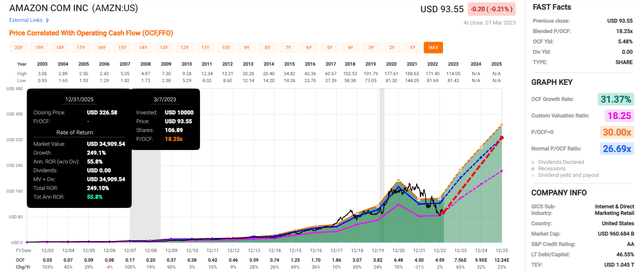
Remember how Amazon can more than triple in a year off bear market lows? Well, in the next three years, it has the potential to more than triple, delivering life-changing 54% annual returns.
But just take a look at what it might accomplish in six years.
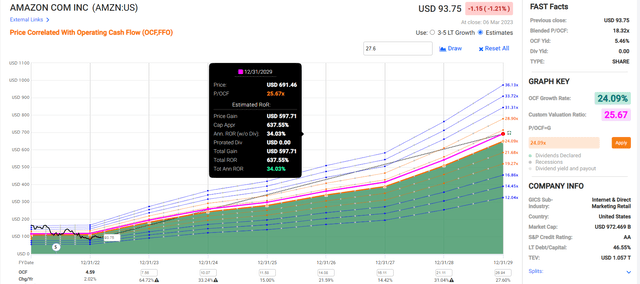
Amazon 2029 Consensus Total Return Potential
If Amazon grows as expected and returns to a historical fair value of about 26X cash flow by 2029, you could make 638% or 34% annually.
Now that’s what I call Buffett-like returns from a blue-chip bargain hiding in plain sight!
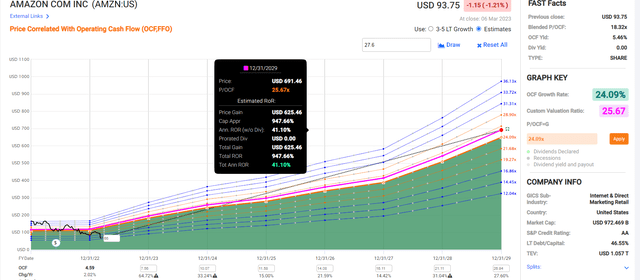
Amazon 2029 Consensus Total Return Potential (From $66 Share Price)
What if Amazon does fall 30% lower to $66? Then it would be 68% undervalued and could be more than 10X in the next six years.
- Amazon’s best 5-year return since 2002 was 9X or 56% annually.
Imagine you’re an investor who loves Amazon’s business, but you get value greedy.
It falls to $82 (like it already did), and you didn’t buy it.
Today it offers 7.5X return potential in 6 years, but that’s not good enough for you.
You’re convinced it will fall 30% because the market will fall 20%.
It falls to $80; you do nothing.
It falls to $75, and you do nothing.
It falls to $67, and still, you do nothing.
“I know it’s going to hit $66, and then I’m all in.”
What if Amazon bottoms at $67? Then you’ll have been 99% right, and that extra 1% cost you a potential 10X return in 6 years.
Microsoft Isn’t A Table-Pounding Buy Yet…But It’s A Classic Buffett-Style Wonderful Company At A Fair Price
For Amazon, it’s pretty obvious that it’s a screaming buy.
AMZN’s blended trailing price/cash flow is at its lowest level (other than the October low) since the Great Recession, and on a forward basis, it’s at the lowest levels in history other than the October low.
Microsoft?
It’s down half as much from its record highs as Amazon is, but that’s still a 25% bear market.
What does that mean for MSFT investors?
- fair value: $268.04
- current price: $252.52
- discount: 5%
- DK quality rating: 100% quality very low risk 13/13 Ultra SWAN
- DK rating: potentially good buy.
MSFT is a classic Buffett-style “wonderful company at a fair price.”
It’s far better to buy a wonderful company at a fair price, than a fair company at a wonderful price.” – Warren Buffett
Microsoft 2025 Consensus Total Return Potential
(Source: FAST Graphs, FactSet)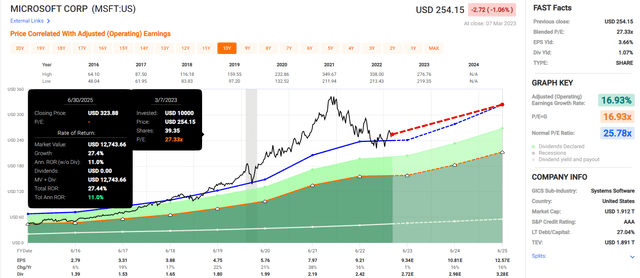
MSFT doesn’t offer exceptional return potential through 2025 as AMZN does, but it offers slightly better than what the S&P might deliver.
MSFT’s 6-year return potential of 120% is superior to the S&P’s 45%; in fact, it’s about 3X better thanks to superior growth and a slightly better valuation.
Microsoft 2029 Consensus Total Return Potential (25% Sell-Off, $191)
(Source: FAST Graphs, FactSet)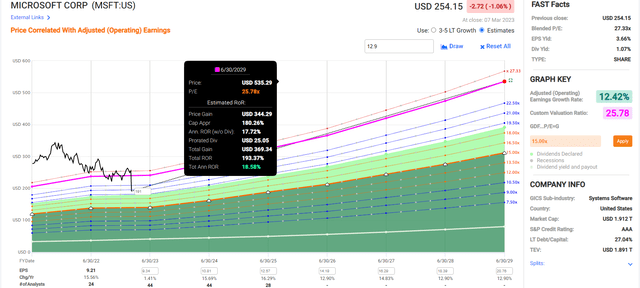
How much might MSFT fall if the S&P sells off by 25%?
- 20% to 25% is the realistic worst-case scenario based on its historical 1.29 beta.
If MSFT sells off 25%, its six-year return potential will rise to nearly 200%, a potential triple.
At a 35% historical discount, the Ultra Value table-pounding buy price for Ultra SWANs like this ($174), MSFT becomes a once-in-a-lifetime opportunity.
Microsoft 2029 Consensus Total Return Potential (35% Discount Ultra Value Price Of $174)
(Source: FAST Graphs, FactSet)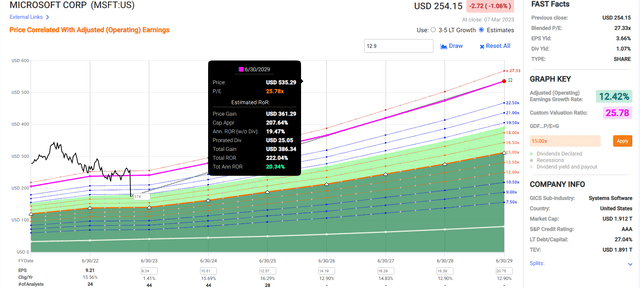
Is MSFT actually likely to fall to $174? Or even $191? Probably not.
- 25% decline to $191
- 31% decline to $174.
Here’s why.
Remember that the likely market bottom is the end of 2023 or the first half of 2024.
MSFT has relatively recession-resistant earnings and cash flow because most of its sales are recurring monthly revenue.
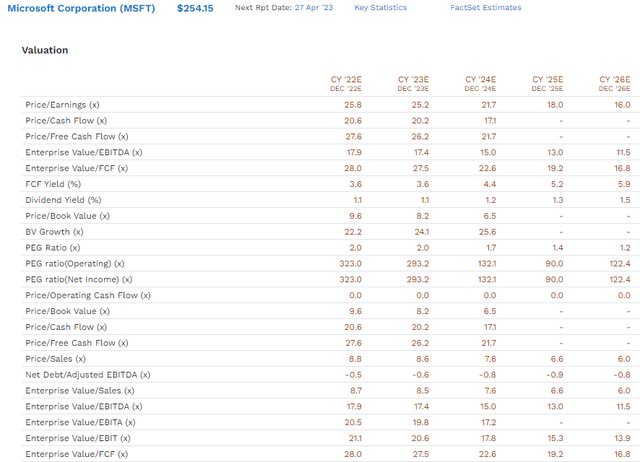
By the end of 2023, the market will be looking at 2024 results, and MSFT is trading at 21.7X next year’s earnings.
- and 17.1X cash flow
- 21.7X free cash flow
- 15X cash-adjusted earnings.
For MSFT to fall 31% to its Ultra-Value price of $174 would mean:
- 15X forward earnings
- 11.8X operating cash flow
- 15X free cash flow
- 10.4X cash-adjusted earnings.
MSFT is a world-beater cloud computing titan with the 2nd fastest growth rate.
And that superior return potential comes with the lowest fundamental risk of any U.S. company.
A Stronger Balance Sheet Than The U.S. Treasury
| Rating Agency | Credit Rating | 30-Year Default/Bankruptcy Risk | Chance of Losing 100% Of Your Investment 1 In |
| S&P | AAA Stable Outlook | 0.07% | 1428.6 |
| Fitch | AAA Stable Outlook | 0.07% | 1428.6 |
| Moody’s | Aaa (AAA equivalent) Stable Outlook | 0.07% | 1428.6 |
| Consensus | AA- Stable Outlook | 0.07% | 1,429 |
(Source: S&P, Fitch, Moody’s.)
How many U.S. companies have three AAA credit ratings? Only MSFT (JNJ has two).
Not even the U.S. government has three AAA credit ratings (S&P rates the U.S. government AA+).
That means MSFT has a 1 in 1,429 chance of defaulting on its bonds and going bankrupt (and the stock to zero) over the next 30 years.
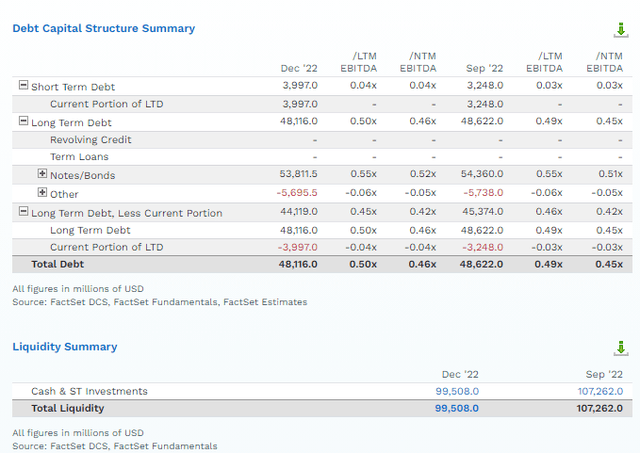
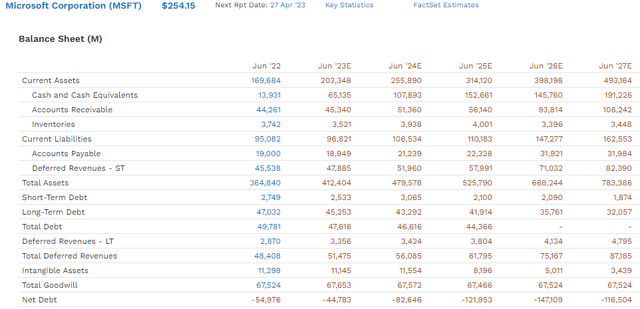
MSFT has $100 billion in cash and $50 billion in net cash.
If MSFT goes bankrupt, it likely means the world has ended and the living envy the dead, and we have bigger things to worry about than our portfolios.
And that $100 billion cash pile is likely to keep growing in the future.
By 2027, despite epic buybacks and $20 billion in annual dividends, MSFT’s cash pile is expected to almost double to $191 billion and $117 billion net of debt.
That’s because MSFT is a free cash flow minting machine.
Last year MSFT generated $65 billion in free cash flow, and that’s expected to double by 2027.
- $329 million PER DAY in free cash flow
- including weekends and holidays
- $13.7 million per hour
- $228,000 per minute
- $3,800 per second.
Today MSFT is generating almost $2,000 per second in free cash flow, and it’s using that to fund some of the most impressive buybacks in history.
- as well as paying $20 billion per year in dividends.
Through 2027 it’s expected to pay about $120 billion in dividends and buyback about $160 billion in shares.
- And yet its cash pile is expected to grow by $90 billion.
Is MSFT a hyper-growth powerhouse like Amazon? No.
Can it deliver 25% to 30% long-term returns? No.
But there is no lower-risk way to earn market-beating and life-changing long-term returns than MSFT.
Long-Term Consensus Total Return Potential
| Investment Strategy | Yield | LT Consensus Growth | LT Consensus Total Return Potential | Long-Term Risk-Adjusted Expected Return |
| ZEUS Income Growth (My family hedge fund) | 4.3% | 10.3% | 14.6% | 10.2% |
| Microsoft | 1.1% | 12.9% | 14.0% | 9.8% |
| Schwab US Dividend Equity ETF | 3.6% | 9.4% | 13.0% | 9.1% |
| Vanguard Dividend Appreciation ETF | 2.2% | 10.0% | 12.2% | 8.5% |
| Nasdaq | 0.8% | 10.9% | 11.7% | 8.2% |
| Dividend Aristocrats | 1.9% | 8.5% | 10.4% | 7.3% |
| S&P 500 | 1.7% | 8.5% | 10.2% | 7.1% |
| REITs | 3.9% | 6.1% | 10.0% | 7.0% |
| 60/40 Retirement Portfolio | 2.1% | 5.1% | 7.2% | 5.0% |
(Sources: DK Research Terminal, FactSet, Morningstar.)
If MSFT grows as expected, it will be a far lower risk and superior investment to the S&P, Nasdaq, and just about any investment strategy on Wall Street.
Microsoft’s Long-Term Risk Management Is Exceptional
DK uses S&P Global’s global long-term risk-management ratings for our risk rating.
- S&P has spent over 20 years perfecting their risk model
- which is based on over 30 major risk categories, over 130 subcategories, and 1,000 individual metrics
- 50% of metrics are industry specific
- this risk rating has been included in every credit rating for decades.
The DK risk rating is based on the global percentile of a company’s risk management compared to 8,000 S&P-rated companies covering 90% of the world’s market cap.
MSFT Scores 97th Percentile On Global Long-Term Risk Management
S&P’s risk management scores factor in things like:
- supply chain management
- crisis management
- cyber-security
- privacy protection
- efficiency
- R&D efficiency
- innovation management
- labor relations
- talent retention
- worker training/skills improvement
- occupational health & safety
- customer relationship management
- business ethics
- climate strategy adaptation
- sustainable agricultural practices
- corporate governance
- brand management.
| Classification | S&P LT Risk-Management Global Percentile |
Risk-Management Interpretation |
Risk-Management Rating |
| BTI, ILMN, SIEGY, SPGI, WM, CI, CSCO, WMB, SAP, CL | 100 | Exceptional (Top 80 companies in the world) | Very Low Risk |
| Microsoft | 97 |
Exceptional |
Very Low Risk |
| Strong ESG Stocks | 86 |
Very Good |
Very Low Risk |
| Foreign Dividend Stocks | 77 |
Good, Bordering On Very Good |
Low Risk |
| Ultra SWANs | 74 | Good | Low Risk |
| Dividend Aristocrats | 67 | Above-Average (Bordering On Good) | Low Risk |
| Low Volatility Stocks | 65 | Above-Average | Low Risk |
| Master List average | 61 | Above-Average | Low Risk |
| Dividend Kings | 60 | Above-Average | Low Risk |
| Hyper-Growth stocks | 59 | Average, Bordering On Above-Average | Medium Risk |
| Dividend Champions | 55 | Average | Medium Risk |
| Monthly Dividend Stocks | 41 | Average | Medium Risk |
(Source: DK Research Terminal.)
There are no truly “risk-free” companies, but MSFT is as close as they come. And it could deliver 14% long-term returns that could help you retire in safety and splendor.
Bottom Line: Be Ready To Back Up The Truck On Microsoft And Amazon But Don’t Forget To Buy Some Today!
Let me share with you a story that Ben Carlson of Ritholtz Wealth Management told us on his podcast.
In early 2008 he had a client who was CONVINCED that the subprime crisis was going to destroy the financial system and plunge America and the world into a severe recession and stock market crash.
He was 100% right.
This client sold all his stocks and went to cash (he should have gone 100% long bonds and could have made 75%).
He felt like a genius.
“What is your plan for that cash?” -Carlson asked.
There’s this analyst I follow that’s absolutely amazing. He nailed the crisis, so I sold near the top.
He says he’s certain the S&P will bottom at 500. I’ll start buying at 600, and by 500, will be 100% stocks.”
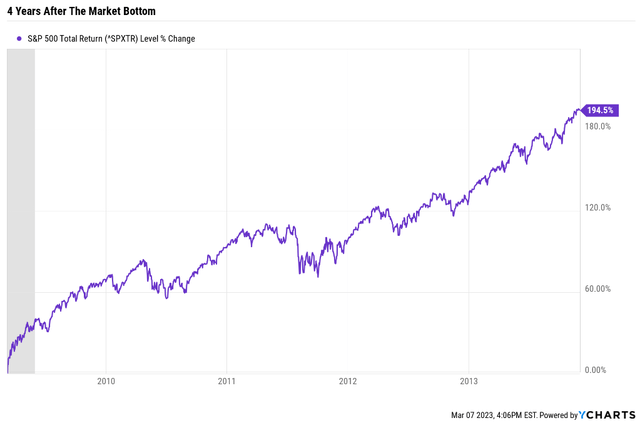
The S&P bottomed at 666 on March 9th, 2009.
It was a day with no dramatic headlines. The market didn’t crash that day; it fell just 1%. There was no grand “capitulation” day, and no one in the media called it the bottom.
Ycharts Ycharts Ycharts Ycharts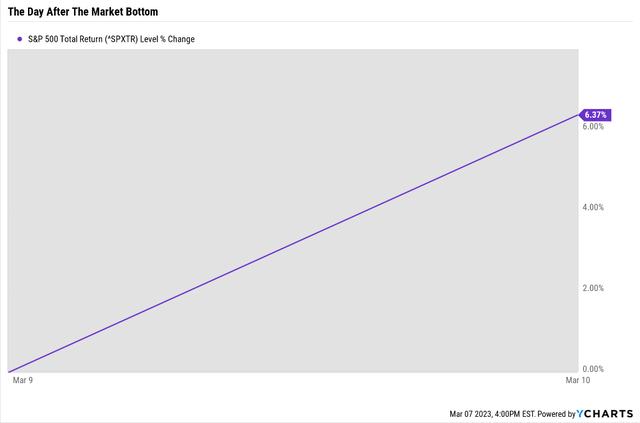
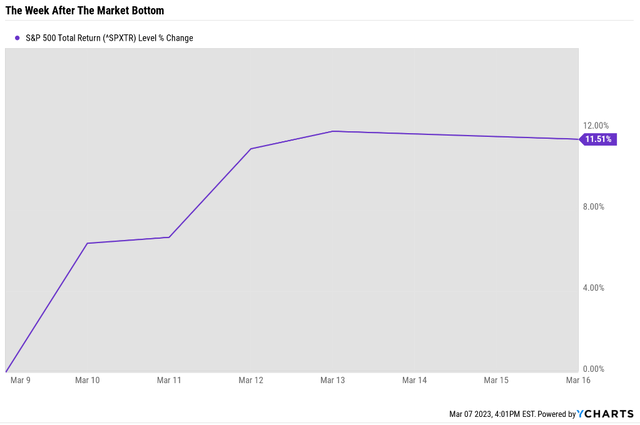
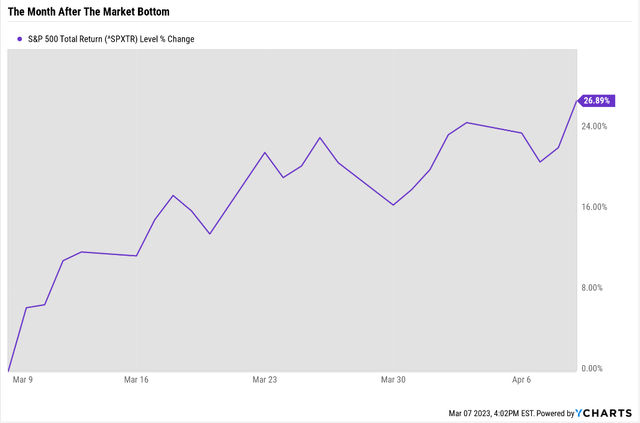
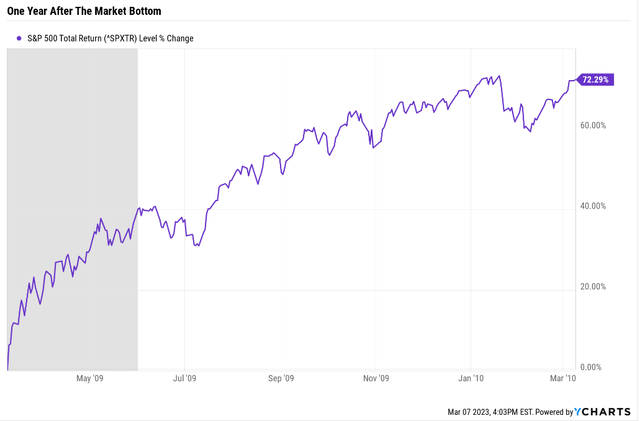
Even one year later, Carlson’s client listened to his favorite analyst and was convinced that this was the mother of all bear market rallies.
He didn’t buy a single share of stock until the end of 2013.
By the time Carlson’s client finally started buying stocks, they had tripled!
That’s how dangerous the permabear doomsday prophets are.
That’s how dangerous getting addicted to cash is.
That’s how dangerous getting lucky once is.
Bears always sound smart, but long-term bulls are the ones who get rich.
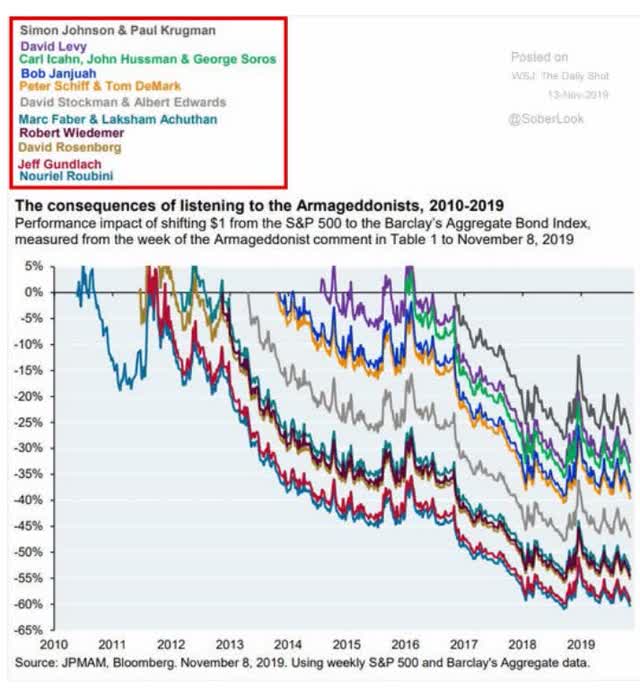
Robert Kiyosaki, the doomsday prophet who has spent ten years predicting 90% crashes and the collapse of the global economy, is worth about $100 million. That’s from selling “Rich Dad, Poor Dad” books, not investing.
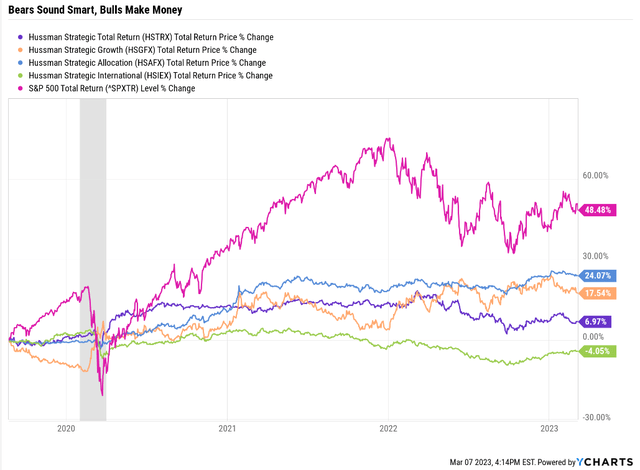
John Hussman is a doomsday prophet hedge fund manager who has been hyper-bearish on the market for 23 years. He’s worth $5 million because of returns like this.
We’ve had two bear markets and one crash in the last three years. And an ultra-show hedge fund manager still managed to underperform the U.S. stock market.
Warren Buffett is the greatest investor of all time and is worth $107 billion.
And guess what? Buffett isn’t a specially good stock picker.
In 58 years of Berkshire management, most of my capital-allocation decisions have been no better than so-so. In some cases, also, bad moves by me have been rescued by very large doses of luck. (Remember our escapes from near-disasters at USAir and Salomon? I certainly do.” – Warren Buffett 2022 annual letter (emphasis added).
Warren Buffett admits his stock-picking skills aren’t the best. They are “so-so.”
So why is he worth over $100 billion? According to this study from AQR:
We find that stocks with the characteristics favored by Buffett have done well in general, that Buffett applies about 1.6-to-1 leverage financed partly using insurance float with a low financing rate, and that leveraging safe stocks can largely explain Buffett’s performance.” – AQR Buffett’s Alpha (emphasis added).
For nearly 60 years, Buffett has been buying blue-chip companies (mostly dividend stocks) using 60% leverage from insurance and holding most of these for years or decades.
Buffett achieved 12.8% unlevered returns over this time.
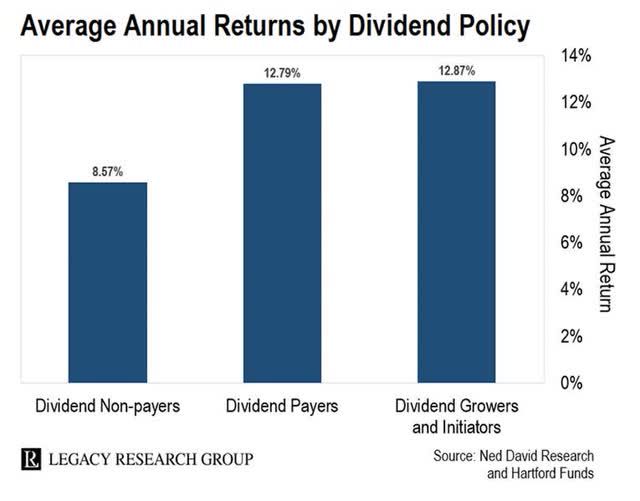
That’s basically matching what dividend blue-chips did.
Buffett’s “secret” isn’t a secret at all.
His skill is investing, but his secret is time.” – Morgan Housel
Buffett isn’t a better stock picker than most people; he’s just a lot more patient and owns some insurance companies for leverage.
The point is that Buffett doesn’t try to be cute, and that’s why he’s rich.
He doesn’t try to time the market or care when others think he’s crazy or stupid.
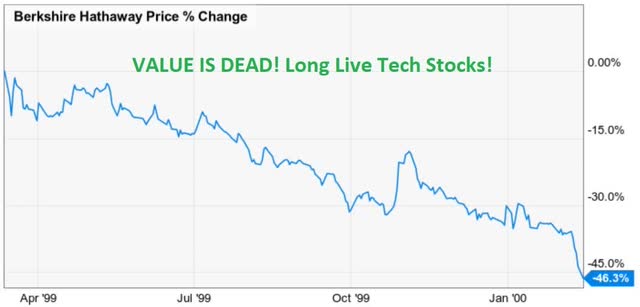
During the tech bubble, Berkshire (BRK.B) lost almost 50% of its value.
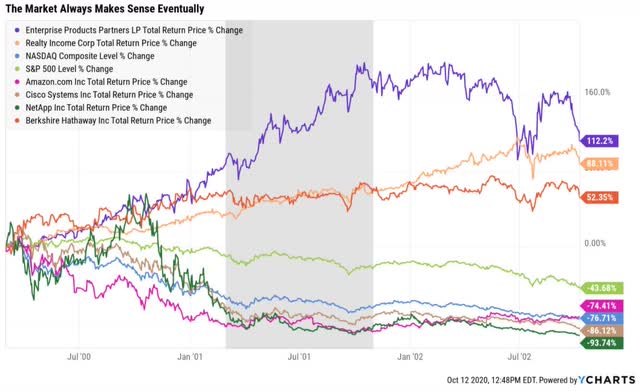
And during the tech crash, Berkshire was up over 50%, while deep-value stocks like Realty Income (O) and EPD doubled.
If you agree with me that Amazon and Microsoft are world-beater cloud computing titans with a bright future, you should be buying some RIGHT NOW.
If they fall more? Buy more.
If they fall, rally, and trade range-bound? Just keep buying.
Let me be clear: I’m NOT calling the bottom in AMZN or MSFT (I’m not a market-timer).
Fundamentals are all that determine safety and quality, and my recommendations.
- over 30+ years, 97% of stock returns are a function of pure fundamentals, not luck
- in the short term; luck is 25X as powerful as fundamentals
- in the long term, fundamentals are 33X as powerful as luck.
The fundamentals of AMZN and MSFT aren’t just good; they are exceptional.
These are tech titans with wide moats, strong management, and fortress balance sheets, and they will almost certainly make you rich over time.
Stop trying to be cute, and prove you’re a genius. Just let two of the world’s best companies work hard for you so that one day you don’t have to.
To paraphrase Casablanca (1942):
If the market leaves the ground and you haven’t bought some Microsoft or Amazon, at least via ETFs, you’ll regret it. Maybe not today. Maybe not tomorrow, but soon, and for the rest of your life.”
Disclosure: I/we have a beneficial long position in the shares of AMZN either through stock ownership, options, or other derivatives. I wrote this article myself, and it expresses my own opinions. I am not receiving compensation for it (other than from Seeking Alpha). I have no business relationship with any company whose stock is mentioned in this article.
Additional disclosure: DK owns AMZN and MSFT in our portfolios.
—————————————————————————————-

Dividend Kings helps you determine the best safe dividend stocks to buy via our Automated Investment Decision Tool, Zen Research Terminal, Correction Planning Tool, and Daily Blue-Chip Deal Videos.
Membership also includes
-
Access to our 13 model portfolios (all of which are beating the market in this correction)
-
my correction watchlist
- my $2 million family hedge fund
-
50% discount to iREIT (our REIT-focused sister service)
-
real-time chatroom support
-
real-time email notifications of all my retirement portfolio buys
-
numerous valuable investing tools
Click here for a two-week free trial, so we can help you achieve better long-term total returns and your financial dreams.

