Summary:
- Getty Realty’s fundamentals and market price have diverged, with AFFO/share growing consistently while the market price has fallen, making the stock materially undervalued.
- The implied cap rate and AFFO multiple undervalue Getty’s reliability and growth potential, with a clear runway for steady earnings growth.
- Getty’s focus on automotive-related properties, strong tenant rent coverage, and clean underwriting process set it up for long-term growth and potential capital gains.
jax10289
Getty Realty’s (NYSE:GTY) fundamentals and market price have diverged. Specifically, its AFFO/share has consistently grown at a healthy pace while its market price has fallen. Consequently, the stock has moved from fair value to materially undervalued. As it stands today, Getty is trading at an 8.3% implied cap rate and 11.5X AFFO multiple while having a clear runway of steady earnings growth.
I believe the AFFO multiple substantially undervalues the company’s reliability and growth, and the implied cap rate significantly undervalues its assets relative to what those properties could be sold for in the private market.
In this article, we will discuss:
- How Getty became undervalued
- Fundamental outlook for tenants and the REIT
- Getty’s acquisition and underwriting process
- Valuation using cash flows
- Valuation on asset value
- Risks on the horizon
- Overall fair value
Quick Background
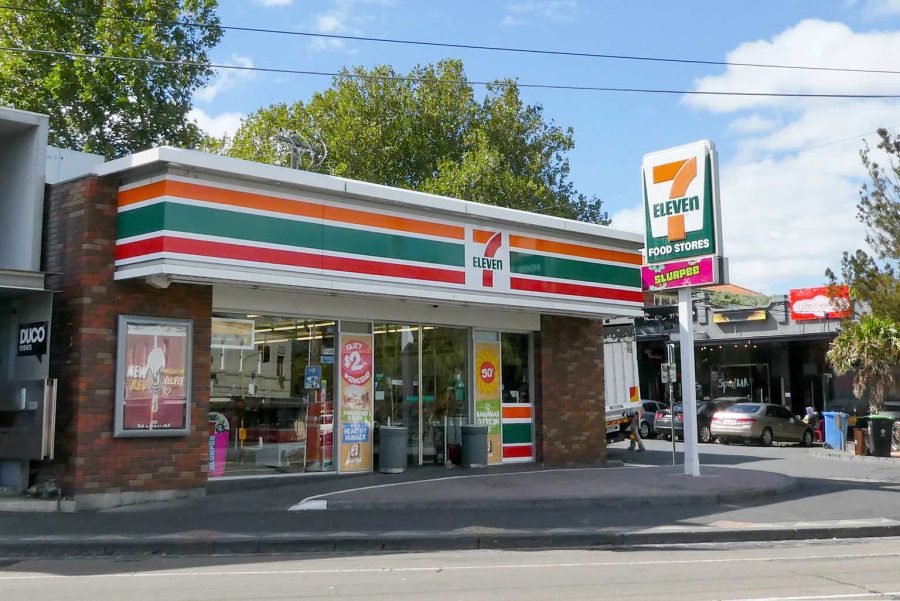
Getty has 1,093 freestanding properties primarily consisting of convenience stores, auto repair shops, car washes, and other automotive-focused facilities. These properties are spread across the U.S. primarily in corner locations with high traffic volume.
Other triple net REITs own some properties of these categories, but Getty is the only REIT that specializes in automotive-related properties.
Genesis of Discounted Valuation
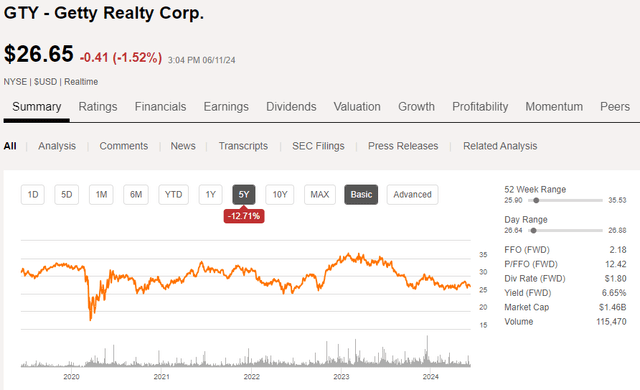
For the last five years, GTY’s stock price has bounced around a bit but overall traded down 12.7%.
Over that same time period, AFFO/share grew consistently.
S&P Global Market Intelligence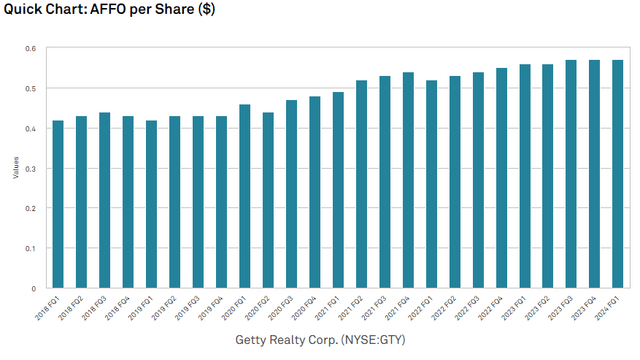
With higher cashflows, GTY increased its dividend proportionally.
S&P Global Market Intelligence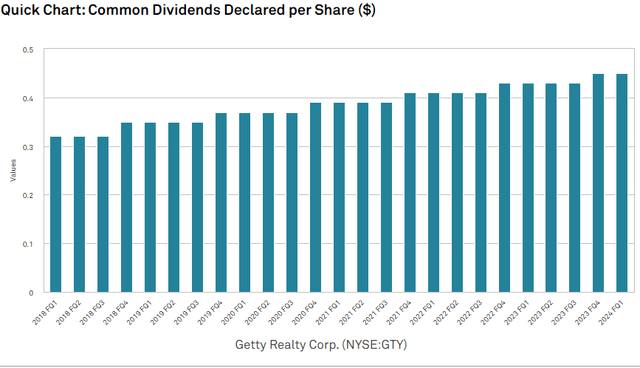
So while the stock price is down 12.7%, the discount to the former valuation is much larger. It went from a 19X multiple on trailing AFFO to a 12X multiple.
S&P Global Market Intelligence
Since Getty is still growing, it is even cheaper on a forward multiple at 11.5X.
Perhaps it was slightly overvalued at 19X, but we believe 11.5X is significantly too low for its growth trajectory.
Fundamental Outlook For the Industry
As Getty’s properties are focused on servicing vehicles, the primary source of demand is miles traveled. Total miles driven in the U.S. has been increasing steadily for decades, except for a dip during the COVID pandemic.
Miles driven have since recovered and returned to the upward trend.
More people on roads means more people stopping at convenience stores. The above data is the primary desideratum for the quantity of customers, but the profitability of convenience stores is more about margins.
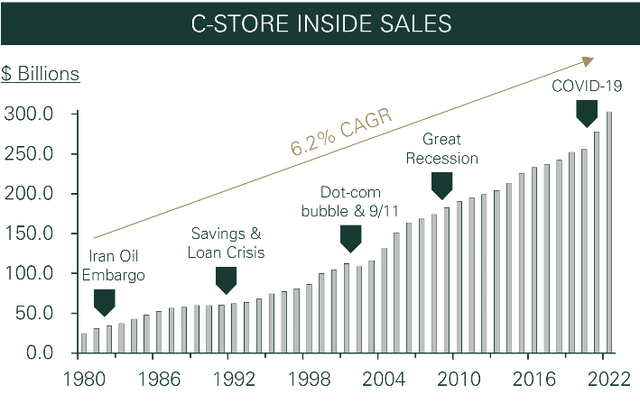
Margins on gas are fairly low, while the margins on inside sales are much higher at around 30% for merchandise and above 50% for food. Over time, it would seem customers are increasingly valuing convenience and shifting more of their purchases to convenience stores.
A counterpoint on convenience store inside sales could be that consumers spent more during and after COVID because of the widespread cash stimulus packages. Note the upward inflection point on the chart above. As the extra cash reserves run out, I suspect it will return back to the trend line, which is still positive but at a more moderate slope.
Overall, the number of customers being served by convenience stores is rising and the profit margin per ticket is also increasing, leading to generally rising earnings for operators.
Vehicle miles driven is also a key contributor to sales for auto repair shops and car washes. I believe the demand per mile is also increasing as the average age of vehicles on the road has increased materially. On a per mile driven basis, older cars need more repair, tire changes, and other work.
Stable and seemingly growing tenant profitability is good for Getty in two ways:
- It keeps tenant EBITDA coverage of rent at healthy levels
- It encourages rent increases as leases roll
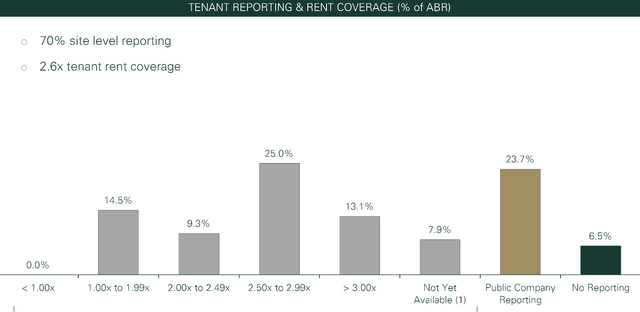
Getty’s average tenant rent coverage is 2.6X, with none of its tenants in the under 1X bucket.
These metrics have promoted full occupancy and full rent collection.
Getty, like most triple net REITs, has long lease terms with rent escalators:
- 9-year weighted average remaining term
- 1.7% annual escalators on average
With triple nets, I think investors often overvalue current leases without providing enough consideration to what happens when leases expire.
There is a big difference in what happens when an above-market lease expires versus one that is at or below market. Whether a given REIT’s leases are above or below market depends on two things:
- The initial rent level of the originated sale leaseback versus what is appropriate for the property.
- How fundamentals have changed since initial signing.
The first category comes down to how a given REIT underwrites its sale leasebacks.
Acquisition and Underwriting Process
Sale leasebacks are an interesting process because there is quite a bit of wiggle room in how the leases are set. Two terms are negotiated between the buyer (REIT landlord) and seller (asset operator):
- Annual rent
- Purchase price
Consider a property that is worth about $1 million, and let’s say the going cap rate for this sort of asset is 7%. The default terms for a sale leaseback would be for the REIT to buy the property for $1mm and annual triple net rent would be $70K (making it a 7% cap rate).
Well, in an originated sale leaseback these terms can be negotiated. Tenants usually sell their properties so as to free up capital for growth and the REIT wants the income stream.
Given this incentivization, it could make sense for the REIT to buy the property at $1.2 million instead of $1 million and in exchange get an annual rent of $85K (instead of $70K). It can be advantageous to both parties. The seller gets more upfront capital to reinvest in growth and the REIT gets the extra $200K back over the lease term plus more due to the higher rent stream.
It is functionally a small loan embedded in the sale leaseback transaction.
Sale leasebacks with rent set in this way tend to have roll-downs when the initial term ends. Quite simply, $70K was the appropriate rent for the property, so when the $85K lease ends it will probably be re-signed at market rate which would be closer to $70K.
It can be difficult to detect because the terms of the lease do not mention anything about a loan. Everything just looks normal with exception to the rent being a little bit high for what the property can support on an ongoing basis.
The way an analyst can get a scent of this sort of thing is to note when initial rents of sale leasebacks look a bit high for a given property. I have seen this in Innovative Industrial (IIPR) and written about it extensively. I think similar leases were signed at American Realty Capital (Formerly ARCT) and VEREIT back when it was ARCP. Both companies have since been bought.
These leases are entirely legal and sometimes even strategically wise. I don’t intend these callouts as a condemnation, but rather as something of which investors should be aware. It simply means the existing stream of cashflows for the REIT should be valued at a lower multiple because it is above market rates, which means that when the leases roll over they will likely be re-signed at lower rents.
The reason that this discussion is relevant to Getty is because they explicitly do NOT do this sort of lease. They originate their sale leasebacks at rents that are appropriate for the building. In other words, the rent is specifically underwritten to a level that is well-supported by the EBITDA generated at the property.
This can be seen in GTY’s 2.7X tenant EBITDA coverage of rent, and it shows up again in what happens when leases roll over.
Given GTY’s long lease terms, they haven’t had a ton of rollover in recent quarters, but here is what happened when leases did roll.
Coming off a long lease Getty puts a bit of capex into the properties investing a total of $3.664 million in these five properties and then signing new leases with overall rent $440K higher than expiring rent. That is an average incremental rate of return of 12%.
Getty is able to get these rollups because the expiring rent was not above market rates. The leases were initially signed at market rates and then the gradual increases in tenant profitability over time caused the former rent to be slightly below market rate (property level EBITDA grew faster than rent escalators).
It is this clean underwriting and acquisition process that sets Getty up for long-term growth. They have organic growth from escalators on existing leases and then slight roll-up potential as leases expire.
Cash Flow Valuation
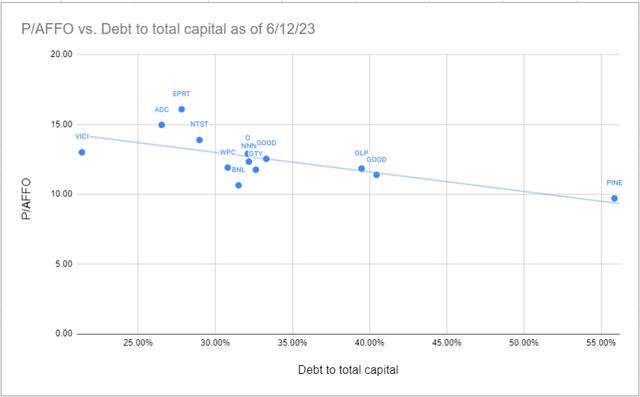
AFFO multiples should be considered in the context of their leverage. Higher leverage should result in a lower multiple and vice versa. Below is the AFFO multiple of each triple net REIT plotted against its debt to total capital.
Getty is relatively cheap compared to its peer set on a leverage-neutral basis.
It is also cheap relative to REITs as a whole and the S&P.
Asset Level Valuation
Trading at just under $27 per share, Getty is available at an implied cap rate of somewhere between 8% and 8.5% using recent net operating income (NOI) figures.
S&P Global Market Intelligence
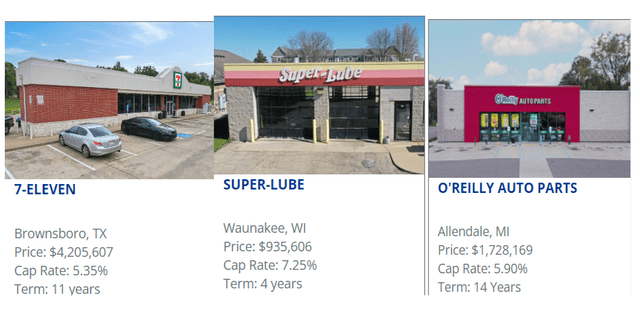
Properties similar to what GTY owns are available for purchase at cap rates ranging from the low 5s to the low 7s. Here are some present listings on Boulder Group.
These are quite similar to what GTY owns except on average GTY’s properties are in higher population density areas. That is quite a spread in valuation.
If Getty were to trade at a 6% cap rate like its properties do, it would be at $43 per share.
Risks to Owning Getty
Getty has a somewhat high tenant concentration. Its unit level rent coverage is quite strong at 2.7X, but if there are problems at a corporate level of a tenant, it can still force re-leasing the properties and some downtime until a replacement tenant is found.
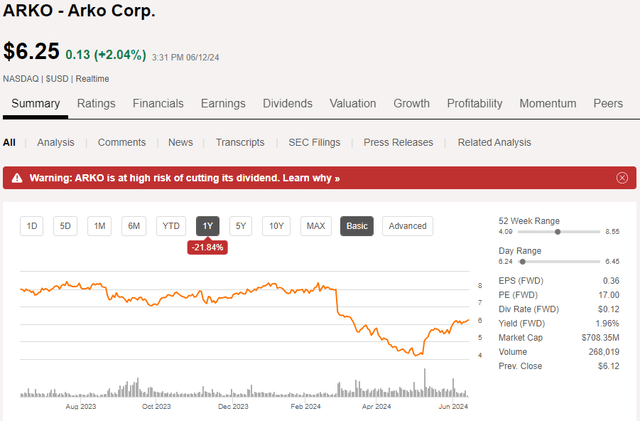
Looking at their tenant list, the one I am most concerned with is Arko Corp. (ARKO), which is a $700 million market cap publicly traded convenience store operator. To date, there have been no problems, but ARKO does operate its business in a fairly aggressive fashion. It has strong revenue growth but low overall profitability due to overhead.
ARKO’s stock price dropped precipitously in early 2024.
It has since recovered on the back of a strong 1Q24 report featuring a substantial beat on earnings. It was recently added to the Fortune 500.
Thus, ARKO is not a bad company. It could be on the path to great success, but in its early stages, I think there is quite a bit of sensitivity. Thus, as an investor in Getty, I will be paying close attention to the strength of ARKO.
Otherwise, early indicators of risk for Getty would be anything that impacts the number of vehicles on the road. During recessions, people tend to drive less, which would likely have some modest implications for market rental rates of convenience stores.
Putting it Together
Overall, I think Getty presents a compelling investment. At its low multiple, it has an AFFO yield in excess of 8% which comfortably funds its 6.8% dividend yield. Fundamentals suggest AFFO/share will continue to grow at a mid-single-digit annual rate, which should enable similar increases to the dividend.
Given the discount at which it trades to asset value and historical AFFO multiples, I think there is significant potential for capital gains as well. In my opinion, fair value is around 15X AFFO which would be a price of $34.65 or about 28% upside from today’s price.
Analyst’s Disclosure: I/we have a beneficial long position in the shares of GTY either through stock ownership, options, or other derivatives. I wrote this article myself, and it expresses my own opinions. I am not receiving compensation for it (other than from Seeking Alpha). I have no business relationship with any company whose stock is mentioned in this article.
All articles are published and provided as an information source for investors capable of making their own investment decisions. None of the information offered should be construed to be advice or a recommendation that any particular security, portfolio of securities, transaction, or investment strategy is suitable for any specific person.
The information offered is impersonal and not tailored to the investment needs of any specific person. Readers should verify all claims and do their own due diligence before investing in any securities, including those mentioned in the article. NEVER make an investment decision based solely on the information provided in our articles.
It should not be assumed that any of the securities transactions or holdings discussed were profitable or will prove to be profitable. Past Performance does not guarantee future results. Investing in publicly held securities is speculative and involves risk, including the possible loss of principal. Historical returns should not be used as the primary basis for investment decisions.
Commentary may contain forward looking statements which are by definition uncertain. Actual results may differ materially from our forecasts or estimations, and 2MC and its affiliates cannot be held liable for the use of and reliance upon the opinions, estimates, forecasts, and findings in this article.
S&P Global Market Intelligence LLC. Contains copyrighted material distributed under license from S&P
2nd Market Capital Advisory Corporation (2MCAC) is a Wisconsin registered investment advisor. Dane Bowler is an investment advisor representative of 2nd Market Capital Advisory Corporation.
Seeking Alpha’s Disclosure: Past performance is no guarantee of future results. No recommendation or advice is being given as to whether any investment is suitable for a particular investor. Any views or opinions expressed above may not reflect those of Seeking Alpha as a whole. Seeking Alpha is not a licensed securities dealer, broker or US investment adviser or investment bank. Our analysts are third party authors that include both professional investors and individual investors who may not be licensed or certified by any institute or regulatory body.

The REIT market has gotten egregiously underpriced making it a great time to get into the right REITs. To help people get the most updated REIT data and analysis, I am offering 40% off Portfolio Income Solutions, but you can only get it through this link.
https://seekingalpha.com/affiliate_link/40Percent
I hope you enjoy the plethora of data tables, sector analysis and deep dives into opportunistic REITs.
