Summary:
- Goldman Sachs gets upgraded to Buy after indicators show growth potential for investment banking, asset management, and trading segments.
- The firm is #2 in market share among global investment banks and listed as a global systemically critical bank.
- With low expense growth, the firm has a track record of growing and sustaining dividends, and maintaining high regulatory capital ratios.
- Downside risk indicators are high debt-to-equity ratios, increasing debt, and share price trading at a 10-year high which could cause many investors to sell and take profits.
- Q3 results expected to meet or beat estimates, driven by the above factors as well as a declining trend in loan loss provisions.
Dan Totilca
Thesis: Upgrade Driven by Strong Metrics on Top & Bottom Line
In my follow-up coverage on financial giant Goldman Sachs (NYSE:GS), which I last rated in 2023, I would argue that it is currently a buy, which is actually an upgrade vs my rating last winter when I called it a hold.
Supporting my bullish conviction this time are the following indicators:
The firm’s Q2 earnings growth along with indicators pointing to future growth, #2 in investment banking global market share (behind JPMorgan), a diversified business model, strong capital ratios, low expense growth, proven dividend growth, and a valuation close to peer multiples.
Some potential downside risks include a growing debt and high debt-to-equity ratio, and a share price trading at a 10-year-high.
Research Methodology
Today’s article goes into on my own forward-looking estimates driven by third-party research and my own analyst worksheets, along with understanding the sector and business model, with a goal of estimating what this stock will do a year from now.
Company Overview: A Diversified, Systemically Critical Bank for the 21st Century
Much like in 2022, the Financial Stability Board listed Goldman in its 2023 list of global systemically critical banks, joining firms like HSBC (HSBC) and Deutsche Bank (DB), among others. I think this will continue to expose Goldman to increased regulator scrutiny, due to potential for systemic risk if banks like this run into serious liquidity issues.
From its SA profile, we know NYC-based Goldman “operates through global banking & markets, asset & wealth management, and platform solutions segments,” and has been around since 1869.
It continues to be led by firm veteran David Solomon, who has been with Goldman since 1999.
One area of innovation it is penetrating is platform solutions, and an example would be its TxB solution which for corporate treasurers and payment executives is a “tech-forward banking platform of choice to meet their electronic payment, foreign exchange, and liquidity needs.” I think this adds to its competitive edge in the digital era, going way beyond just being another investment bank.
Earnings Overview: A Diversified Portfolio of Revenue Streams & Q2 Earnings Growth
To briefly talk about the Q2 performance, we can see from the income statement that the quarter ending June saw significant YoY earnings growth, driven by strong top-line YoY growth across multiple segments including net interest income as well as fees-driven income.
In terms of what factors could impact earnings in a year, and thereby impacting the share price, it’s important to understand what drives earnings for a diversified global financial firm like this.
Back to the income statement, we know that net interest income ($2.2B) makes up about 18% of total revenue, investment banking ($1.7B) about 14% of revenue, asset management fees ($2.5B) about 20.3%, and the $5.1B or so from trading drives around 42% of revenue.
With that said, the two revenue drivers with biggest impact would be the asset management segment and trading, so factors I am looking for to affect future results include recent/current growth in client assets under management/supervision.. which drives future fees, and also whether there is expectation of equities markets improving in the next year, potentially driving trading income further.
To a lesser extent, Fed rate decisions will impact net interest income, and with the Fed embarking recently on rate cuts I believe it should reduce interest expenses for this firm if that trend continues however that will depend on inflation data which influences Fed decisions going forward.
From CME Fedwatch, my preferred rate predictor tool, we can see there is a 97% probability the Fed will further reduce rates to 450-475 bps at its next meeting in November, and over 80% chance of another cut in December.
Future Earnings Drivers: Asset Inflows, Loan Growth, and Investment Banking Fees
Key metrics I think could benefit future fees-driven income include the Q2 growth in net inflows of funds in the asset/wealth segment, according to the firm’s Q2 presentation:
GS – AUS growth (company presentation)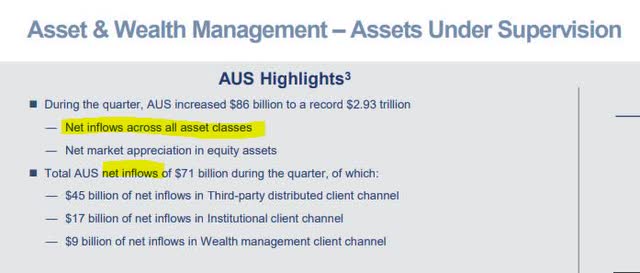
In the loan book, I looked for Q2 growth in loans which could drive future interest income, and in this case it was a mixed bag, as YoY loan growth was achieved in the global banking/markets segment while the other segments saw loan declines:
Goldman Sachs – loan growth (company Q2 presentation)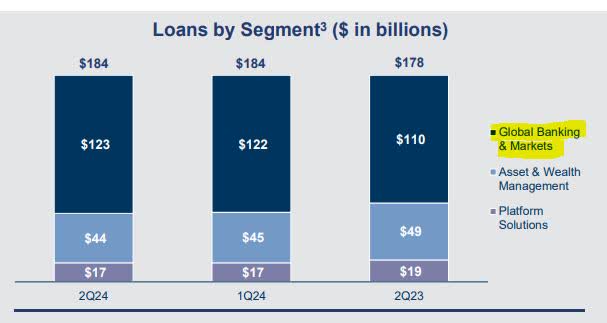
In terms of this firm’s other major segment, investment banking, what also caught my eye from the Q2 report is that “investment banking fees backlog increased significantly QoQ, driven by advisory and debt underwriting.”
Next, I want to dive into some of the macro effects and trends that could impact this firm’s various segments.
Macro Effect: Positive Indicators for Investment Banking and Equities Markets
First, I think we should consider if there is evidence that the investment banking sector will see strength in the next year, and the data this summer points to a modestly positive outlook.
According to a July article in Reuters:
Deal flow has been improving from a drought after the pandemic. Merger and acquisition volumes hit $1.6 trillion globally in the first half of the year, up 20% from a year earlier, Dealogic data showed. Equity capital market volumes climbed 10% during the same period.
While this may be good news, I think it should also be taken in the context of how much market share Goldman has in the investment banking space.
According to Statista data, Goldman is 2nd behind JPMorgan in terms of global market share in the investment banking space, as the graphic below shows, which I think points to this firm being in a strong position to take advantage of that increase in deal flow going into 2025.
Goldman Sachs – market share among investment banks (Statista)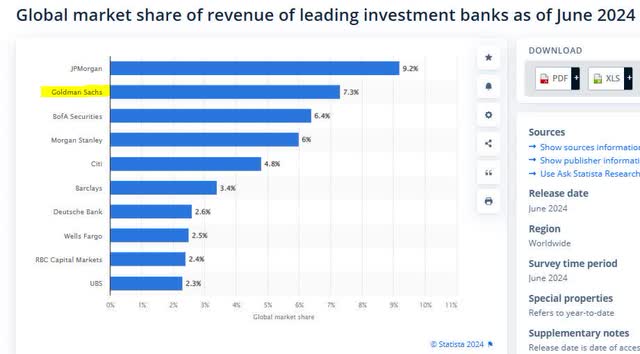
Beyond investment banking, I mentioned that growth in equity markets could benefit this firm as it can drive up the values of certain assets being managed, and trading income (fees and commissions growth), so the gauge I will look at is the potential for further growth in the S&P500 index.
From a late-September article from the Seeking Alpha news desk, there are indicators of continued growth in the index:
Goldman Sachs raised its S&P 500 (SP500) YE24 target to 5,600 in June. BMO Capital Markets last week bumped up its year-end target to 6,100, a high on Wall Street. Evercore ISI has a 6,000 target for 2024.
The S&P 500 (SP500) will likely need another year to cross above 6,000, as the U.S. election in November is a barrier for the benchmark in 2024, Goldman Sachs’ Chief U.S. Equity Strategist David Kostin said.
So, I think this could benefit a firm like Goldman in those segments of its business that benefit from higher equity markets, which are trading and asset management.
Expenses: Growth Trending Below Inflation
We have touched a lot upon top-line drivers of earnings, but we should also consider an impact to the bottom line and that is growth trends in operating expenses.
I created the below worksheet using data from the income statement, to show Goldman’s average growth in operating expenses over a period of 6 quarterly results:
Goldman Sachs – expense growth (author worksheet)
It shows Goldman has been able to keep average expense growth to 1.35% in this period, and as a benchmark, let’s use the Fed target inflation rate of 2% so we can say this firm’s operating expenses on average have grown below the target inflation rate.
By comparison, its key peer JPMorgan Chase (JPM) has a higher average expense growth, as my worksheet shows, which exceeds the target inflation rate.
JPM – avg expense growth (author worksheet)
This metric as an indicator of efficient cost management, could give some baseline indication of average expense growth over the next 6 quarters as well, for investor planning purposes, though not a guarantee of future expense growth, of course.
However, what we do know is that inflation data like the CPI according to the Bureau of Labor Statistics is now trending well below its 2022 peak, so I think that should ease some of the burden driven by inflationary costs on many goods and services both for consumers and businesses.
Price and Valuation: Trading Above Average but Valued Close to Key Banking Peers
In my initial rating of Goldman in May 2023, I called it a buy and since then it has gone up nearly 52% as of this article writing. That is quite the capital gain for those that bought at the time after my bullish call.
My followup article in December downgraded to a hold because at the time I thought revenue growth indicators were weak while the share price had climbed.
During my initial buy rating, supporting my buy case was a strong dividend yield, healthy capital position, and diversified business model, combined with what was at the time a bearish share price so I saw it as a value opportunity.
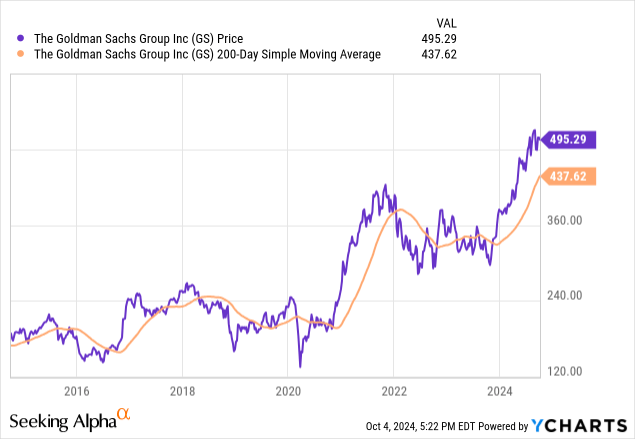
Taking a look at the price now, let’s compare it now to its 200-day SMA:
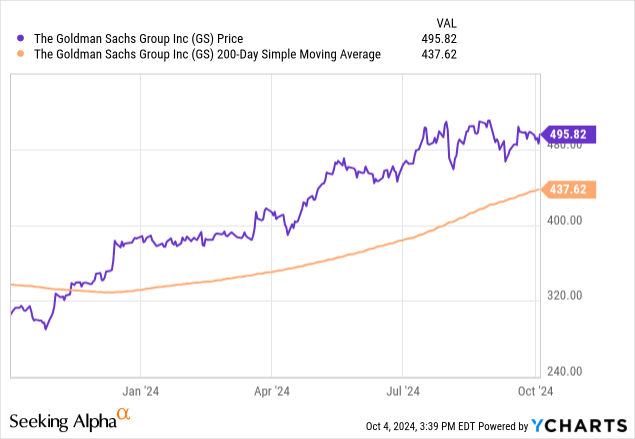
As we can see in the YChart above, the price is now trading around 13% above its moving average right now and has been on a trend above its average for the entire year, which also correlates with its SA momentum data which shows it outperforming the S&P500 index by over 20%.
On a 10 year basis, this stock has peaked at a 10-year-high, as the YChart below indicates:
Beyond just considering price alone, which at first glance may appear overly expensive now, let’s talk about valuation as well and to do, so I’ll use the forward P/E ratio, comparing to three peers: JPMorgan Chase (JPM), Bank of America (BAC), and Morgan Stanley (MS), all of which were listed in the earlier chart of top investment banks.
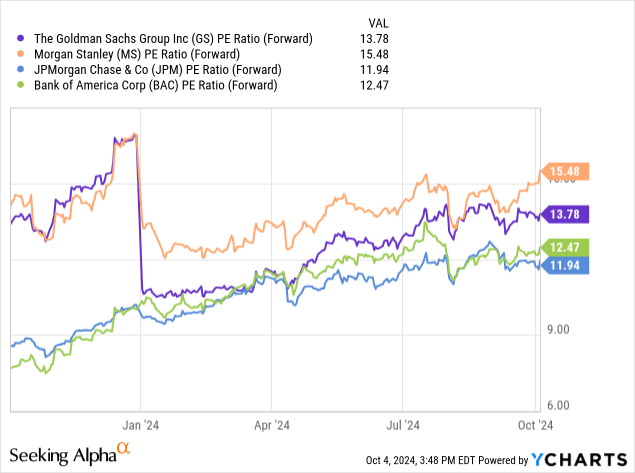
The valuation puts Goldman in the middle of this peer group, with no major outliers.
Using this data, I created a comparable companies’ analysis:
Goldman Sachs – comps analysis (author worksheet)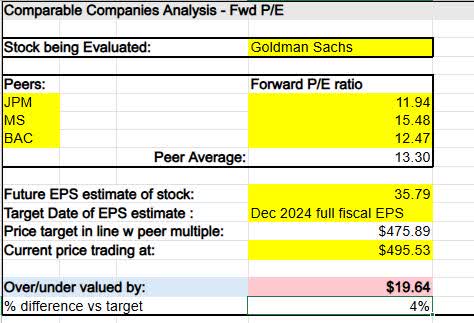
This quick comps analysis applies the average peer forward P/E multiple to the analyst EPS estimate for Goldman which is $35.79, and it indicates the current share price is overvalued by about 4%, as it should be closer to $475.89.
I usually like to have a margin of +/- 10% as some wiggle room, so I would consider a 4% overvaluation relatively small and almost in line with the peer multiple, which also tells me the market generally expects Goldman to perform in line with peers.
I think this is a justified valuation to consider, as all of these peers are more or less impacted by a lot of the same factors I mentioned: growth in investment banking, growth in the S&P500, improved net interest margins, and growth in client inflows, for example.
Dividends: Yield Close to Peers, Proven Growth
Since Goldman is a dividend payer, I want to take a moment to talk about their dividend picture in terms of yield, growth, and sustainability.
With a $3/share quarterly payout and 2.47% yield, the other key point to call out is that over the last 10 years the firm has steadily grown its dividend.
When comparing the yield vs the key peers, Goldman appears to be relatively in line with peers (range of 2% – 3% yield), so no major outliers here either.
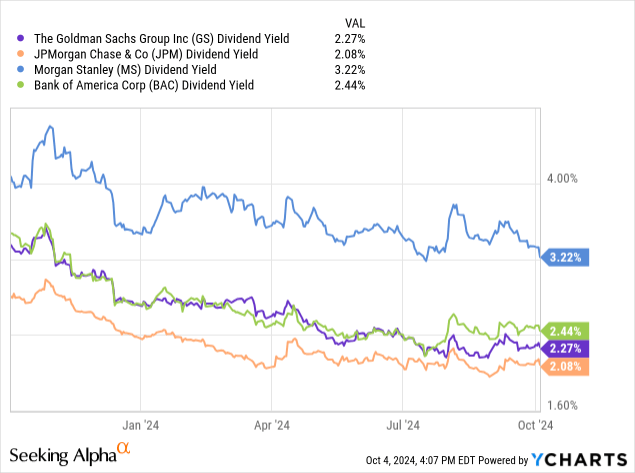
I expect a strong likelihood of continued dividend sustainability and growth can be expected, considering recent earnings growth and future growth potential, and this is great news for fellow dividend-income investors.
Risk Topic: Growing Debt but Strong Capital Ratios
When considering a risk factor, I think about excessive indebtedness but also in the context of peers. An easy ratio I like to use is debt/equity, and here is how Goldman compares to the three key peers I picked:
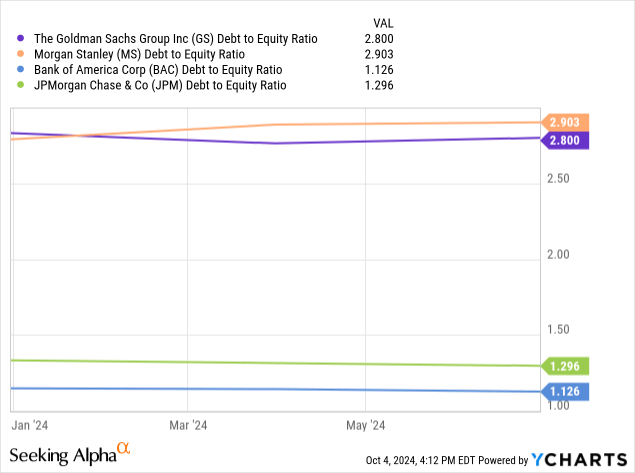
In this chart, Goldman is on the high end of this peer group in terms of DTE. Taken together with the balance sheet data, we can see that long-term debt at this firm grew on a YoY basis to +$242B.
However, I think one should also consider that this firm has strong capital ratios well above regulatory minimums. According to its Q2 presentation, we can see the CET1 capital ratios have improved in Q2 to 14.8%, a good sign.
Goldman Sachs – capital ratios (company Q2 presentation)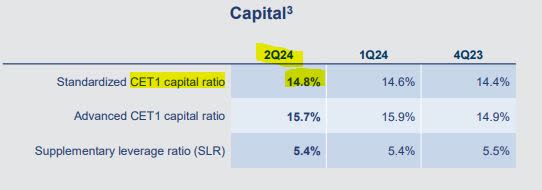
Wrap Up: SWOT Analysis Points to Buying Indicators
To wrap up our discussion today, here is my thesis in the form of a SWOT(strengths, weaknesses, opportunities, threats) analysis, which supports my strong conviction to buy this stock, as the buying indicators (strengths and opportunities) heavily weigh against selling indicators (weaknesses, threats).
Goldman Sachs – swot analysis (author worksheet)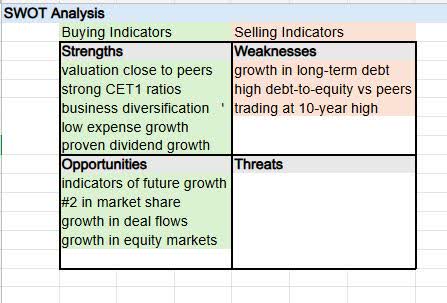
In terms of downside risk, as I already indicated it could come from investors jittery about the company’s high debt-to-equity and share price at a 10-year-high; however, I believe there will be enough support from investors sharing my confidence about Goldman and the buying indicators shown.
A Preview of Q3: Likely Will Meet or Beat Analyst Estimates
When looking forward towards Q3 earnings results which are due in just over a week, one indicator of confidence is a significant dividend hike in Q2. According to the quarterly report:
On July 12, 2024, the Board of Directors of The Goldman Sachs Group, Inc. approved a 9% increase in the quarterly dividend to $3.00 per common share beginning in the third quarter of 2024.
This tells me that the firm likely expects continued positive results in Q3, which justify hiking the dividend.
We also know that the firm has beat 3 of the last 4 analyst estimates.
Besides the other factors I already mentioned which could drive my bullish conviction heading into Q3, including growth in client assets, trading, investment banking deals in the pipeline, as well as lower interest costs, one other factor to mention that, I think, could help Q3 results is declining trends in the provision for credit losses.
According to the firm’s Q2 commentary:
Provision for credit losses was $282 million for the second quarter of 2024, compared with $615 million for the second quarter of 2023 and $318 million for the first quarter of 2024.
Within its peer group, I should note that Morgan Stanley (MS) also saw a trend of YoY declines in credit loss provisions in Q2, as reported by both the Seeking Alpha news desk and Marketwatch, the firm’s loss provision dropping to $76MM vs $161MM a year prior. This indicates these two global banks are “expecting” lower loan losses.
This is a contrast to their sentiment last year, as highlighted in an Oct. 2023 article in International Banker magazine, citing concerns over a potential recession in 2024, corporate loan defaults, exposure to office property, and high interest rates.
We know now there has not been any recession reported in 2024 and we are already in Q4, while at the same time we are seeing the Fed starting to cut interest rates which, I think, will lead to cheaper borrowing and refinancing costs for clients.
Thus, I expect Goldman to either meet or beat analyst estimates for Q3.
Rating Comparison: More Bullish than Analysts and Quant System but In Line with Wall Street
To compare my rating today against that of others on this firm’s SA stock page, this time I am being more bullish than both the quant system and analyst consensus which called for a hold of this stock, but my rating is in line with Wall Street which called for a buy.
ratings (SA) Goldman Sachs -ratings (SA)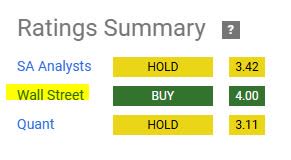
Analyst’s Disclosure: I/we have no stock, option or similar derivative position in any of the companies mentioned, and no plans to initiate any such positions within the next 72 hours. I wrote this article myself, and it expresses my own opinions. I am not receiving compensation for it (other than from Seeking Alpha). I have no business relationship with any company whose stock is mentioned in this article.
Seeking Alpha’s Disclosure: Past performance is no guarantee of future results. No recommendation or advice is being given as to whether any investment is suitable for a particular investor. Any views or opinions expressed above may not reflect those of Seeking Alpha as a whole. Seeking Alpha is not a licensed securities dealer, broker or US investment adviser or investment bank. Our analysts are third party authors that include both professional investors and individual investors who may not be licensed or certified by any institute or regulatory body.
