Summary:
- The Dow Jones Industrial Average fell 350 points after Salesforce’s earnings disappointed investors.
- The trend in the Dow and the US stock market is bending lower, increasing the potential for a downward tilt in the coming months.
- Goldman Sachs’ chart is a key indicator for the Dow’s future, and its recent performance suggests a potential decline.
Jonathan Kitchen
Earlier this week, the Dow Jones Industrial Average had a moment that reminded me of a pop song that was rolling around in everyone’s head back in 2005: Bad Day, by Daniel Powter. The chorus includes this:
You had a bad day, you’re taking one down
And that’s pretty much what happened to the Dow on Thursday, after Salesforce (CRM) didn’t crush earnings. Instead, the stock price was crushed by its earnings. The Dow fell 350 points, extending a stretch of seven trading days that brought that index from traders wearing hats proclaiming “40,000” to touching 38,000, 5% lower. But that’s just short-term trader jive, right? Maybe not.
Because I see something developing that increases the potential for the last seven months of 2024 to be tilted downward. And I’ll show my “evidence” below. But first, let’s be clear of something, since I know from answering more than 2,000 subscriber comments in the past 12 months that teach that there are two things I can write that will create turmoil where there shouldn’t be.
First, any investor who considers any analysis of stocks or markets to be absolute (as in “right or wrong”) is missing what I think it is the most important reason some investors last and others eventually pack it in. I am all about probabilities.
Every single stock and ETF I evaluate, and have for more than 30 years, is a measured tradeoff between potential “reward” (it makes money between my buy and sell prices) and risk of “major loss” which to me has little to do with how much a stock falls, and a lot to do with how much of my portfolio I allocate to it. It is more about how much I own than what I own. That’s why, when we think of investing as portfolio management and not “picks,” I think any investor can add several percentage points a year to their long-term annualized investment return.
Salesforce is the “bait” but Goldman Sachs’ chart is more important to the Dow’s future
Salesforce’s plunge accounted for the majority of the Dow’s decline for that one bad day. As the song says, they took one down. But that’s an event, not a trend. And it is the trend in the Dow, and likely in much of the US stock market, bending lower in ways that to me, as a chartist for 44 years, is enough to write an article about it.
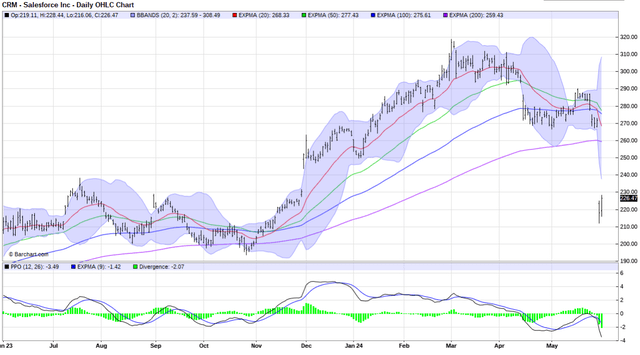
Here’s CRM’s nosedive. This is a great example of what I see all the time on earnings reports that go bad. A stock whose price has been bid up in anticipation of a “big quarter” gives back months of recent gains. In the case of CRM, it was knocked all the way back to its price level from about six months ago.
CRM: a prime example of why I use position-sizing instead of stop orders
For decades, I’ve heard investors talk about the beauty of stop loss orders. But when it comes to earnings events, I think that is about the most misguided approach one can take, and CRM just reminded us why. It closed one day around $270 and opened the next morning way down at $220. If you have stop loss order set to kick in at, say, $265, guess what? You are not selling at $265. You are selling at $220. Unless it is a stop limit order, in which case nothing happens because the stop limit price is above the current price.
This is investing 101 in that it is something investors should understand before they use any investing tools like stop orders, options, levered ETFs, etc. Many do, but I have seen that many don’t, and it frustrates me (for them). When an under-trained but overconfident investor tries to learn how to invest with speed and “action” instead of developing a process, they open themselves to this type of miscalculation. If the Dow and the rest of the stock market follows through to the downside, I expect we’ll hear many stories like that. That’s one reason I write.
Barchart
This should not be confused with some sort of gloom and doom forecast. I don’t do forecasts, I evaluate probabilities and adjust my portfolio as I see fit. Every investor ultimately has to look at themselves in the mirror. So, here’s my evidence that I think increases the chance (not assures) that the Dow Jones Industrial Average puts 40,000 well into the rearview mirror.
Besides, as stated here frequently, I like the Dow’s quirky price-weighted construction better than the S&P 500 and Nasdaq 100 in the current environment. Those other two market measures are so top-heavy, it distorts investor perception of what the market is really doing. But the way it looks to me now, I don’t expect the Dow or any major part of the stock market to do me any favors.
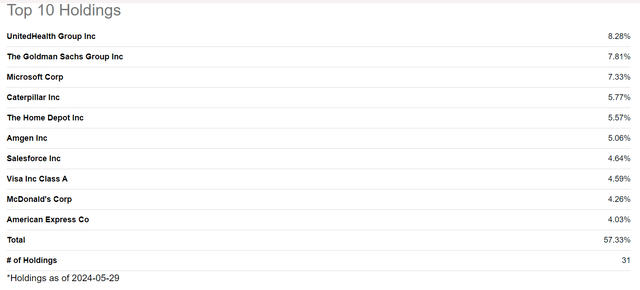
Salesforce was only the eighth-largest holding of the 30-stock Dow Industrials before the price broke down on Thursday. Goldman Sachs (NYSE:GS), which I think is the “prototype” chart for what many Dow component stocks look like, is the second-largest holding at nearly 8% of the index and the SPDR Dow Jones Industrial Average ETF Trust (DIA), the largest Dow-tracking ETF. Here are DIA’s top 10. With the Dow being only 30 names, each one takes on extra importance. This snapshot was from the day before CRM’s sharp drop.
Seeking Alpha
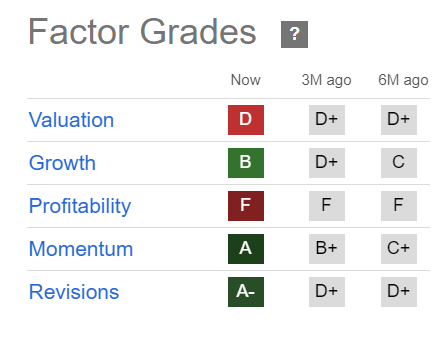
GS’s Seeking Alpha Factor Grades doesn’t paint a great picture. And the stock is historically very sensitive, not immune to cracks in the financial system, which are a clear risk in the quarters and years ahead. This could weigh on the Dow, given that high weighting for this stock.
Seeking Alpha
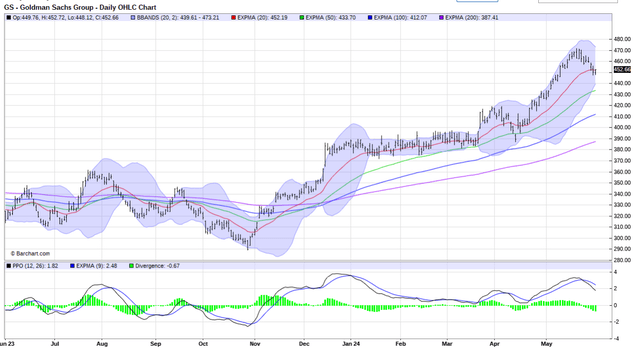
Here’s the chart for GS using daily prices. What do I see that concerns me? The easy visual is a price that surged and is now rolling over. Sure, it could stop, but the 20-day moving average (red line) is bending and may be topping out. More often than not, that is a financial “death knell” for a stock, perhaps a 10% drop to start. Again, this is more like saying something smells like it is burning, rather than I can see the fire in front of me. But that’s how risk management works. Speculation is different, and I don’t do much of that.
Barchart
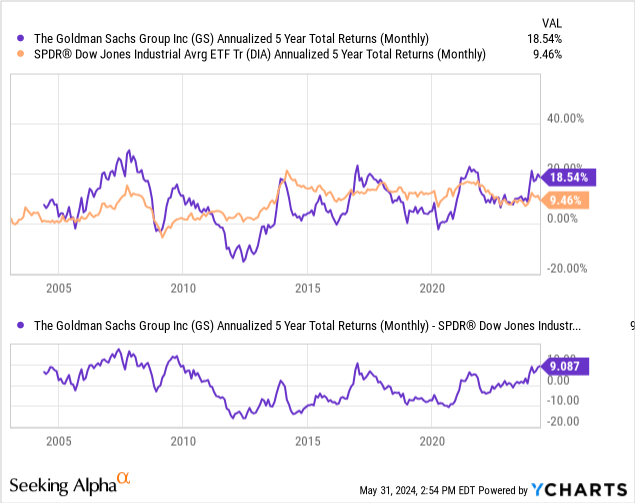
The chart above shows that GS is topping out in another way that I drill down to frequently in my stock price analysis, but I suspect few technicians do. The stock’s 5-year annualized return of 18.5% is about where it tires out historically. This would be the fifth time in that range.
I know that might seem like voodoo to some, but all I can say is, this is the type of below-the-radar analysis that investors often are shown after the stock has rolled over and fallen, not before. So there it is for consideration. It adds to my cautious view on GS, which feeds into my cautious view on the Dow.
The bottom section of the chart above shows that GS’s annualized spread over DIA is also at a tenuous high level, at more than 9% a year for the past five years. GS did not get added to the Dow until 2013, but the analysis is still quite valid to me.
And here are the other top-weighted holdings in the Dow, though CRM has dropped down for now, given this week’s action. These are all profitable companies and so long-term, they ought to do OK relative to the broad stock market.

Seeking Alpha
However, the operative word there is “relative.” As they say, we can’t eat relative investment returns. My style is so focused on generating positive returns as often as possible, and when losses do occur, and of course, they do, I aim to keep them “short-term and shallow in magnitude” as I used to tell my private clients when I was a full-time working fellow.
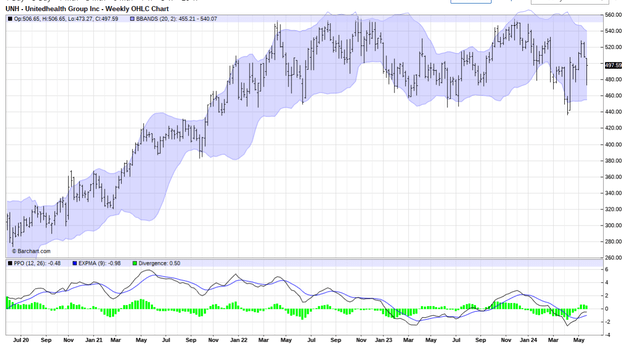
As I said, GS’s chart looks like many others in the Dow to me, and here is UnitedHealth Group (UNH), the largest member of the Dow Index. This is a weekly chart showing that it has already advanced a bit further down the road than GS, in that it rolled over (twice, really), rallied, and then tried out again. That leaves it in a trading range with modest downside at best, and on the precipice of a much deeper drop at worst. As usual, I’m evaluating the odds so to speak, not making outright predictions. But I see enough here to stay clear of this one. I would need a lot more evidence that this is not just one of many stocks caught up in the current malaise.
Barchart
Lastly, on this group and on GS, which collectively influence about 45% of the Dow Jones Industrial Average: valuations are universally rich, and we can see that CRM was an F rating just before this week’s cratering of its stock price. I suspect there will be more “Salesforces” as 2024 continues. Growth is mixed, but I see plenty of signs that the market is running out of reasons to keep bidding up stocks based on earnings growth. The market’s P/E multiple has driven much of the recent spike in the top-heavy stocks that drive the indexes, and gravity still exists in this world.
Conclusion: what the stock market is and isn’t
For me, I truly do not care which way the market goes. My style is not about rooting for the market to do something. I am all about taking what the market gives me. It is a tool to be used to manage wealth, just an inanimate object that does not care about me and my personal investment objectives.
Salesforce’s steep 1-day price drop only caused the Dow to “have a bad day.” They took one down, as the song says. But going forward, I think investors should be very careful simply looking at this as another “buy the dip” situation. Maybe it will be. But I always ask myself, “what’s the biggest mistake I can make?” In market climates like the current one, the answer is usually the same: don’t get greedy, don’t be a hero, T-bills yield 5%-plus and there are stocks outside of the daily news headlines that look better than the vast majority of the 30 in the Dow until this “bend in the trend” to the downside resolves itself.
Analyst’s Disclosure: I/we have no stock, option or similar derivative position in any of the companies mentioned, and no plans to initiate any such positions within the next 72 hours. I wrote this article myself, and it expresses my own opinions. I am not receiving compensation for it (other than from Seeking Alpha). I have no business relationship with any company whose stock is mentioned in this article.
Seeking Alpha’s Disclosure: Past performance is no guarantee of future results. No recommendation or advice is being given as to whether any investment is suitable for a particular investor. Any views or opinions expressed above may not reflect those of Seeking Alpha as a whole. Seeking Alpha is not a licensed securities dealer, broker or US investment adviser or investment bank. Our analysts are third party authors that include both professional investors and individual investors who may not be licensed or certified by any institute or regulatory body.
