Summary:
- A 20% annualized return from Alphabet Inc./Google is possible, including covered call premium, dividend, and only $2.71 in price appreciation.
- 2024 growth from Google Search, YouTube, and Subscriptions.
- Good technical entry point resulting from fear of regulatory fines and government intervention.
- Google EPS and P/E ratio trends provide reasonable indications for stock price appreciation.
- Strong free cash flow allows Google to grow in many directions.
Bill Oxford
Summary
- Even if Alphabet Inc. aka Google’s (NASDAQ:GOOG, NASDAQ:GOOGL) stock price only trades from $162.29 to $165.00 by March 21st, a 20% potential annualized return is possible, including covered call premium, dividend, and only $2.71 in price appreciation.
- 2024 Growth from Google Search, YouTube, Subscriptions and Cloud.
- Strong Free Cash Flow allows Google to grow in many directions.
- Good entry point, resulting from fear of regulatory fines and government intervention.
- GOOGL EPS and P/E Ratio trends provide reasonable indications for stock price appreciation.
Sell Covered Calls
This is an update from my December 2022 article on Google, in which I proposed that readers could make a 24.7% annualized return using covered calls. My answer to uncertainty is to sell covered calls on GOOGL six months out. Google closed at $162.29 on September 24th, 2024, and March’s $165.00 covered calls are at or near $12.85. One covered call requires 100 shares of stock to be purchased. The stock will be called away if it trades above $165.00 on March 21st. It may even be called away sooner if the price exceeds $165.00, but that’s fine since capital is returned sooner.
The investor can earn $1,285 from the call premium, $271 from stock price appreciation, and $20 from the dividend. This totals $1,576 in estimated profit on a $16,229 investment, a 20% annualized return since the period is 177 days.
If the stock is below $165.00 on March 21st, investors will still make a profit on this trade down to the net stock price of $162.29 minus $12.85 covered call premium, or $149.44. Selling covered calls reduces your risk.
Investment Thesis
Google should see higher stock prices due to continued growth in almost all its business segments. Even if the stock price does not move much, the covered call premium and dividend can provide an excellent return for GOOGL.
Google’s revenue, as shown in its filings, grew 14.4% to $165.28B in January-June 2024 versus $144.39B in January-June 2023. Almost all of its business segments showed growth. Google Cloud revenue was the leader, with 28.6% growth from $15.55B to $19.92B.
Google 8K Report page 37 (www.abc.xyz/investor/)
Google is a cash-flow cow, in my opinion. On the balance sheet, they have $100.7B in cash and cash equivalents and only $27.8B in debt.
Google is 81% owned by institutions, with only 1.2% short interest. Its return on equity is 29.2%, and its return on invested capital is 26.8%. Its free cash flow yield per share is 3%, and its buyback yield per share is 3.2%. Google’s S&P credit rating is AA+. Only 7% of total assets are considered intangible, hard-to-value, non-physical assets. Its price-to-book ratio is 6.6.
Good Entry Point
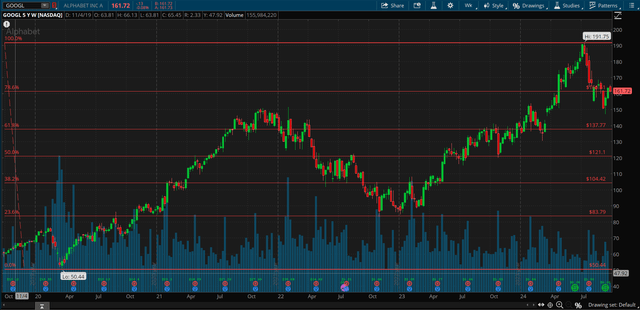
The stock price declined from $191.75 on July 10th as investors feared potential regulatory fines and government intervention. I see the September 24th closing price of $162.29 as having much of that risk already priced in.
In 2023, more than 75% of total revenues came from online advertising. Advertisers, companies that distribute Google products and services, digital publishers, and content providers can terminate their contracts with Google at any time, but they are unlikely to do so in the near term.
Google creates more value (such as increased users or customers, new sales leads, increased brand awareness, or more effective monetization) than its available alternatives. Advertisers still value their expertise in search algorithms and machine learning, as well as their access to and accumulation of data.
Technical Entry Point
The share price of GOOGL closed at $162.29 on September 24th. I’ve added the red Fibonacci lines, using the high and low of the past five years for GOOGL. It’s interesting to note how the market pauses or bounces off these Fibonacci lines. They can be one clue as to where the stock price may be headed. GOOGL is currently at the 78.6% Fibonacci retracement level but could go lower. However, I believe that GOOGL will trade above $165.00 by March for the reasons in this article.
Schwab Think or Swim (www.trade.thinkorswim.com/)
The thirty-two most accurate analysts have an average one-year price target of $201.00, indicating a 24% potential upside from the September 24th trading price of $162.00 if they are correct. Their ratings are twenty-three buys, nine holds, and no sells. Analysts are just one of my indicators, and they are not perfect, but they are usually in the ballpark with estimates or at least headed in the right direction. They often seem a bit optimistic, so I suspect prices may end up lower than their one-year targets to be on the safe side.
Trends In Earnings Per Share and P/E Ratio
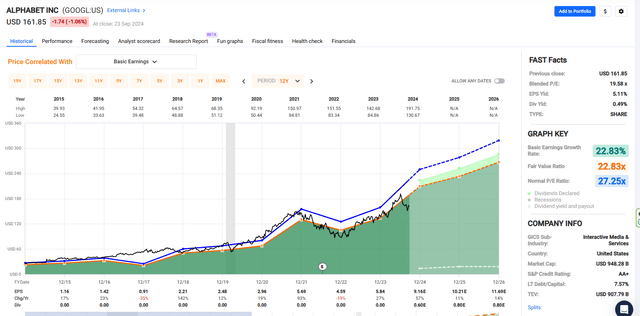
The black line shows GOOGL’s stock price for the past ten years. Look at the chart of numbers below the graph to see that GOOGL’s adjusted earnings were $5.61 in 2021, $4.56 in 2022, and $5.80 in 2023. They are projected to earn $7.65 in 2024, $8.67 in 2025, and $9.96 in 2026.
GOOGL’s P/E ratio is currently 18.7, but if the market assigns a 22 P/E as it has in the past and GOOGL earns $8.67 in 2025, the stock could trade at $190.74.
FastGraphs.com (FastGraphs.com)
Takeaway
Google’s stock prices should rise due to expanding internet usage and advertising revenue. Even if GOOGL’s stock price only moves from $162.29 to $165.00 by March 21st, a 20% potential annualized return, including the covered call premium, small price appreciation, and dividend, is possible.
This article was written by
My primary focus is on value stocks showing growth potential. The 3-part strategy includes recognizing macro trends, seeking innovation, and capitalizing on event overreaction. The process begins by running filters with 28 key criteria, and then continues by considering over 120 data points on each investment. I listen to quarterly earnings reports and read 10Q reports. Fundamental Analysis is used to select stocks, and Technical Analysis plus Artificial Intelligence are used to identify the entry, trend, and exit points.
Analyst’s Disclosure: I/we have no stock, option or similar derivative position in any of the companies mentioned, and no plans to initiate any such positions within the next 72 hours. I wrote this article myself, and it expresses my own opinions. I am not receiving compensation for it (other than from Seeking Alpha). I have no business relationship with any company whose stock is mentioned in this article.
Seeking Alpha’s Disclosure: Past performance is no guarantee of future results. No recommendation or advice is being given as to whether any investment is suitable for a particular investor. Any views or opinions expressed above may not reflect those of Seeking Alpha as a whole. Seeking Alpha is not a licensed securities dealer, broker or US investment adviser or investment bank. Our analysts are third party authors that include both professional investors and individual investors who may not be licensed or certified by any institute or regulatory body.
