Summary:
- Alphabet Inc./Google’s recent AI-related CAPEX surge has raised concerns.
- Applying Warren Buffett’s $1 test, Google is still turning $1 of retained earnings into over $3 in market cap gain.
- Price overreactions caused by such concern thus may present a buying opportunity.
- Currently trading at a forward P/E of ~21x, Google is the most attractively valued stock within the FAANG group.
VioletaStoimenova/E+ via Getty Images
I covered Google’s (NASDAQ:GOOG, NASDAQ:GOOGL) stock, aka Alphabet Inc., more than a month ago in August with an article entitled “Google Vs. SearchGPT And DOJ.” The company has been facing several key headwinds lately, leading to a sizable price correction recently, as illustrated by the chart below. The headwinds included the potential launch of a search engine by a key rival, OpenAI, and also the possibility that the DOJ pushes for a breakup of the company, which was the focus of my previous article.
Since then, a new issue that has caught my attention was, the recent heavy CAPEX expenditure, special those targeted for AI applications. Indeed, as you can see from its cash flow statement below, its quarterly CAPEX reached $13.2 billion in June 2024, almost double the amount a year ago when the AI arms race started to heat up. Reading through recent analyses on the stock since my last writing, multiple analysts have questioned the return potential of such investments.
To differentiate this article from existing analyses on the topic, I will apply a more objective approach (the so-called Warren Buffett’s $1 test) and refrain from applying my subjective judgment on the issue. In the remainder of this article, you will see why my results do show some signs of concern, but not any alarming red flags. As such, my view is that the recent price corrections very likely overreacted to the various headwinds and thus created an entry opportunity for long-term investors.
GOOG stock: Buffett’s $1 test
As far as know, the $1 test, like many other brilliant concepts, came from Warren Buffett. Buffett’s 1984 Berkshire Hathaway (BRK.B) (BRK.A) shareholder letter (quoted below) captured the essence of the method:
“Unrestricted earnings should be retained only when there is a reasonable prospect – backed preferably by historical evidence or, when appropriate, by a thoughtful analysis of the future – that for every dollar retained by the corporation, at least one dollar of market value will be created for owners. This would happen only if the capital retained produces incremental earnings equal to, or above, those generally available to investors.”
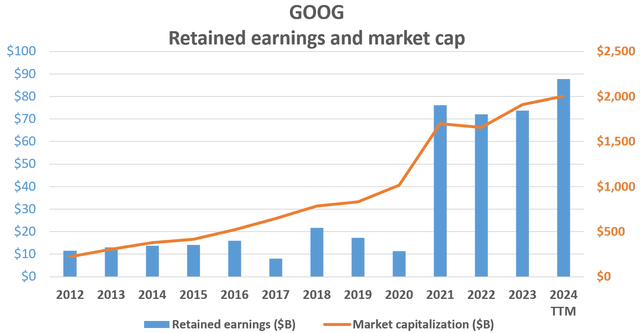
Besides its good common sense, the method also offers the advantage of being objective. All the inputs required in this test — earnings retained and also the company’s market cap changes — are easily obtained and mostly free from subjective interpretation. These inputs are shown for GOOG in the past 10 years. Since the company only started paying a small dividend recently, essentially all the earnings thus far have been retained (shown by the blue bars in the first chart).
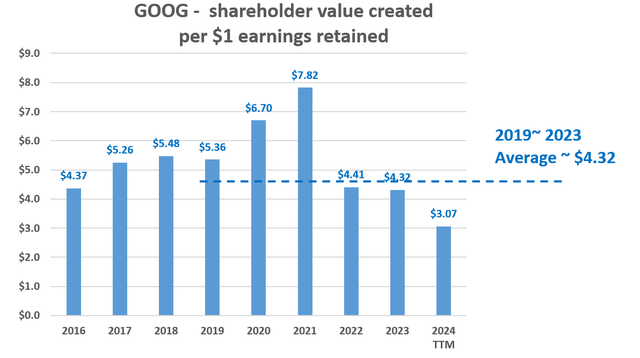
Based on these inputs, the next table below displays the scorecard for GOOG’s $1 test during this period. As seen, the company has passed – and is still passing — the test with flying colors. Note that to smooth out the stock price volatility and also year-to-year earning volatilities, I have applied a 5-year running average to both the market capitalization data and the retained earnings data. For every $1 of earnings retained, GOOG has rewarded shareholders with more than $4 of market capitalization gain between 2016 and 2023. On average, GOOG’s market cap has grown 4.32x of the retained earnings for the 5 years between 2019 and 2023 as seen.
With this historical perspective, now let me move on to address the concern at hand – the surging investment in AI.
GOOG stock: AI investment in focus
As an attempt to isolate the impact of its recent AI-related expenditures, the following worksheet provides more intermediate steps involved in the $1 test above. To wit, the first row of the worksheets shows the annual retained earnings. As of TTM, the company earned about $90B and paid out a dividend of around $2.5B in the past quarters. As a result, the company has retained more than $87.6 billion, drastically more than the previous years. The good news is that this reflects the robust earnings growth of the company, the bad news is of course now the company indeed could use more retained earnings to fund its CAPEX projects.
Its retained earnings not only increased drastically in terms of dollar amount but also as a percentage of its market cap as seen. As of TTM, the amount of retained earnings is about 4.4% of its market cap, far above the historical average in the past decade (about 3.2% only).
On the other hand, its market cap growth has slowed. Compared to 5 years ago, GOOG has gained about $983 billion in its market cap during this period. This translates into an average MC gain of $3.07 on a TTM basis for each $1 of retained earnings, noticeable below the average of $4.32 before the AI expenditures intensified.
Other risks and final thoughts
Admittedly, the AI deployment is still in an early stage. And the AI-related expenditures GOOG incurred thus far face large uncertainties in generating healthy returns. However, a return of more than 3x in market cap for every $1 retained – even though lower than its historical average — is still an exemplary rate of return in my view. As an additional positive, the recent price corrections have pulled its P/E multiples to a more attractive level. Trading at an FWD P/E of 21.3x, it is the most attractively valued member of the FAANG group as seen.
In terms of downside risks, GOOG faces the same set of risks common to others, such as competition and also regulatory risks. As detailed in my last article, OpenAI’s plan to launch SearchGPT and DOJ’s potential push to break up GOOG are the latest examples. Here, I will focus more on a downside risk that is more specific to the approach used in this article. GOOG’s CAPEX increases have indeed been outpacing its operating income growth lately.
As seen in its cash flow statement below, in the most recent quarter, GOOG invested over $13.2B in CAPEX, about 92% higher than the figure a year ago. However, its cash earned from operations (CFO) stayed largely the same (actually decreased a bit in the last quarter compared to a year ago). In the last quarter, GOOG spent about 50% of its CFO on CAPEX, vs. about 1/3 in 2022 and 2023. This trend, if it persists or further worsens, can squeeze its profit margin and pressure the stocks’ return potential.
To conclude, GOOG faces a range of headwinds. The top 3 on my list include potential competition from SearchGPT, the potential of an antitrust case from the DOJ, and also heavy AI-related CAPEX requirements. My earlier article examined the first two and this article focused on the third one by the $1 test. Based on the results, its recent surge in CAPEX has indeed dragged its scorecard noticeably compared to its past. However, as of TTM, the company still reported a 3.07x return in market cap for every $1 of earnings retained. Given the potential synergies of its products with AI features, I am optimistic that such a robust rate of return could sustain or even further increase to the 4x+ level the company used to enjoy in the past.
Analyst’s Disclosure: I/we have no stock, option or similar derivative position in any of the companies mentioned, and no plans to initiate any such positions within the next 72 hours. I wrote this article myself, and it expresses my own opinions. I am not receiving compensation for it (other than from Seeking Alpha). I have no business relationship with any company whose stock is mentioned in this article.
Seeking Alpha’s Disclosure: Past performance is no guarantee of future results. No recommendation or advice is being given as to whether any investment is suitable for a particular investor. Any views or opinions expressed above may not reflect those of Seeking Alpha as a whole. Seeking Alpha is not a licensed securities dealer, broker or US investment adviser or investment bank. Our analysts are third party authors that include both professional investors and individual investors who may not be licensed or certified by any institute or regulatory body.
As you can tell, our core style is to provide actionable and unambiguous ideas from our independent research. If your share this investment style, check out Envision Early Retirement. It provides at least 1x in-depth articles per week on such ideas.
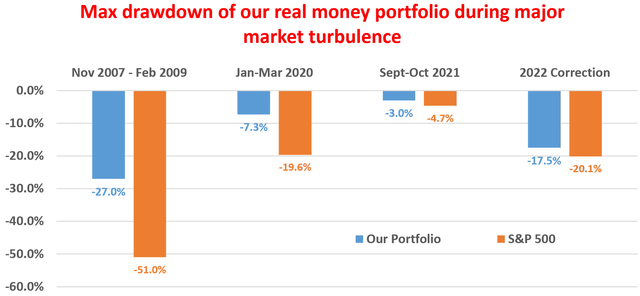
We have helped our members not only to beat S&P 500 but also avoid heavy drawdowns despite the extreme volatilities in BOTH the equity AND bond market.
Join for a 100% Risk-Free trial and see if our proven method can help you too.


