
Summary:
- Alphabet’s stock has seen recent downside volatility, recently pulling back to support levels, presenting a strong buying opportunity ahead of its next earnings report.
- Alphabet’s Q2 earnings exceeded expectations with $1.89 per share and $84.74 billion in revenue, but YouTube’s ad revenue fell short of estimates.
- Alphabet’s forward P/E ratio of 21.5x is attractive compared to other Mag 7 companies, suggesting the stock is undervalued and has room to grow.
- Potential resistance zones have formed near $170.30 and $176.30, with upside potential outweighing downside risks, favoring a bullish outlook for GOOG shares going forward.

da-kuk
When I last covered Alphabet Inc. (NASDAQ:GOOG) with a buy rating on April 28th, 2024, the stock was in the process of moving toward all-time highs near $193.31. After the article was published, the stock rallied further by 13.2% over the next 10 weeks:
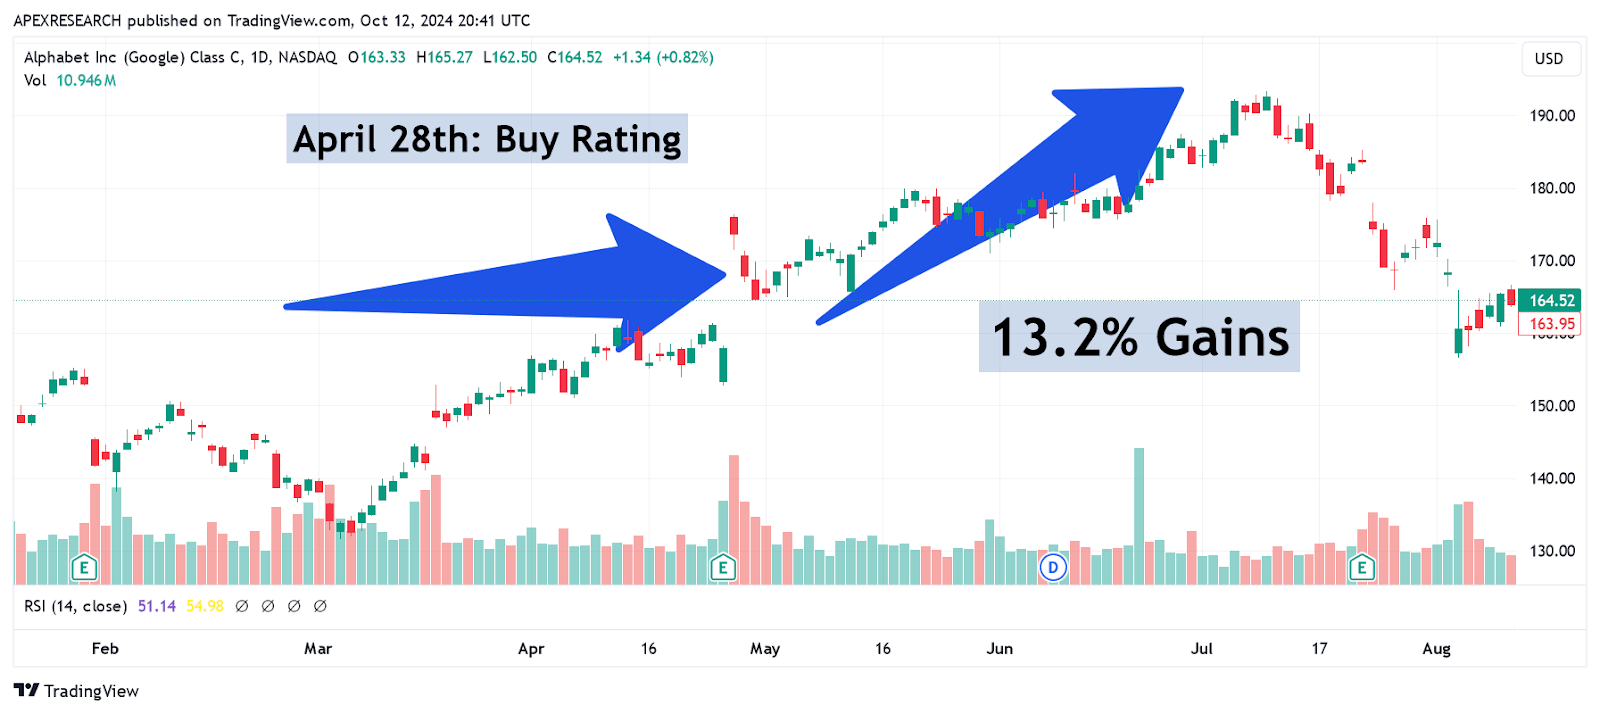
GOOG: Gains Follow Initial Buy Recommendation (Income Generator via Trading View)
However, after the stock registered these all-time highs on July 10th, 2024, the stock quickly reversed lower and encountered losses of -23.33% in less than two months:
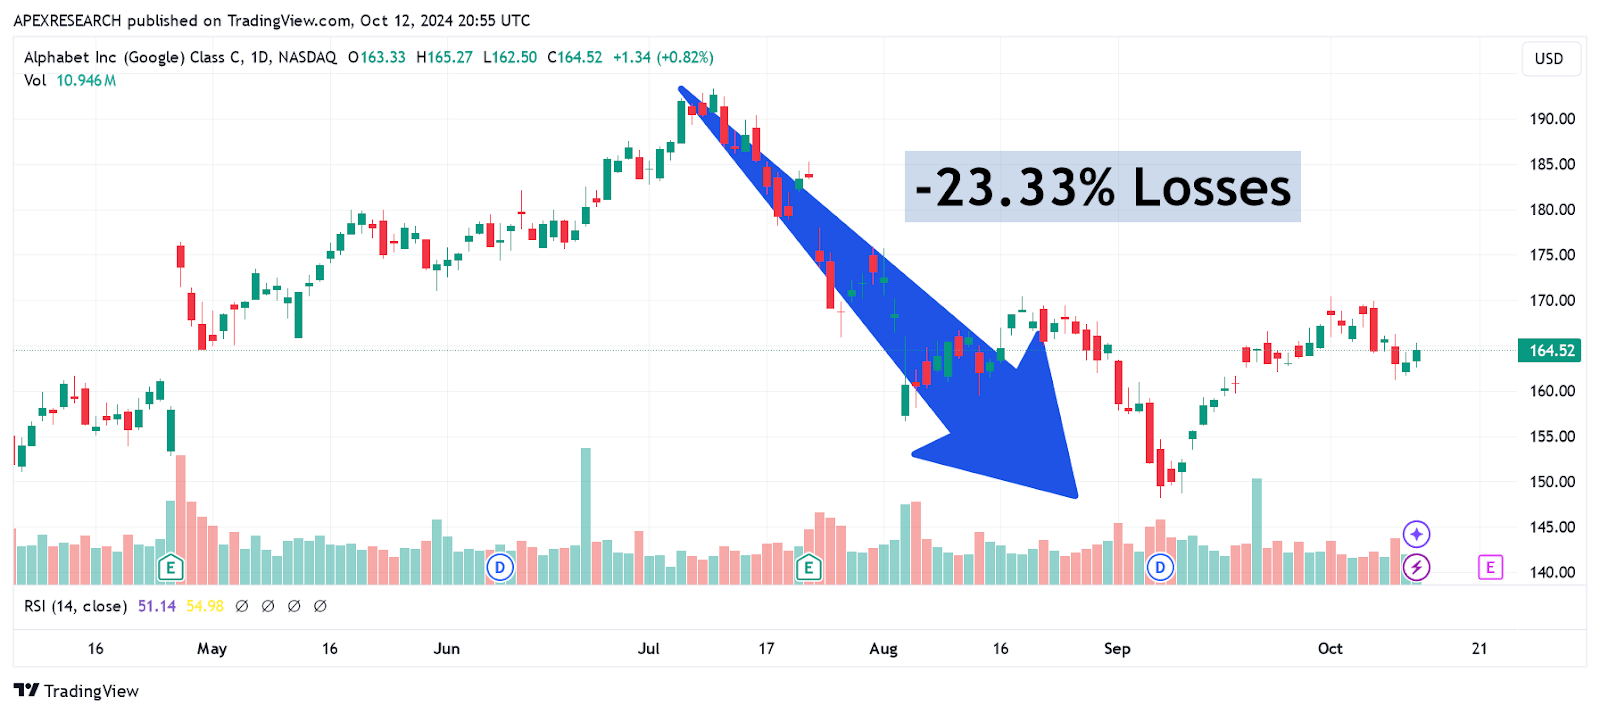
GOOG: Bearish Reversal Sends Stock to New Lows (Income Generator via Trading View)
However, these extreme price movements to the downside have started to slow in intensity and I believe that we are now seeing a tremendous buying opportunity developing for GOOG share prices near current levels. Heading into the mega-cap tech giant’s next earnings report, I will be looking to assess whether the stock has formed a sustainable base that is likely to maintain itself following this next significant event risk.

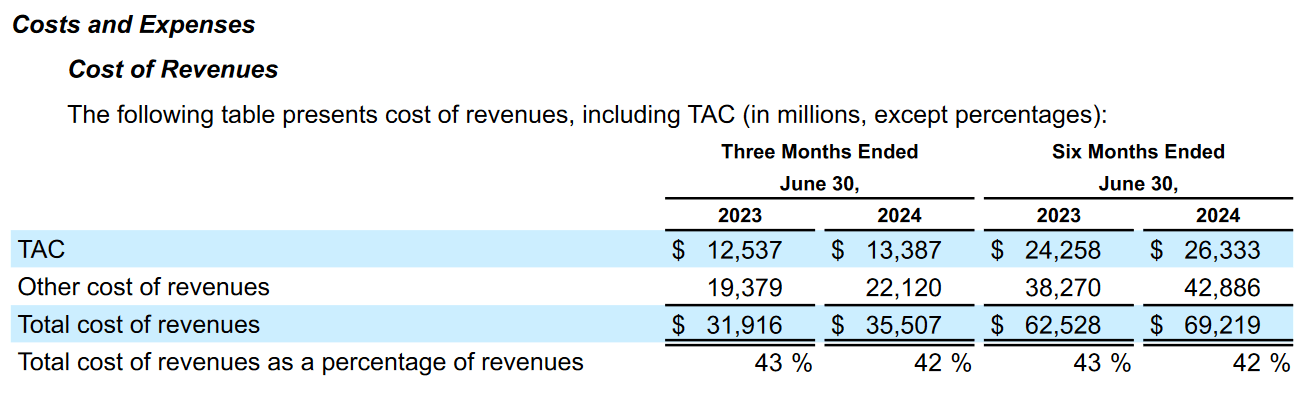
Alphabet: Q2 2024 Earnings Figures (Alphabet: Q2 2024 Earnings Presentation)
For the second quarter period, Alphabet generated per-share earnings of $1.89 (surpassing consensus estimates of $1.84 per share) and revenues of $84.74 billion (surpassing consensus estimates of $84.19 billion). But while these figures were both positives for the stock, we did see evidence of weakness in the company’s YouTube segment, which generated revenues from advertising ($8.66 billion) that failed to match consensus estimates ($8.93 billion). Other positive areas were seen with the company’s costs for traffic acquisition ($13.39 billion), which came in below expectations ($13.54 billion) and in the Google Cloud segment (which generated revenues of $10.35 billion). Net income figures came in at $23.6 billion (which marks an annualized gain of 28.26%) and Alphabet generated quarterly operating profits that surpassed the $1 mark for the first time in the company’s history.
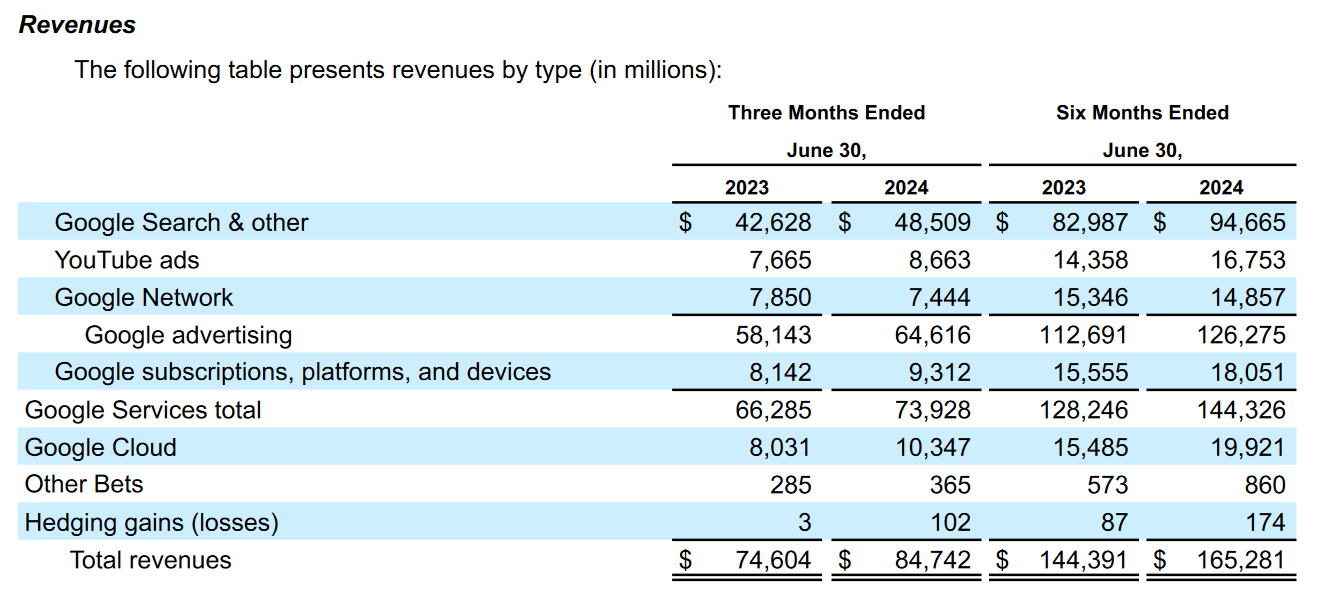
Alphabet: Q2 2024 Earnings Figures (Alphabet: Q2 2024 Earnings Presentation)
Overall, the company’s revenue performance exhibited annualized gains of 14% with bright points found in the cloud and search segments. Interestingly, Alphabet’s cloud segment had never generated more than $10 billion during a single quarterly period, so this Q2 performance does mark a key milestone for this portion of the business. Total advertising revenues came in at $64.62 billion, which indicates slightly weaker annualized revenue growth of 11.15% (when compared to the revenue growth rates seen during the prior quarter) but these figures are still strong because they suggest improvements when compared to many of the quarterly performances seen during the previous two years.
Alphabet: Q2 2024 Earnings Figures (Alphabet: Q2 2024 Earnings Presentation)
Of course, the YouTube segment was a bit of a glaring negative (relative to consensus expectations) but revenues from this part of the business ($8.66 billion) were still relatively strong because they did indicate annualized growth of nearly 13.1% for the period. Given the fact that YouTube’s rivalry with TikTok continues to heat up, this is definitely one portion of the upcoming earnings report that will have my attention.
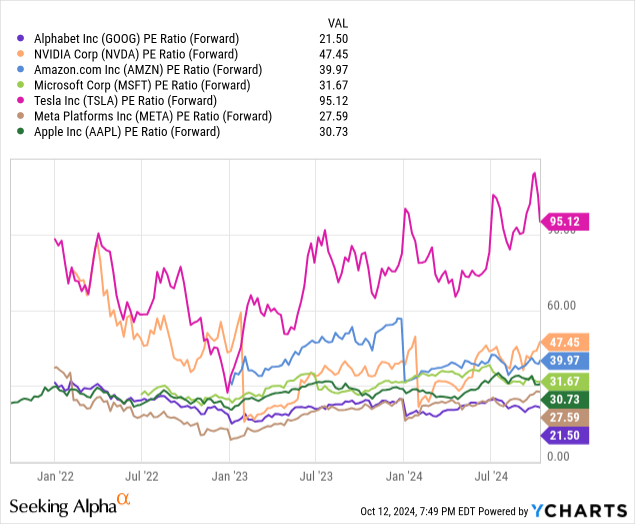
Alphabet: Comparative Price to Earnings Valuations (YCharts)
When assessing the possible ways GOOG share prices might react following Alphabet’s next earnings report, we must first compare the company’s key valuation metrics to counterparts within the MAG-7 cohort. Currently, Alphabet’s forward price-earnings ratio of 21.5x is looking quite attractive when compared to this part of the market. For example, NVIDIA Corp. (NVDA) is currently showing an extremely high forward price-earnings ratio of 47.45x, but even this number is much lower than the valuation currently seen with Tesla, Inc. (TSLA) which trades at 95.12x. Other companies, like Amazon (AMZN) and Microsoft Corp. (MSFT) trade are slightly lower valuations (at 39.97x and 31.67x, respectively). However, the only MAG-7 companies that are even within striking distance of Alphabet’s relatively low valuation would be Apple Inc. (AAPL) at 30.73x and Meta Platforms (META) at 27.59x.
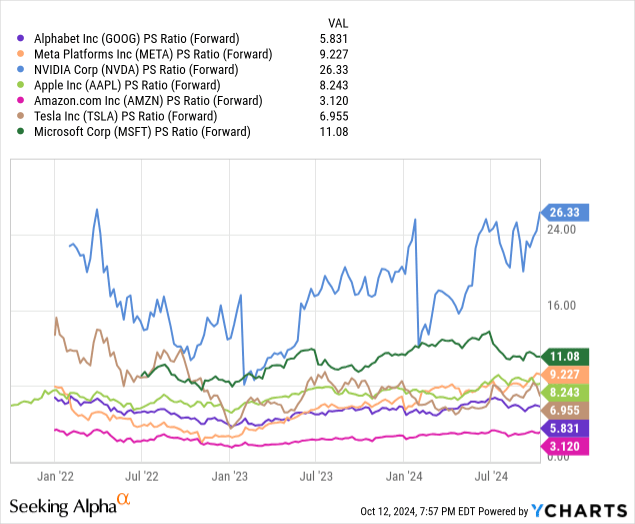
Alphabet: Comparative Price to Sales Valuations (YCharts)
If we compare these same companies on the basis of a forward price-sales valuation, the results are mostly similar. In this case, Alphabet’s forward price-sales valuation of 5.83x seems which inexpensive when compared to Nvidia (at 26.33x) and Microsoft (at 11.08x). Meta Platforms (at 9.23x) and Apple (at 8.24x) are trading at levels that are not quite as lofty. However, the only stocks that are trading at seemingly comparable valuations are Tesla (at 6.96x) and Amazon, which is actually a bit cheaper at just 3.12x. Overall, this does tell us that Alphabet is currently trading at levels that are quite inexpensive on a comparative basis, and I believe that this shows GOOG share prices still have room to extend higher before we can reasonably consider the stock to be expensive.
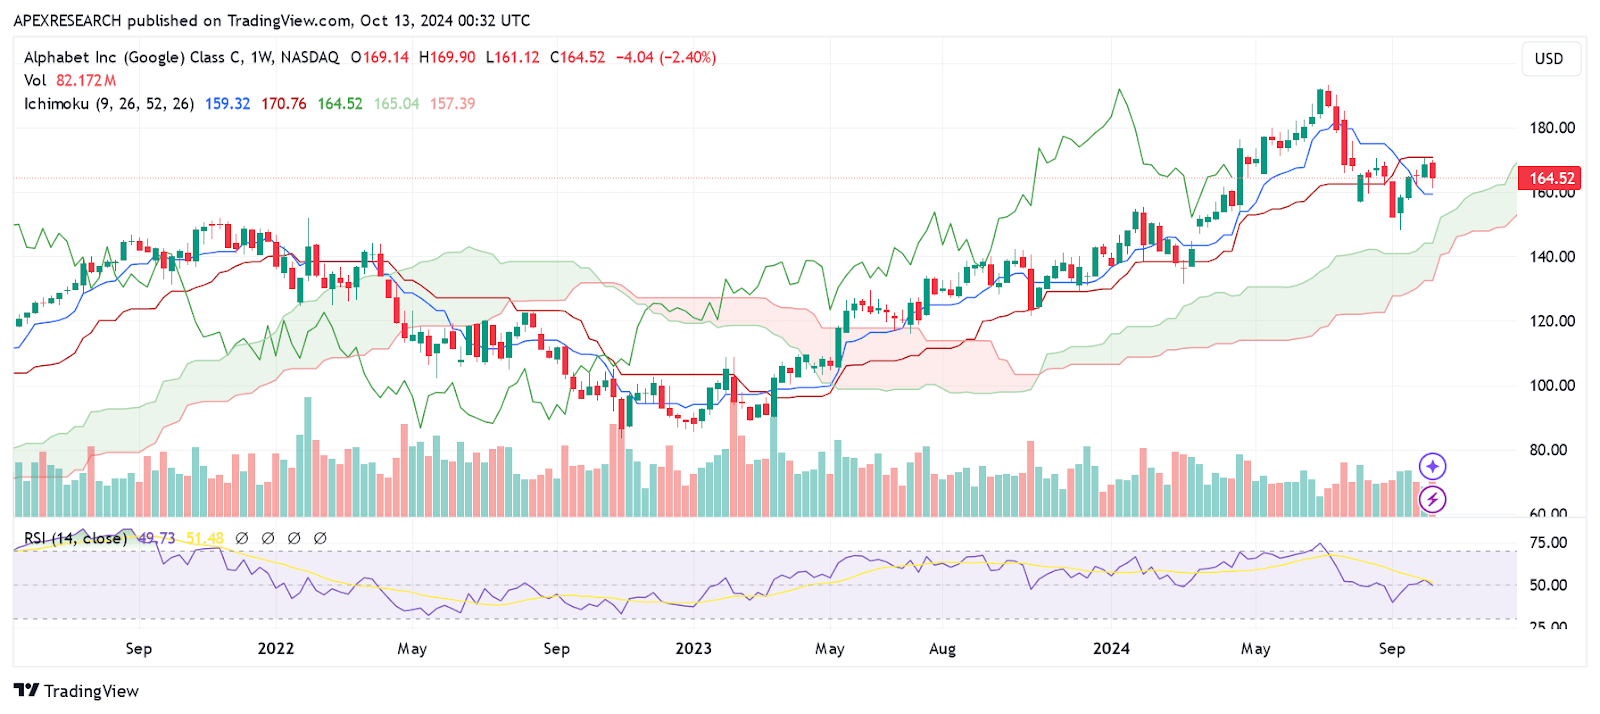
GOOG: Historical Support and Resistance Zones (Income Generator via Trading View)
If we view GOOG share prices themselves from a long-term perspective, we can see that the stock has recently encountered a fairly sizable pullback into near-term support zones that are found at $148.20 (marking the September 9th, 2024 lows). In my view, these recent declines have given potentially bullish investors a strong margin of safety, even if we do see a negative reaction in Alphabet’s next earnings release. Specifically, a downside break of support at $148.20 would then target the March 4th, 2024 lows of $131.55, but the potential for bullish upside still gives us a preferable risk-reward ratio even if the reverse scenario is seen. Resistance zones are not found until the mid-$190s, which suggests that upside potential is roughly two-times the size of downside trend zones.

GOOG: Trend Wave Retracement Levels (Income Generator via Trading View)
Since the stock has already seen a fairly substantial pullback over the last three months, we can use Fibonacci retracement analysis to help identify near-term resistance zones that might be encountered if share prices begin to move higher after earnings. In the chart above, we can see that a double-top resistance zone located near $170.30 coincides quite closely with the 50% retracement of the prior declines from $193.31 to $148.20 (which is located near $170.80). A break above this region would target the 61.8% Fibonacci retracement zone of the same prior price decline (which is located near $176.30) and this region coincides quite closely with the stock’s historical resistance highs from July 31st, 2024. Currently, indicator readings in the 4-hour relative strength index are trading near the midpoint of the histogram (50.80), so this suggests that share prices would be able to see a substantial move to the topside before reaching into overbought territory. If we do see a break above the 61.8% retracement, there is also a gap in share prices that extends to roughly $183.40 and this is another factor that could help to propel the stock higher while that price gap is filled.
Overall, I think that the stock could be setting up for some fairly substantial moves higher given the stock’s relatively low forward valuation metrics, improved earnings performances during the prior quarter, and the sizable trend declines we have seen over the last few months. In the upcoming release, I will be paying special attention to the figures shown in the YouTube segment because this is one area that has disappointed market expectations in the past, and we continue to see fiercely competitive trends from platforms like TikTok. Given the improved potential for upside gains following the share price declines below $150, I believe risk-reward clearly favors the bullish side of the equation and the potential for further share price losses is likely to be limited going forward.
Analyst’s Disclosure: I/we have a beneficial long position in the shares of GOOG either through stock ownership, options, or other derivatives. I wrote this article myself, and it expresses my own opinions. I am not receiving compensation for it (other than from Seeking Alpha). I have no business relationship with any company whose stock is mentioned in this article.
Seeking Alpha’s Disclosure: Past performance is no guarantee of future results. No recommendation or advice is being given as to whether any investment is suitable for a particular investor. Any views or opinions expressed above may not reflect those of Seeking Alpha as a whole. Seeking Alpha is not a licensed securities dealer, broker or US investment adviser or investment bank. Our analysts are third party authors that include both professional investors and individual investors who may not be licensed or certified by any institute or regulatory body.