Summary:
- Alphabet has a strong fundamental setup and is greatly positioned in an industry that is forecasted to grow substantially over the next decade, while its stock is seemingly significantly undervalued.
- GOOG has completed its downward impulse sequence and is forming its next upward leg which would likely project the stock over its most important resistances.
- In this technical article, I discuss important price levels and metrics that investors could consider to gain an overview of the stock’s likely price action.
- By considering multiple outcomes and setting up an adequate contingency plan, investors are less inclined to act driven by emotions, as this could come at a higher cost.
- Two scenarios are offering interesting opportunities while the relevant industry group seems to hint at further positive momentum, leading me to qualify GOOG as a relatively high-risk buy position also from a technical perspective.
welcomeinside/iStock via Getty Images
Investment thesis
After qualifying Alphabet (NASDAQ:GOOG) (NASDAQ:GOOGL) as a long-term investment opportunity based on my in-depth fundamental analysis, I want to discuss the stock from a technical perspective. The stock has lost 45% since the beginning of its decline and is priced under its most important moving averages, facing significant overhead resistance, while the stock is still not building relative strength, despite the relevant industry group giving more positive signs. In this article, I explain an actionable trading opportunity in the short-to-medium term. I discuss two positive and one negative scenarios based on a contingency plan with multiple outcomes, while I always examine the downside risk, by considering appropriate stop-loss levels and actively managing the risk exposure.
A quick look at the big picture
The US technology sector and the communication services sector are among the laggards in the past year. Despite companies in the communication services sector performing slightly better in the past month, technology companies are still struggling to recover from the recent sell-off. Companies offering information technology services, or active in the internet content and information industry, have performed flat in the past month, while companies in the advertising business saw a more positive momentum forming, after being severely hit in the past year.
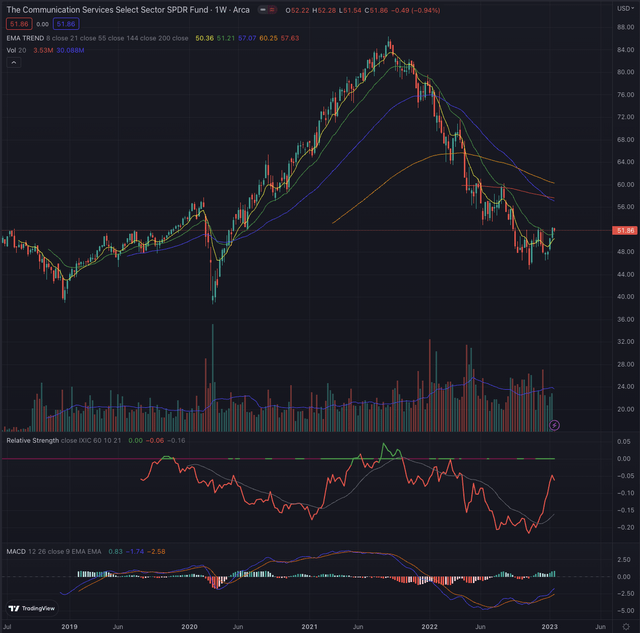
The Communication Services Select Sector SPDR Fund (XLC) bottomed at the end of October 2022 and is floating sideways with prevailing positive weeks on lower buy-side volume. In the past two months, the industry reference could significantly reduce its relative weakness, when compared to the broader technology market, the Nasdaq Composite (IXIC), or more narrowly the Nasdaq-100 tracked by the Invesco QQQ ETF (QQQ), and has recently overcome its EMA21, which has been its most significant trailing resistance since the beginning of its decline at the end of 2021. Increasingly positive momentum is forming and confirmed by the rising MACD, a sign that the industry may see a more favorable development in the foreseeable future.
Where are we now?
In my article Alphabet Vs. Meta Platforms: Which Stock Is The Better Investment?, published on November 19, 2022, I wrote an in-depth fundamental analysis of Alphabet as I compared the company to peer Meta Platforms (NASDAQ:META) and pointed out its significant undervaluation, while finally qualifying it as a buy position and a long-term investment opportunity. But how does the stock look from a technical perspective, and does the actual price level offer an opportunity also to more short-term traders?
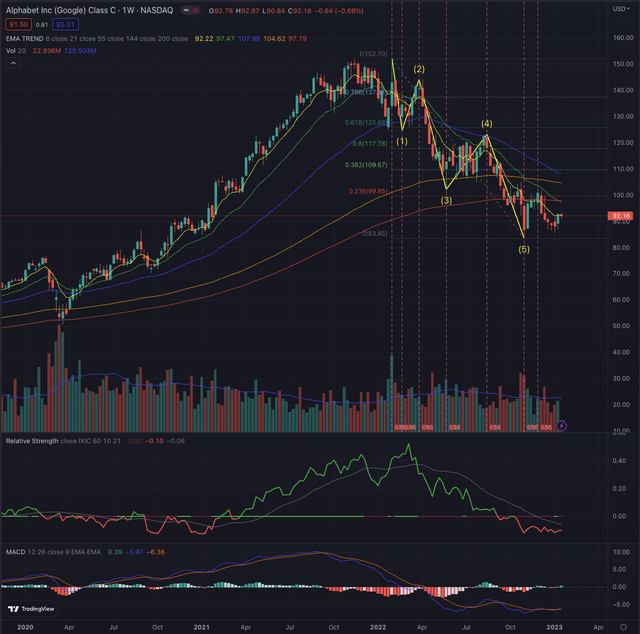
GOOG has lost 45% since the beginning of its decline at the end of 2021, retracing about 90% of the gains achieved from the pre-pandemic price levels, and bottoming on November 3, 2022. The stock has completed its downward Elliott impulse sequence, after a long-lasting decline which projected GOOG into its long-term downtrend at the end of October 2022, on increasing relative weakness with substantial selling pressure.
The stock has since formed a side movement on higher volatility, floating under its most important moving averages in stage four, a stage that is usually not advisable to be invested in, with sporadic exceptions in terms of early-stage contrarian strategies with a high-risk tolerance. But more important than its past performance and the actual situation, are the hypotheses of the stock’s most likely future developments.
What is coming next?
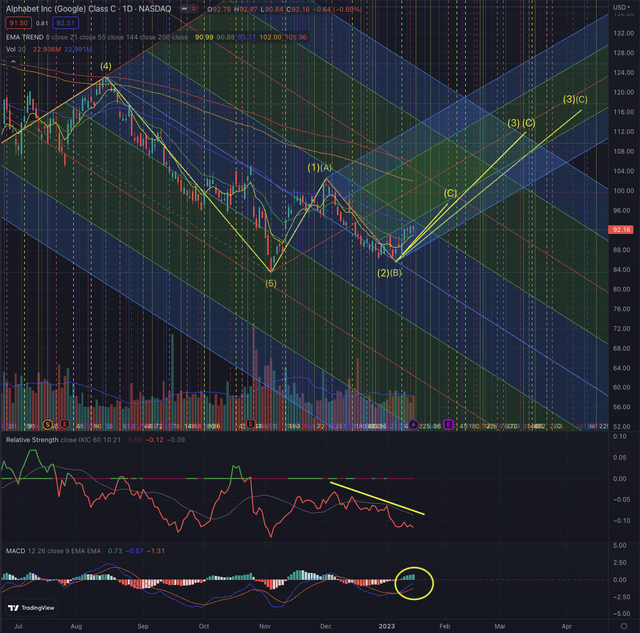
To discuss my analysis of the probable outcome in the coming weeks, I consider GOOG’s daily chart, where the relative strength compared to the broader technology market, the Nasdaq Composite (IXIC), is further declining, underscoring the investor’s hesitance in believing in the most recent advancement, which could instead be more significant as I will explain.
The stock is likely forming its corrective wave sequence, with waves A and B already formed, and the last leg formation is undergoing. The positive momentum marked by the MACD is hinting at higher price levels, while GOOG is facing its EMA55, where the stock would need high conviction on substantially increasing volume to overcome this trailing resistance.
When considering a successful breakout from its EMA55, I estimate the stock could extend most likely until $97.40, but if the positive momentum is underscored by a substantial increase in the stock’s relative strength, the last leg of its corrective sequence could lead GOOG until $112, or even $116.54. In an alternative scenario where the actual formation is a new upward impulse sequence, the stock would now be forming its third wave that would extend most likely to $112, $116.54, or even $135.68. In both cases, GOOG would face its strongest overhead resistance around $102.60 and face its EMA144 and respectively its EMA200, which the stock didn’t overcome consistently since dropping in a long-term downtrend.
Alternatively, to the two positive scenarios, GOOG could also fail in its reversal attempt and drop further, as the stock is still in stage four and the likelihood of an extended weakness cannot be ignored. It is therefore essential to set up suitable risk management, by defining a strict contingency plan with a reasonable stop-loss. I don’t want to be invested in GOOG if the stock continues in its decline and I would define my overall maximum risk tolerance as being 8-10% between the two bottoms at $83.50 and $85.50. As this stop-loss would lead to an unfavorable risk/reward ratio in one of the projected targets at $97.40, investors with high-risk tolerance could consider sizing their positions cautiously and progressively increasing their exposure if the stock overcomes this target, while adjusting also their stop-loss by rising it to break-even.
Investors may want to particularly observe how the stock will close its week and further the current month, as Alphabet is expected to report its Q4 and fiscal year results on February 2, and the stock is facing its EMA55 on its monthly chart, a resistance that will be determinant in the medium term.
The bottom line
Technical analysis is not an absolute instrument, but a way to increase investors’ success probabilities and a tool allowing them to be oriented in whatever security is listed on the markets. One would not drive towards an unknown destination without consulting a map or using a GPS. I believe the same should be true when making investment decisions. I consider techniques based on the Elliott Wave Theory, as well as likely outcomes based on Fibonacci’s principles, by confirming the likelihood of an outcome contingent on time-based probabilities. The purpose of my technical analysis is to confirm or reject an entry point in the stock, by observing its sector and industry, and most of all its price action. I then analyze the situation of that stock and calculate likely outcomes based on the mentioned theories.
No one can predict with certainty the future price action of securities. My analysis offers multiple scenarios and outcomes with the most likely targets based on my hypothesis, which could progressively be tracked and accepted or rejected. I consider Alphabet as being a highly interesting company, financially very strong, with enormous opportunities and great optionality; I also determined the company to be undervalued and ranked GOOG as a buy position based on my fundamental analysis. Despite the stock hovering in its unfavorable stage four and the downside risk still significant, it can be limited with risk management. My technical analysis shows two favorable scenarios which offer, at this stage, an interesting opportunity to momentum and position traders, while the relevant industry group seems to hint at further positive momentum, leading me to qualify GOOG as a relatively high-risk buy position in a short-to-medium term perspective.
Disclosure: I/we have no stock, option or similar derivative position in any of the companies mentioned, but may initiate a beneficial Long position through a purchase of the stock, or the purchase of call options or similar derivatives in GOOG over the next 72 hours. I wrote this article myself, and it expresses my own opinions. I am not receiving compensation for it (other than from Seeking Alpha). I have no business relationship with any company whose stock is mentioned in this article.
Additional disclosure: All of my articles are a matter of opinion and must be treated as such. All opinions and estimates reflect my best judgment on selected aspects of a potential investment in securities of the mentioned companies, as of the date of publication. Any opinions or estimates are subject to change without notice. I am not acting in an investment adviser capacity, and this article is not financial advice. I invite every investor to do their research and due diligence before making any investment decisions. I take no responsibility for your investment decisions but wish you great success.


