Summary:
- Google’s key segments are performing well in 2Q24, with impressive operating income and figures.
- YouTube is outperforming competitors in the streaming market, with YouTube and Netflix dominating US streaming hours.
- Google Cloud has shown rapid growth, with quarterly revenue exceeding $10 billion, and is expected to continue performing well alongside AWS and Microsoft Azure.
JHVEPhoto
Introduction
Per my May article, Alphabet/Google’s (NASDAQ:GOOG) (NASDAQ:GOOGL) key segments are doing well. The 2Q24 numbers have come out since that time, and we see continued improvement across the board.
My thesis is that Google continues performing well as the world embraces AI.
The Numbers
The 2Q24 operating income figures are better than ever and the 2Q24 revenue numbers are impressive as they almost matched the seasonal figures from 4Q23:
Google operating income and revenue (Author’s spreadsheet)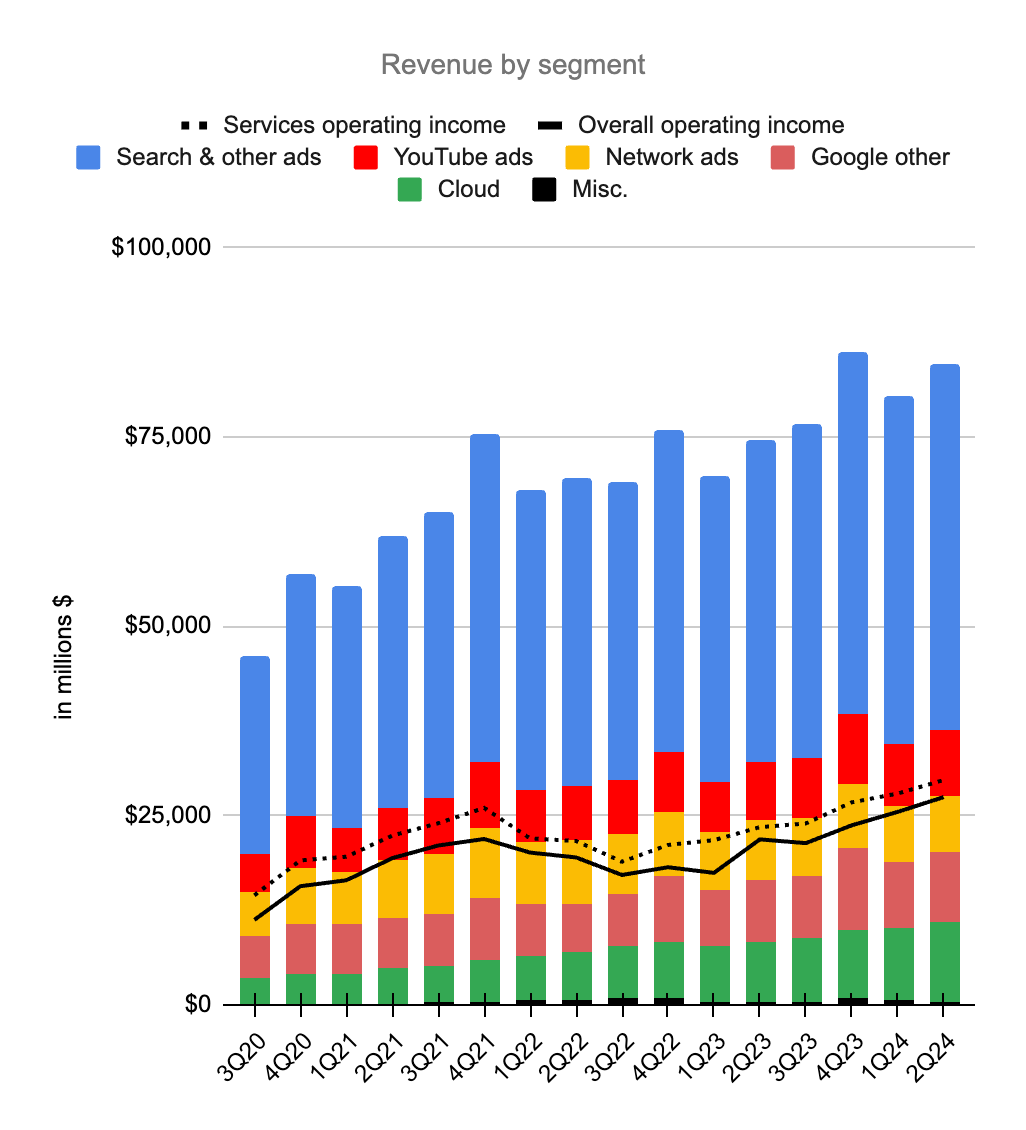
Search
Is 9.11 bigger than 9.9? This is a question which has been breaking the internet because LLMs like ChatGPT and Meta AI (META) often get the answer wrong. When we use Google’s search bar to ask this type of question with 3.11 and 3.9, their Gemini LLM gives us the correct answer before we see search engine result pages (“SERPs”) which also have the correct answer:
Search query (Google)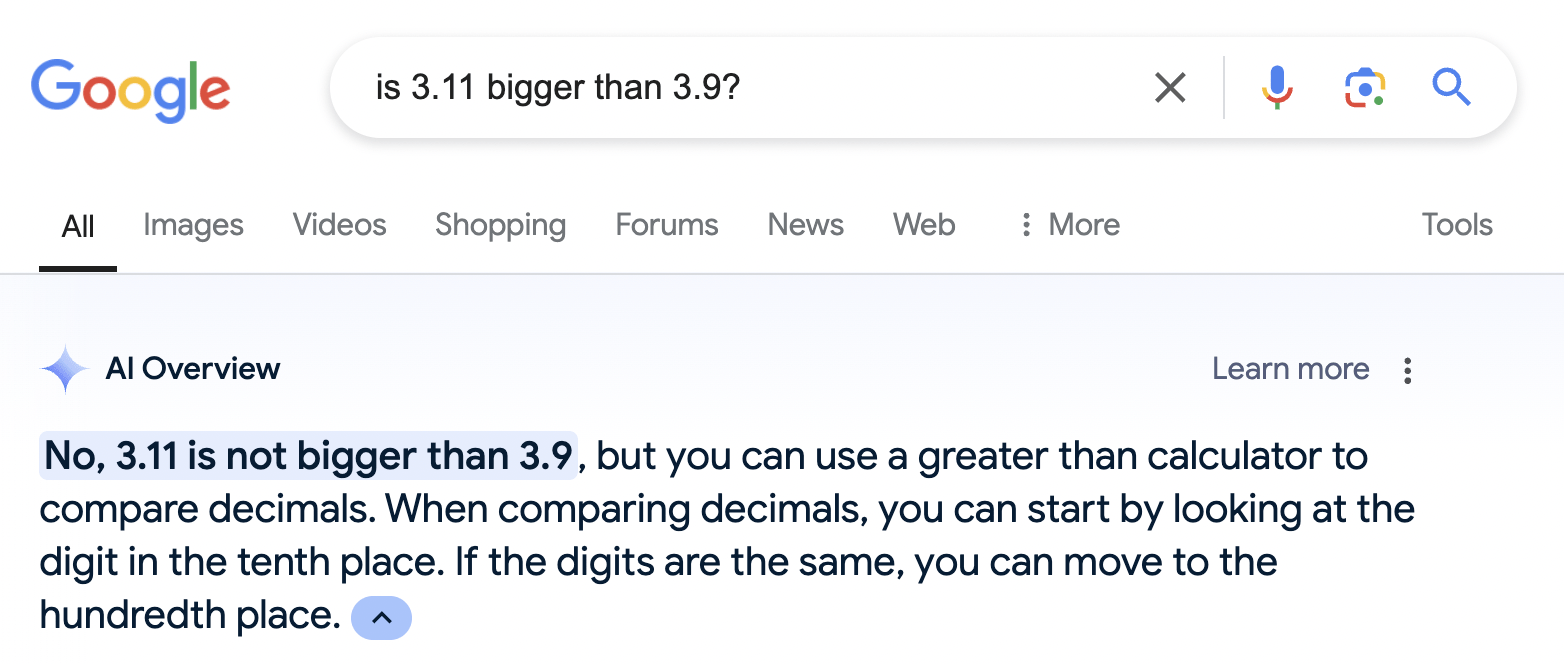
I am sanguine about Google continuing to make money from traditional SERPs while also including helpful AI snippets when people make searches on the internet.
YouTube
Business Insider shows YouTube is outperforming others like Netflix (NFLX) and Disney (DIS) with respect to the percentage share of TV viewing from kids aged 2 to 11:
YouTube viewers (Business Insider)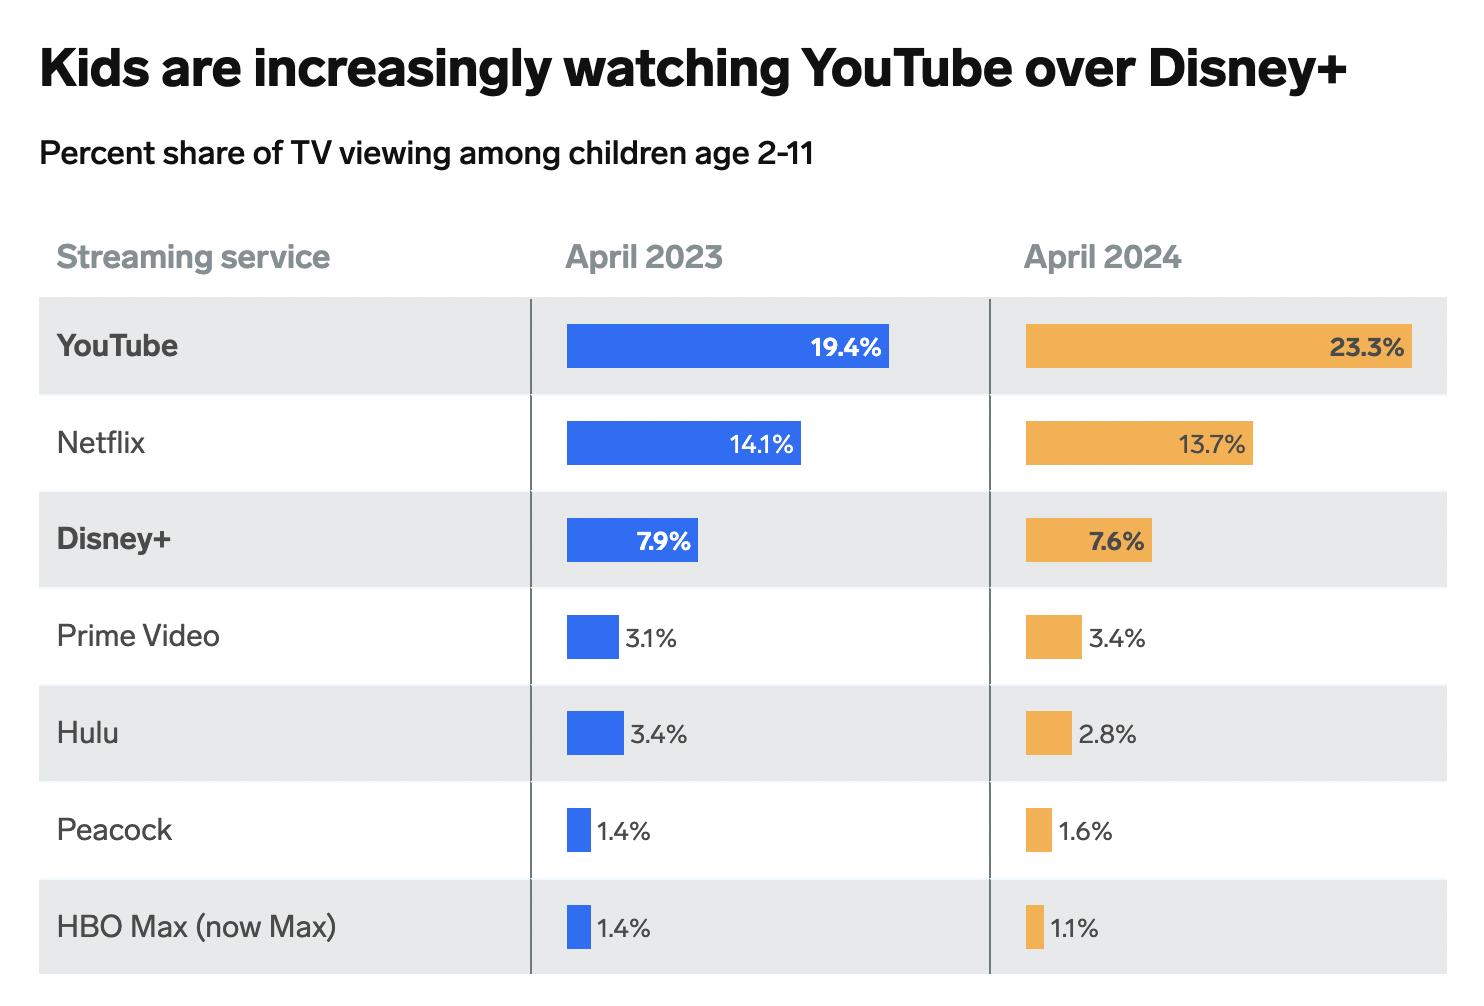
Per Nielsen’s The Gauge, YouTube and Netflix dominate the US streaming market. It is mind-boggling when we think about the fact that the combination of tech companies like YouTube, Netflix, and Amazon Prime is responsible for more streaming hours in the US than all the traditional Hollywood companies combined. I believe the tech companies will continue to lead as they find creative ways to use generative AI that resonate with younger viewers:
YouTube streaming (Nielsen’s The Gauge)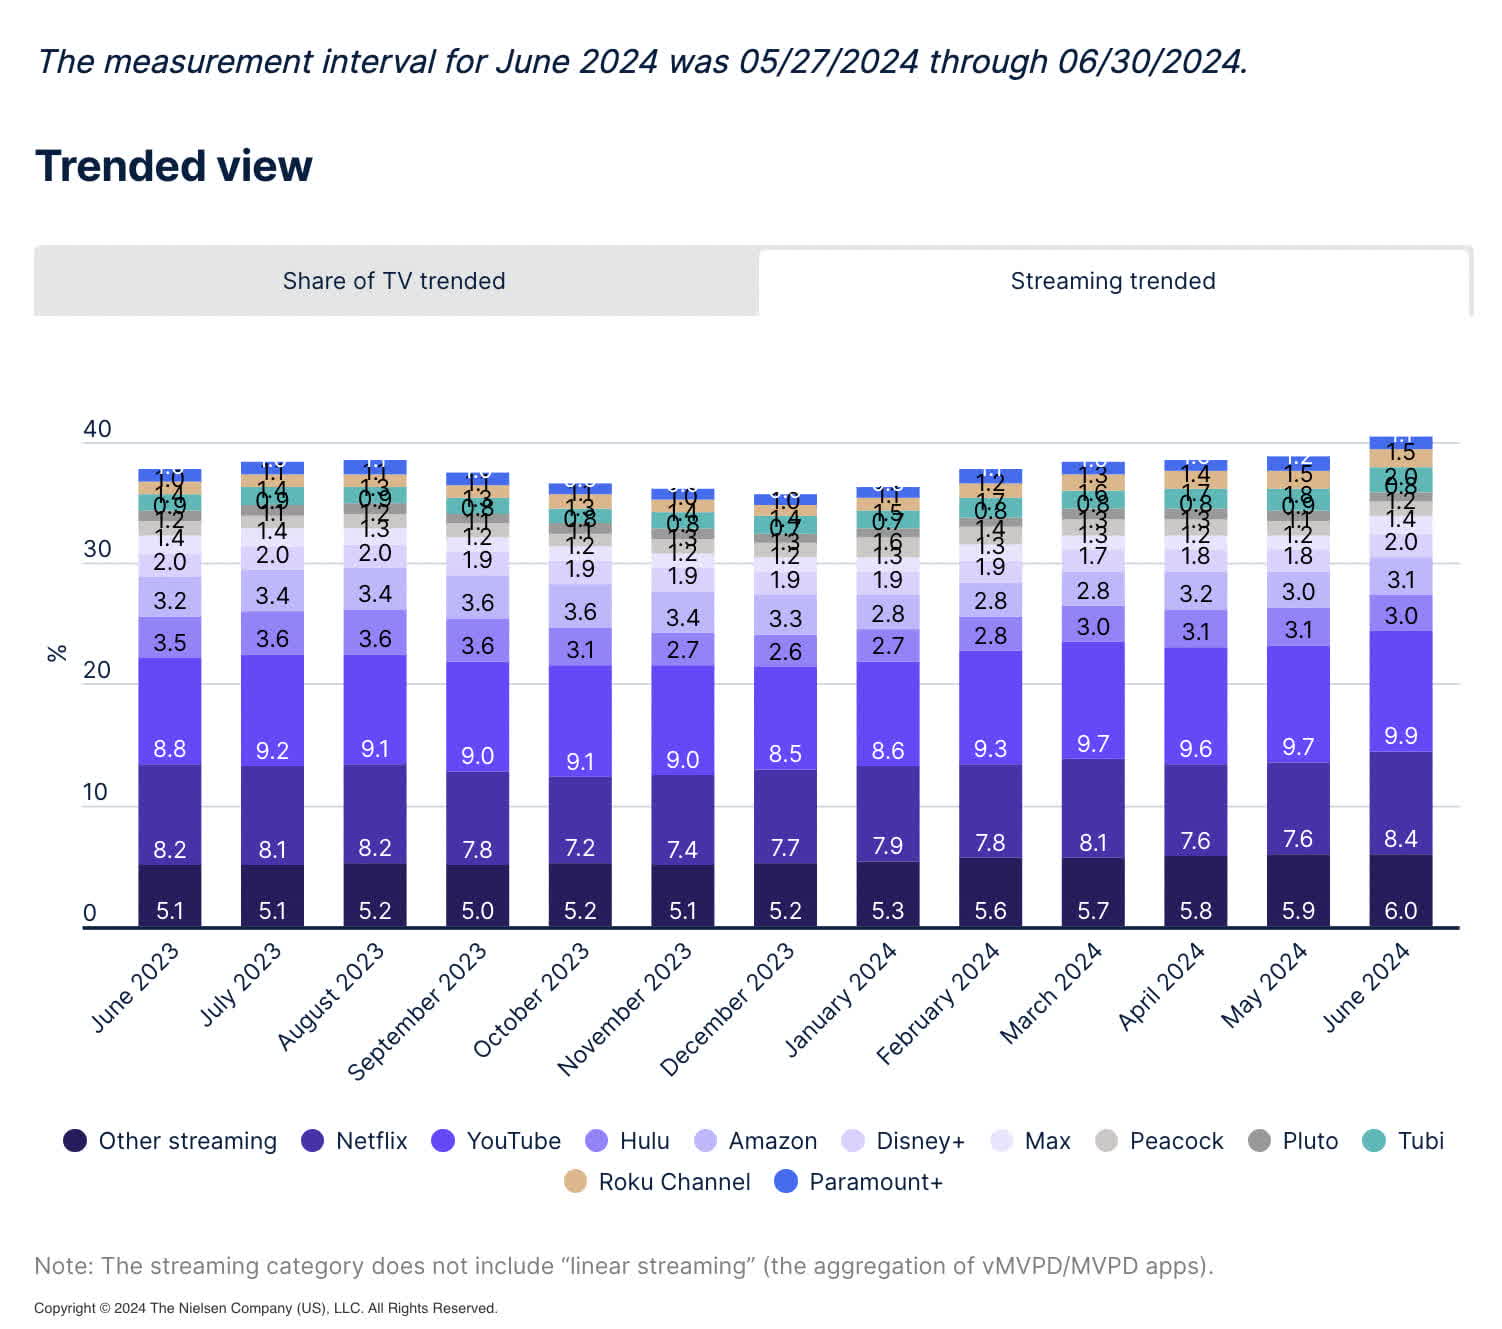
Google Cloud
Google Cloud has grown quickly such that their quarterly revenue is now over $10 billion ($ in millions):
|
Google Cloud |
||||
|
Qtr End |
Op. Income |
Revenue |
Op. Margin |
YoY Rev Growth |
|
Dec 2019 |
$(1,194) |
$2,614 |
||
|
Mar 2020 |
$(1,730) |
$2,777 |
||
|
Jun 2020 |
$(1,426) |
$3,007 |
||
|
Sep 2020 |
$(1,208) |
$3,444 |
||
|
Dec 2020 |
$(1,243) |
$3,831 |
47% |
|
|
Mar 2021 |
$(974) |
$4,047 |
46% |
|
|
Jun 2021 |
$(591) |
$4,628 |
54% |
|
|
Sep 2021 |
$(644) |
$4,990 |
45% |
|
|
Dec 2021 |
$(890) |
$5,541 |
45% |
|
|
Mar 2022 |
$(931) |
$5,821 |
44% |
|
|
Jun 2022 |
$(858) |
$6,276 |
36% |
|
|
Sep 2022 |
$(699) |
$6,868 |
38% |
|
|
Dec 2022 |
$(480) |
$7,315 |
32% |
|
|
Mar 2023 |
$191 |
$7,454 |
3% |
28% |
|
Jun 2023 |
$395 |
$8,031 |
5% |
28% |
|
Sep 2023 |
$266 |
$8,411 |
3% |
22% |
|
Dec 2023 |
$864 |
$9,192 |
9% |
26% |
|
Mar 2024 |
$900 |
$9,574 |
9% |
28% |
|
Jun 2024 |
$1,172 |
$10,347 |
11% |
29% |
The early days for AWS (AMZN) were easier than what we see today for Google Cloud because competition was lighter and massive AI investments were not required ($ in millions):
|
AWS |
||||
|
Qtr End |
Op. Income |
Revenue |
Op. Margin |
YoY Rev Growth |
|
Dec 2015 |
$580 |
$2,405 |
24% |
|
|
Mar 2016 |
$604 |
$2,566 |
24% |
|
|
Jun 2016 |
$718 |
$2,886 |
25% |
|
|
Sep 2016 |
$861 |
$3,231 |
27% |
|
|
Dec 2016 |
$926 |
$3,536 |
26% |
47% |
|
Mar 2017 |
$890 |
$3,661 |
24% |
43% |
|
Jun 2017 |
$916 |
$4,100 |
22% |
42% |
|
Sep 2017 |
$1,171 |
$4,584 |
26% |
42% |
|
Dec 2017 |
$1,354 |
$5,113 |
26% |
45% |
|
Mar 2018 |
$1,400 |
$5,442 |
26% |
49% |
|
Jun 2018 |
$1,642 |
$6,105 |
27% |
49% |
|
Sep 2018 |
$2,077 |
$6,679 |
31% |
46% |
|
Dec 2018 |
$2,177 |
$7,430 |
29% |
45% |
|
Mar 2019 |
$2,223 |
$7,696 |
29% |
41% |
|
Jun 2019 |
$2,121 |
$8,381 |
25% |
37% |
|
Sep 2019 |
$2,261 |
$8,995 |
25% |
35% |
|
Dec 2019 |
$2,596 |
$9,954 |
26% |
34% |
|
Mar 2020 |
$3,075 |
$10,219 |
30% |
33% |
|
Jun 2020 |
$3,357 |
$10,808 |
31% |
29% |
I believe Google Cloud, AWS, and Microsoft Azure will continue to do well as these 3 hyperscalers are the only companies with the resources to make heavy AI investments in the years ahead. Platformonomics shows that even iconic database companies like Oracle (ORCL) can’t keep up with the big 3 hyperscalers:
Cloud capex (Platformonomics)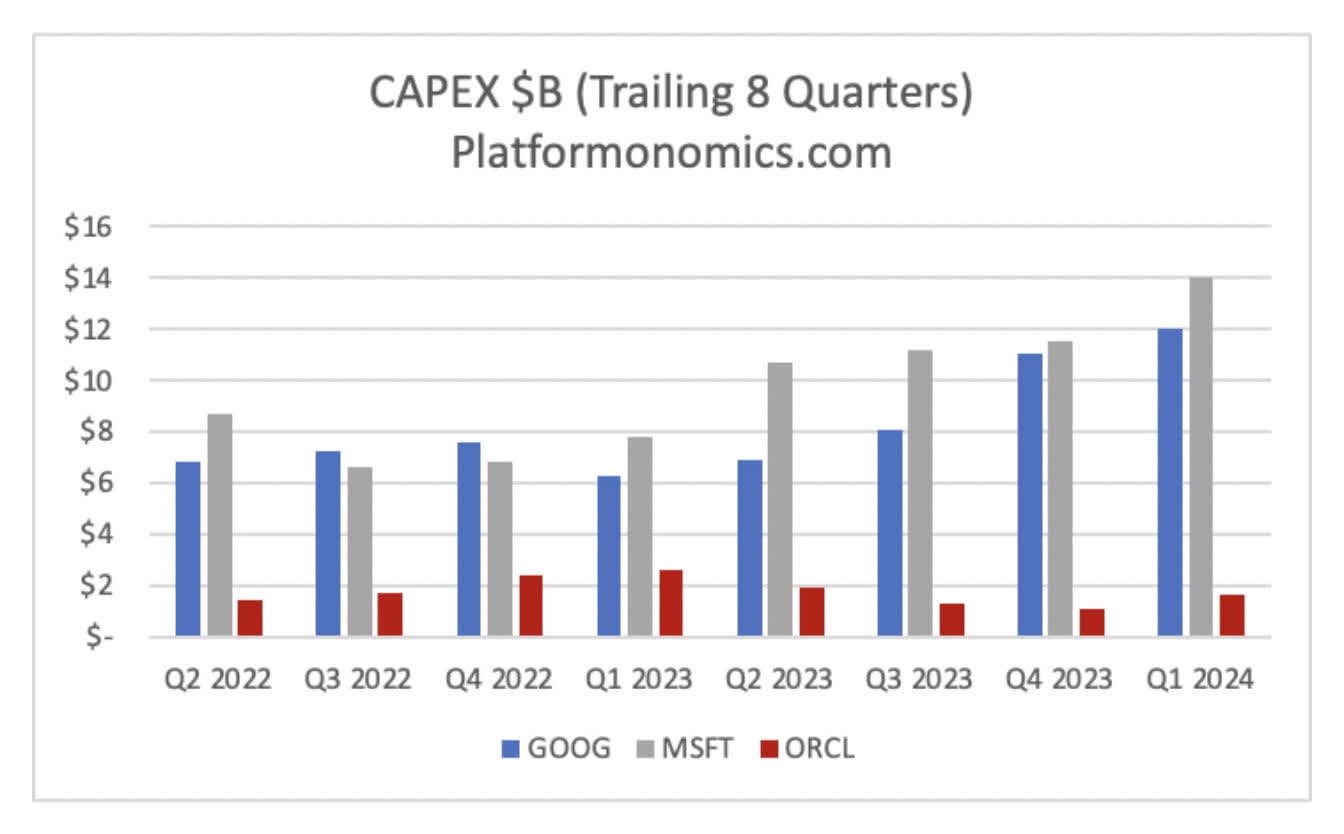
Waymo
During the 2Q24 Tesla call, Tesla (TSLA) CEO Elon Musk was asked about General Motors (GM) Cruise canceling their pedal-less vehicle, and he indirectly praised Waymo while responding:
Well, obviously the real reason that they canceled it is because GM can’t make it work, not because of the regulators, they’re blaming regulators. That’s misleading of them to do so, because Waymo is doing just fine in those markets. So it’s just that their technology is not far.
An October 2023 blog post explains Waymo’s history with AI:
For over a decade, Waymo has been addressing complex AI and ML challenges in autonomous driving, robotics and computer vision.
In October 2020, Waymo opened their service to the public in Phoenix. A March 2024 blog post gave specifics on how select members of the public can now use the service in parts of Los Angeles:
Waymo LA map (Waymo Blog)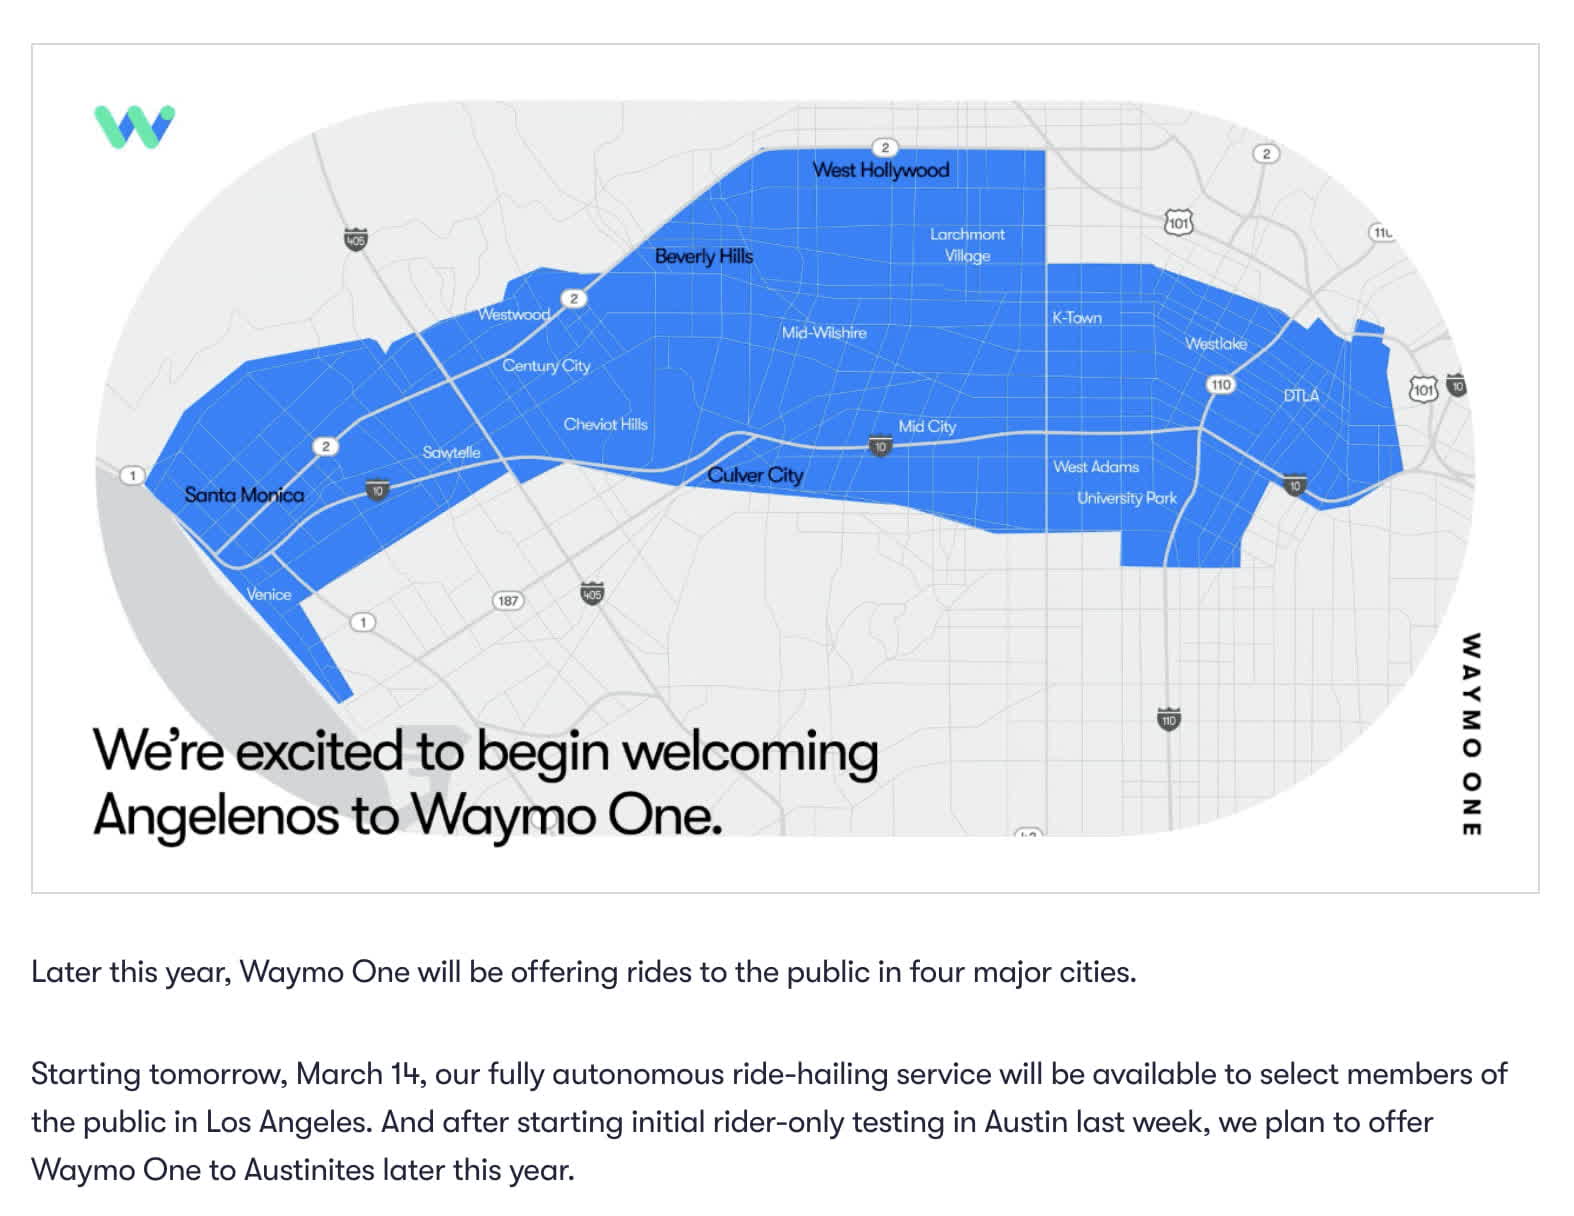
The above blog post also says rides will be offered to the public in Austin by the end of 2024. Waymo opened themselves up to the public in San Francisco in June 2024.
Summing things up, Waymo has been using AI for a decade and they are already available to the public in Phoenix and San Francisco. They will also be available to the public in parts of Los Angeles and Austin by the end of 2024. This was discussed in the 2Q24 call:
Waymo’s served more than 2 million trips to-date and driven more than 20 million fully autonomous miles on public roads. Waymo’s now delivering well over 50,000 weekly paid public rides, primarily in San Francisco and Phoenix. And in June, we removed the waitlist in San Francisco, so anyone can take a ride. Fully autonomous testing is underway in other Bay Area locations without a human in the driver’s seat.
A January post by former Tesla AI Director Andrej Karpathy talks about the potential for Waymo and Tesla. He implies it is now a question of when and a question of who with respect to robotaxis as opposed to a question of if. He highlights the different strategies used by Waymo and Tesla:
At some point, these [AI] systems cross the threshold of reliability and become what looks like Waymo today. They creep into the realm of full autonomy. In San Francisco today, you can open up an app and call a Waymo instead of an Uber. A driverless car will pull up and take you, a paying customer, to your destination. This is amazing. You need not know how to drive, you need not pay attention, you can lean back and take a nap, while the system transports you from A to B. Like many others I’ve talked to, I personally prefer to take a Waymo over Uber and I’ve switched to it almost exclusively for within-city transportation. You get a lot more low-variance, reproducible experience, the driving is smooth, you can play music, and you can chat with friends without spending mental resources thinking about what the driver is thinking [while] listening to you.
Additional investments in Waymo were discussed in the 2Q24 call. I’m optimistic that these investments will work out well as Waymo races against Tesla to get the robotaxi business to scale:
With regard to other bets, we continue to focus on improving overall efficiencies, as we invest for long-term returns. Waymo is an important example of this, with its technical leadership coupled with progress on operational performance. As you will see in the 10-Q, we have chosen to commit to a new multi-year investment of $5 billion. This new round of funding, which is consistent with recent annual investment levels will enable Waymo to continue to build the world’s leading autonomous driving technology company.
Valuation
The CFO and CEO can have a big impact on valuation, and the 2Q24 call was the last one for Ruth Porat in the CFO position. Forward-looking investors need to keep tabs on her replacement, Anat Ashkenazi.
Adjusted FCF looked pretty good relative to operating income up through 3Q23, but it has been very low since then:
Google financials (Author’s spreadsheets)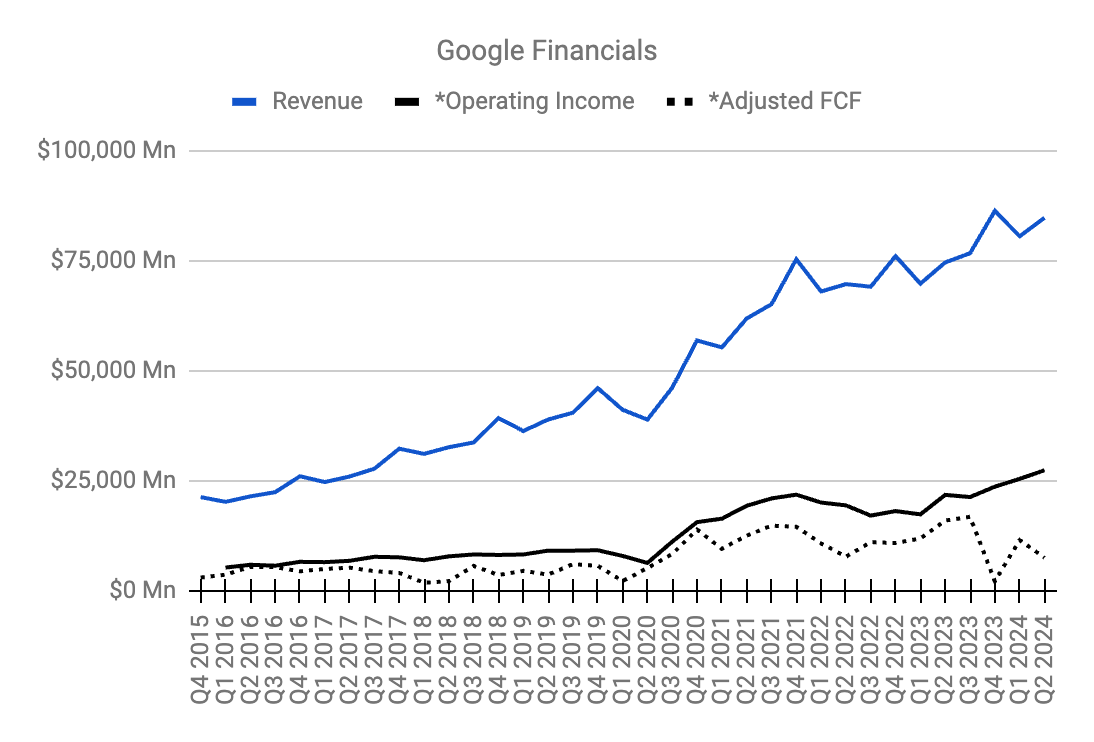
*I treat share-based compensation (“SBC”) like a cash expense above, so I subtract it and capex from operating cash flow when coming up with the adjusted FCF figures. Also, the adjusted operating income above is higher than the GAAP numbers in 2Q17, 2Q18, and 1Q19 because fines of $2,736 billion, $5,071 billion, and $1,697 billion, respectively, are excluded.
Again, the adjusted FCF above was low starting in 4Q23 due to heavy capex and this was discussed in the 2Q24 call when Barclays (BCS) Analyst Ross Sandler asked about the AI capex cycle:
So it looks like from the outside at least, the hyperscaler industry is going from kind of an under-bill situation this time last year to better meeting the demand with capacity right now to potentially being overbuilt next year if these CapEx growth rates keep up. So do you think that’s a fair characterization? And how are we thinking about the return on invested capital with this AI CapEx cycle.
CEO Sundar Pichai responded by saying we are at an early stage of a transformative area in tech. With respect to transitions, he likes the idea of aggressively investing upfront in a defining category (emphasis added):
I think the one way I think about it is when we go through a curve like this, the risk of under-investing is dramatically greater than the risk of over-investing for us here, even in scenarios where if it turns out that we are over investing. We clearly – these are infrastructure, which are widely useful for us. They have long useful lives and we can apply it across, and we can work through that. But I think not investing to be at the frontier, I think definitely has much more significant downside. Having said that, we obsess around every dollar we put in. Our teams are – work super hard, I’m proud of the efficiency work, be it optimization of hardware, software, model deployment across our fleet. All of that is something we spend a lot of time on, and that’s how we think about it.
Forward-looking investors need to keep tabs on the difference between accrual profits and adjusted FCF, especially as the new CFO makes investment decisions and communicates the thought process in quarterly calls.
Citing a July Needham note, Bloomberg says YouTube could be worth at least $455 billion, and it is one of many parts in the Google Services segment whose largest contributor is the search business. Trailing twelve months (“TTM”) operating income for the Google Services segment is $109,502 million or $52,897 million + $95,858 million – $39,253 million. This comes from TTM revenue of $293,433 million or $165,281 million + $272,543 million – $144,391 million. I believe this segment is worth 18 to 20x operating income for a range of $1,970 to $2,190 billion when rounding to the nearest $5 billion.
Google Cloud might not ever have the same operating margin as AWS, but I think they can improve from today’s level of 11% to at least 15% as the business scales. Based on the $10,347 million in revenue for 2Q24, the revenue run rate is $41.4 billion. The operating margin may not be 15% for a few more years, but I’m optimistic it will get there eventually and if we use that percentage now, then it implies a hypothetical operating income level of $6.2 billion based on the revenue run rate. Applying a multiple of 18 to 20x gives us a valuation range of $110 to $125 billion when rounding to the nearest $5 billion.
My sum of the parts valuation is as follows:
$1,970 to 2,190 billion Google Services
$110 to 125 billion Google Cloud
$25 to $50 billion Other Bets
————————
$2,105 to $2,365 billion total
Looking at the 2Q24 10-Q, we are given share counts as of July 16th. We add the 5,859 million A shares and the 866 million B shares and multiply this sub-total of 6,725 million shares times the July 25 GOOGL share price of $167.28 to get the first component of the market cap, which is $1,125 billion. We add this to the second market cap component which is $945 billion based on the 5,585 million C shares times the July 25 GOOG share price of $169.16. This gives us a market cap of $2,070 billion. The stock is near the low end of my valuation range, and I think it is a buy for long-term investors who are planning to hold it for at least 3 years.
Disclaimer: Any material in this article should not be relied on as a formal investment recommendation. Never buy a stock without doing your own thorough research.
Analyst’s Disclosure: I/we have a beneficial long position in the shares of GOOG, GOOGL, AMZN, META, MSFT, NFLX, TSLA, VOO either through stock ownership, options, or other derivatives. I wrote this article myself, and it expresses my own opinions. I am not receiving compensation for it (other than from Seeking Alpha). I have no business relationship with any company whose stock is mentioned in this article.
Seeking Alpha’s Disclosure: Past performance is no guarantee of future results. No recommendation or advice is being given as to whether any investment is suitable for a particular investor. Any views or opinions expressed above may not reflect those of Seeking Alpha as a whole. Seeking Alpha is not a licensed securities dealer, broker or US investment adviser or investment bank. Our analysts are third party authors that include both professional investors and individual investors who may not be licensed or certified by any institute or regulatory body.