Summary:
- Alphabet has returned over 61% to investors since November 2022, but investors should protect their profits as the stock approaches important price levels.
- The U.S. communication services and technology sectors have shown leadership in the stock market rally, but have lost some steam recently.
- GOOG has exceeded expectations with a stellar increase of over 50% but is losing momentum.
- Investors should set up their contingency plan and consider multiple outcomes.
- In this technical article, I discuss important price levels and metrics that investors could consider to gain an overview of the stock’s likely price action.

PM Images
Alphabet (NASDAQ:GOOG) (NASDAQ:GOOGL) has returned over 61% to investors since November 2022, a spectacular rally I admittedly underestimated in terms of pace and extent. But more important than the past performance, is the actual price action and the likelihood of scenarios I discuss in this article, as the stock is heading towards important price levels, and investors should protect their profits while possibly still taking part in case the rally extends.
A quick look at the big picture
The U.S. communication services sector and the technology sector have shown significant leadership during the past month’s rally in the U.S. stock market while having lost some steam in the last few market sessions, and giving back some of the achieved profits. On a yearly time frame technology companies are still among the biggest outperformers, although having recorded the biggest losses during the most recent pullback in the past three weeks. Information technology services providers are instead still among the worst performers yearly despite some relative strength in the past months, while companies active in the internet content and information industry, are by far leading the group, reporting significant relative strength on both observed timeframes.
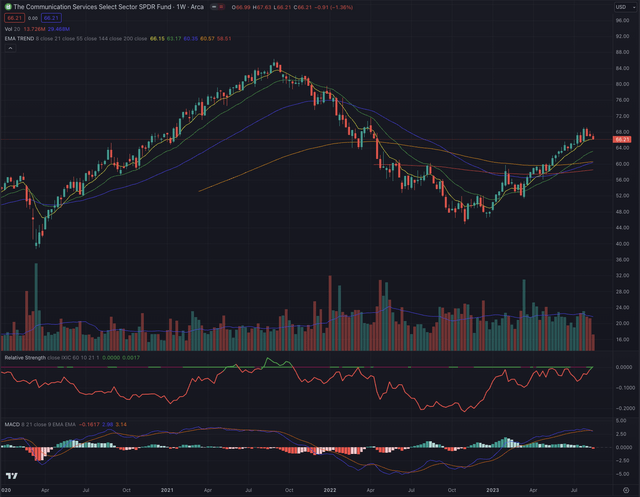
The Communication Services Select Sector SPDR Fund (XLC) after a rejection at its EMA200 in February 2023, has substantially retraced its losses, returning about 55% since its bottom in October 2022. Despite this significant performance, the industry benchmark has failed to build relative strength, when compared to the broader technology market, the Nasdaq Composite (IXIC), or more narrowly the Nasdaq-100 tracked by the Invesco QQQ ETF (QQQ). The positive momentum has likely peaked in the short term, as the index seems quite extended, its MACD is giving some signs of exhaustion, and more distribution days could be observed, but for now, XLC is still tracing along its EMA8.
Where are we now?
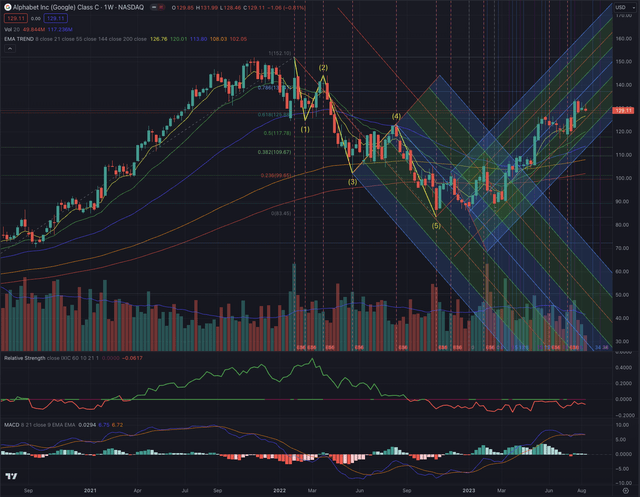
In my article “Google: Don’t Fight The Trend”, published on March 13, 2023, I suggested a positive scenario where I considered GOOG forming a reversal and trailing its ascending channel.
Investors might want to consider the up-trending channel as their reference and observe the price action close to the discussed trend line. GOOG could find support and form a reversal around this price level and follow the up-trending channel while breaking out from its short-term resistances toward its EMA200.
Although the stock’s price action effectively formed this scenario, the extent of the rally has exceeded my expectations, as GOOG has since reported a stellar increase of over 50% performance, projecting the stock above the 61.8% retracement until $134.07 on July 28.
Despite the stock having abandoned stage four quickly, it failed to build relative strength compared to the broader technology market, and seems quite extended, while retracing toward its short-term EMA on its weekly chart. In the actual stretched technology market, It’s a delicate situation where investors might want to protect their gains in case of a considerable retracement or set reasonable targets if the uptrend continues.
What is coming next?
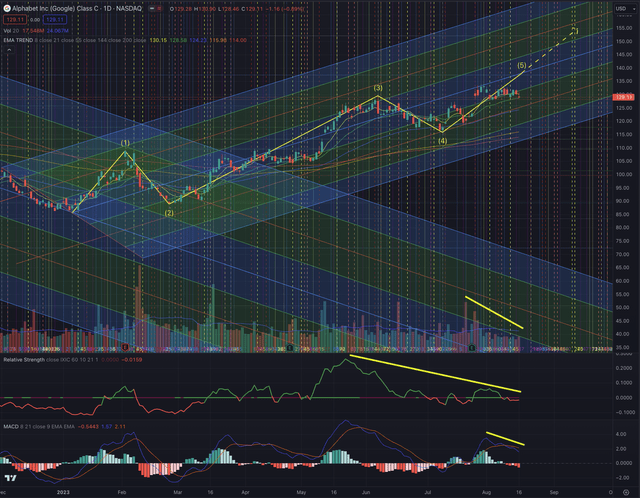
To discuss my contingency plan and my assumptions of likely outcomes for the price action in the coming weeks, I consider GOOG’s daily chart, where important elements can be observed. The stock is clearly losing momentum when compared to the Nasdaq Composite (IXIC), while simultaneously showing weakness on both the volume and MACD indicators. The latter just crossed its signal line, which is usually a major bearish sign. GOOG broke also under its EMA8, which is an early alarming sign while searching for support at its EMA21.
I consider two major outcomes in my contingency plan starting from the actual situation. If GOOG can find support and continue in its uptrend, it might close the upward impulse sequence I defined since January 2023, where the stock gave more significant signs of strength. Here, I would set my first target at $139 and the more optimistic second target at $155. The stock reported a relatively long wave 3, and I don’t see wave 5 extending significantly in the actual market situation, although it might still reach the mentioned targets.
If the stock instead cannot surge more and retraces in a likely market pullback, it’s reasonable to set an appropriate stop loss and protect the achieved gains. Here, I would strictly observe the central part of the ascending channel where the EMA55 is also trailing along. For investors with more risk tolerance, the stop loss could be set at the low range of the uptrend channel, close to the EMA200. Setting trailing stop losses slightly under important price levels can avoid being wiped off if the price is searching for support and major distribution days can lead to higher volatility. I would not want to be invested in GOOG if this hypothesis is confirmed and the price drops significantly under the lower-mentioned stop loss. Investors can always scale in again if the stock shows a better setup, but with the Nasdaq Composite and the relevant sector benchmark hinting at a peak, it would be a pity to be trapped in a major correction.
All the discussed elements lead me to maintain my rating on GOOG as a hold position. Adding positions now isn’t something I would do under the observed conditions, and I would also not rush and sell my positions unless the price action follows the discussed bearish scenario.
The bottom line
Technical analysis is not an absolute instrument, but a way to increase investors’ success probabilities and a tool allowing them to be oriented in whatever security is listed on the markets. One would not drive towards an unknown destination without consulting a map or using a GPS. I believe the same should be true when making investment decisions. I consider techniques based on the Elliott Wave Theory, as well as likely outcomes based on Fibonacci’s principles, by confirming the likelihood of an outcome contingent on time-based probabilities. The purpose of my technical analysis is to confirm or reject an entry point in the stock, by observing its sector and industry, and most of all its price action. I then analyze the situation of that stock and calculate likely outcomes based on the mentioned theories.
The information technology services industry and the internet content and information industry are giving mixed signs in a market that seems to be influenced by many factors. In the actual higher-rates, high-uncertainty situation, this isn’t surprising, as many actors need to adjust to intrinsic challenges and might struggle with exogenous pressures. I am very cautious when looking at the most recent rally in the US stock market, which seems to show its first important signs of fragility. Despite Alphabet is a brilliant company with strong fundamentals, substantial moat, and optionality, the actual technical aspects are less enthusiastic, and investors might want to implement strict risk management or wait for a better setup to scale in. The observed elements lead me to maintain GOOG as a hold position.
Analyst’s Disclosure: I/we have no stock, option or similar derivative position in any of the companies mentioned, and no plans to initiate any such positions within the next 72 hours. I wrote this article myself, and it expresses my own opinions. I am not receiving compensation for it (other than from Seeking Alpha). I have no business relationship with any company whose stock is mentioned in this article.
All of my articles are a matter of opinion and must be treated as such. All opinions and estimates reflect my best judgment on selected aspects of a potential investment in securities of the mentioned company or underlying, as of the date of publication. Any opinions or estimates are subject to change without notice, and I am under no circumstance obliged to update or correct any information presented in my analyses. I am not acting in an investment adviser capacity, and this article is not financial advice. This article contains independent commentary to be used for informational and educational purposes only. I invite every investor to do their research and due diligence before making an independent investment decision based on their particular investment objectives, financial situation, and risk tolerance. I take no responsibility for your investment decisions but wish you great success.
Seeking Alpha’s Disclosure: Past performance is no guarantee of future results. No recommendation or advice is being given as to whether any investment is suitable for a particular investor. Any views or opinions expressed above may not reflect those of Seeking Alpha as a whole. Seeking Alpha is not a licensed securities dealer, broker or US investment adviser or investment bank. Our analysts are third party authors that include both professional investors and individual investors who may not be licensed or certified by any institute or regulatory body.


