Summary:
- YouTube has gained market share in streaming in Q1 24, setting it up for good results in the upcoming earnings report.
- Margin expansion in the Cloud segment could make Google Cloud a more meaningful operating profit contributor in the next few years.
- The trend in the number of paid clicks and costs-per-click for Google Search will be one of the most important things to look out for.
- Gemini AI opens up several opportunities to expand GOOGL’s business, despite the initial problems.
- The single major risk is the possibility of disruption in the search business.
400tmax
Introduction
After writing on Seeking Alpha for nearly two years, this will only be my second article (I covered Amazon (AMZN) before) on one of the big tech companies. This will be my initial article on Alphabet (NASDAQ:GOOG)(NASDAQ:GOOGL). In this first article, I want to cover as much ground as I can so that I can keep covering the in my opinion, most relevant key metrics in future update articles (probably once or twice per year).
I will start this article with an overview of Alphabet’s financial reporting before discussing the different reported segments. After that, I will discuss the financials for the past decade, the current valuation, risks, and end, as I always do, with a conclusion.
Reporting Overview
Accounting and reporting is usually one of the less exciting topics to talk about, so let’s get it out of the way first. GOOGL changed its way of reporting significantly in 2017. In that year, the “YouTube ads” segment was first reported as a stand-alone segment. Until then, it was included in “Google Search & other”. In the same year, GOOGL first reported the “Google Cloud” segment separately. The Cloud segment was reported under “Google Subscriptions, platforms, and devices” until 2016.
As of today, GOOGL reports six segments:
- Google Seach & other: Includes all the search revenue (including revenues from generated traffic), Gmail, Google Maps and Google Play
- YouTube ads: YouTube ad revenue excluding YouTube Subscriptions
- Google Network: Ad revenue stemming from ads that are shown on partner websites (like the little ad banners on websites)
- Google Subscriptions, platforms, and devices: Consumer subscriptions (YouTube TV/Music/Premium, NFL Sunday Ticket, Google One), Google Play App sales and In-App purchases and the Pixel devices
- Google Cloud: Google Cloud Platform and Google Workspace (collaboration tools for enterprises, such as Calendar, Gmail, Docs, and Drive)
- Other Bets: A sort of Venture Capital arm, with the most commonly known venture being Waymo (self-driving cars)
GOOGL sums up the first three under the term “Google Advertising” which is very accurate. Since “Other Bets” is exactly that, a bet, we might also say that GOOGL’s main businesses are Advertising, Subscriptions, and Cloud.
Google Cloud
I want to start by talking a bit about Google Cloud, and I want to start with a simple chart showing the development of Google Cloud’s revenue since it was first reported in 2017:
Google Cloud Revenue since 2017 (Company reports)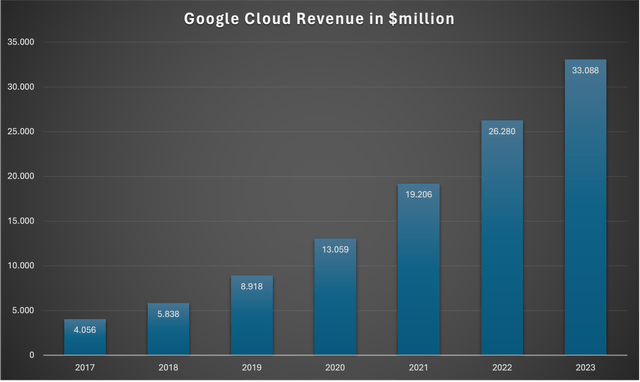
The Cloud segment increased revenues eightfold since 2017 (CAGR of 41.9%). Here are the YoY growth rates:
| 2018 | 2019 | 2020 | 2021 | 2022 | 2023 | |
| Cloud YoY Revenue growth % | 43.9 | 52.8 | 46.4 | 47.1 | 36.8 | 25.9 |
After growing close to 50% until 2021, revenue growth slowed down to 25.9% in 2023. In the most recent quarter Q4 23, revenue growth came in at 25.6% which is still impressive, especially considering that the market leader AWS only grew 13% in Q4 23 (I have to add though that Microsoft reported 28% constant currency revenue growth for its cloud services in Q4 23 while having a significant higher market share than GOOGL).
According to Statista, Google Cloud remains in distant third place regarding the market share of cloud infrastructure providers:
Q4 23 Cloud Market Share (Statista – Synergy Research Group)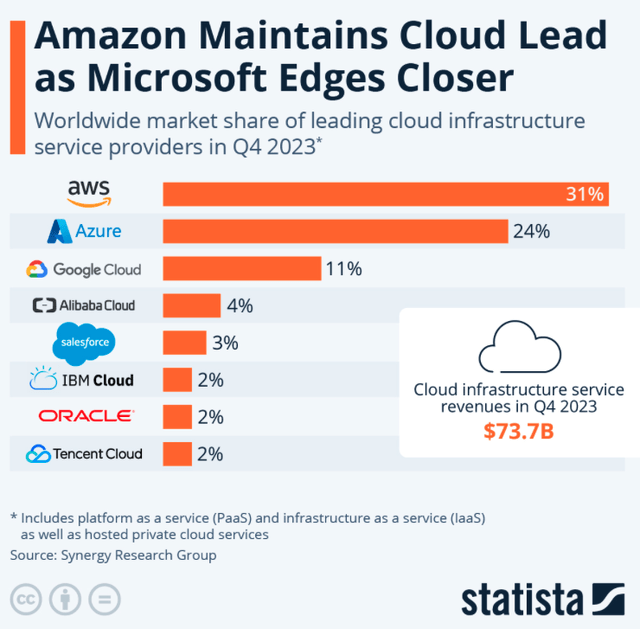
Since we know that Microsoft’s Azure and Google Cloud have been growing at double the rate of market leader AWS in Q4 23, we can conclude that at least for this specific quarter, AWS has lost market share to its closest two competitors.
However, I don’t think market share gains/losses are what we should focus on. After all, the Cloud Infrastructure market itself is supposed to grow anywhere from low to high double-digits for several years, according to several research institutes. Especially in the case of GOOGL, I think we should be looking at possible margin expansion over the next couple of years. Here is a chart showing Google Cloud’s operating margin since 2018:
Google Cloud Operating Margin since 2018 (Company reports)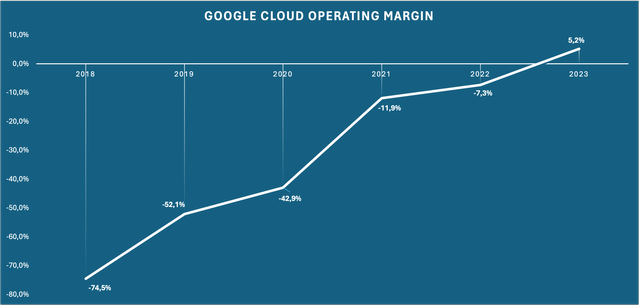
As we can see here, Google Cloud has seen incredible margin expansion over the past few years. For reference, AWS’s operating margin came in slightly below 30% between 2020 and 2023 while Microsoft’s operating margin for the “Intelligent Cloud” segment came in at close to 50% in the last two quarters according to slide 10 of the Q2 FY24 earnings presentation. Even when assuming a way lower operating margin compared to peers, let’s say 20%, Google Cloud’s operating profits would increase by 4x from margin expansion alone. To be fair, even in that scenario, Google Cloud’s profits would still dwarf in comparison to those of the other Google Services, as we will see later.
Don’t Underestimate YouTube
The YouTube franchise remains the most underrated part of GOOGL in my opinion. Let me again start with some words on reporting. As I mentioned earlier, GOOGL reports “YouTube ads” as a stand-alone segment, but only reports revenue. That looks like this:
YouTube ads reporting for Q4 23 (Alphabet Q4 23 Earnings Release)
Here we can see that YouTube ads revenue grew by 15.5% YoY to $9.2 billion for Q4 23. Accordingly, the market values YouTube’s performance by these reported growth rates, ignoring the fact that YouTube is growing its subscriber base as well, which is reported under “Google Subscriptions, platforms, and devices”. GOOGL doesn’t report YouTube subscriber numbers, which is a bit disappointing, but so be it.
YouTube Premium subscribers should be much more valuable than the traditional “Ad” users, which is probably the main reason behind GOOGL’s efforts to convert YouTube users to subscribers by promoting the subscription model and increasing the number of ads users get to see over time. As a regular YouTube user myself, I get pop-ups every now and then when I open the YouTube app on any device, with the app asking me to consider upgrading to a YouTube premium membership.
According to a current report from Nielsen, YouTube was the market leader for “How Americans watch TV” in March 2024, leading the pack with a market share of 9.7%, 160 basis points ahead of Netflix (NASDAQ:NFLX) with 8.1% and up 40 basis points from 9.3% in February 2024. Here is a screenshot from Nielsen’s “The Gauge” report for March 2024 showing the market shares for the different ways of watching TV and for the streaming services:
Nielsen – The Gauge March 2024 (The Nielsen Company – The Gauge March 2024)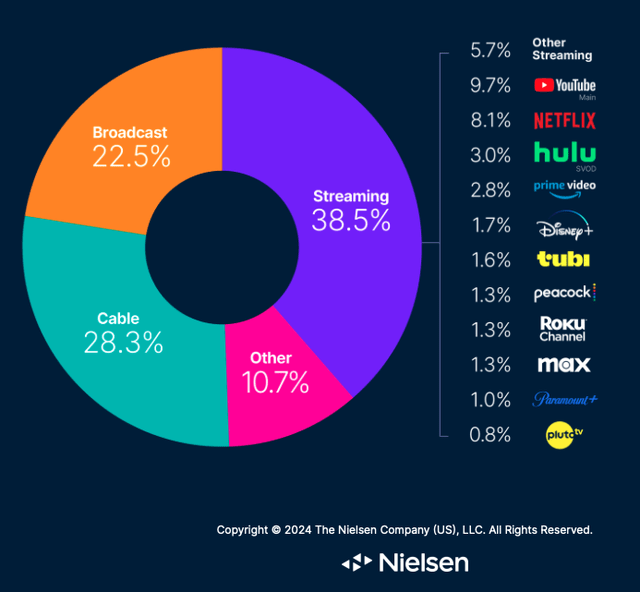
So YouTube is not only acting in a growing market (Streaming) but is simultaneously growing market share. Here is a short table showing the development of streaming market shares since December 2023, also according to Nielsen’s “The Gauge”:
| YouTube | Netflix | |
| December | 8.7% | 7.5% |
| January | 8.6% | 7.9% |
| February | 9.3% | 7.8% |
| March | 9.7% | 8.1% |
Looking at this trend, I think that YouTube might be in a good position to report very good results for Q1 24 this Thursday when GOOGL reports Q1 24 earnings.
Besides market share and financial metrics, I want to talk a bit about the uniqueness of YouTube’s business model. I will start by making some comparisons to Netflix. Here is a table showing Netflix’s Free Cash Flow (FCF) over the past few years:
Netflix Cash Flows (Netflix 10-K Filings, table by Author)
As we can see, NFLX’s cash generation before content investments is incredibly high, with NFLX generating close to $20 billion operating cash flow before content investments in 2023. On the other hand, investments in new content have also been very high. In 2020-2022, FCF has been low for NFLX because the investments into new content took up most of the cash that was generated from the subscriber base. In 2023, the FCF skyrocketed by $5.5 billion. However, $4.6 billion of this increase came from cutting back on spending for new content, CAPEX, and stock-based compensation (SBC). Now the key question will be if this is sustainable, but this isn’t the point of this article, so I will leave it at that.
The point I want to make is that because of its business model, YouTube doesn’t have to concern itself with spending on content creation at all. Sure, YouTube content creators get paid their share by being paid per view, but that is like a flat cost. The content investments are made by the creators, not by YouTube. This has two major benefits for YouTube as a business.
First of all, YouTube is capital-light in the sense that there is no need to spend on content that gets activated on the balance sheet and is then slowly written off as an amortization expense.
Secondly, YouTube can cater to the preferences of its user base on a much more detailed level than any other streaming service. There are content creators on YouTube for nearly every niche you can imagine. You will find creators focusing on tabletop games, shaving, fashion, chess, make-up, or whatever you want to see.
Corporate activities and Other Bets
I will throw the two reporting segments “Other Bets” and “Alphabet-level activities” together. Let me explain why. I will have to start with some words regarding the “Alphabet-level activities” (I will just call them “Corporate” from now on). GOOGL has been reporting losses for the “Corporate” segment for the whole last decade. This includes mainly some research, office, and extraordinary costs. Here is a short table I came up with after studying the composition of these costs as reported in the 10-K filing:
Alphabet-level activities – Loss Composition (Table by Author using date from GOOGL’s 10-K Filings)
Here we can see that when factoring out some extraordinary costs like legal fines in 2018 and 2019, hedging effects in 2021-2023, and workforce/office exit charges in 2023, the corporate segment produced losses of around $3 billion per year since 2018. These $3 billion should be for research and office costs. We can also see that in 2023, these losses increased by around $2 billion to $5 billion, which looks odd at first but is easily explainable. As of 2023, Google DeepMind (Google Research + Deepmind) is no longer reported under “Other Bets” but under the corporate segment, adding to the research costs that are not allocated to a single segment. So we can conclude that Google Deepmind produced somewhere around $2 billion of losses in 2023. For the sake of completion, here is the statement regarding this reporting change made by GOOGL in the 10-K filing:
Reflecting DeepMind’s increasing collaboration with Google Services, Google Cloud, and Other Bets, beginning in the first quarter of 2023 DeepMind is reported as part of Alphabet-level activities instead of within Other Bets.
Source: GOOGL 2023 10-K – Note 15
This reporting change has another effect that might be confusing if you don’t know about it. Here is a chart showing “Other Bets” operating losses over the past decade (in $ billion):
Other Bets Operating Losses since 2014 (Chart by Author using date from GOOGL’s 10-K Filings)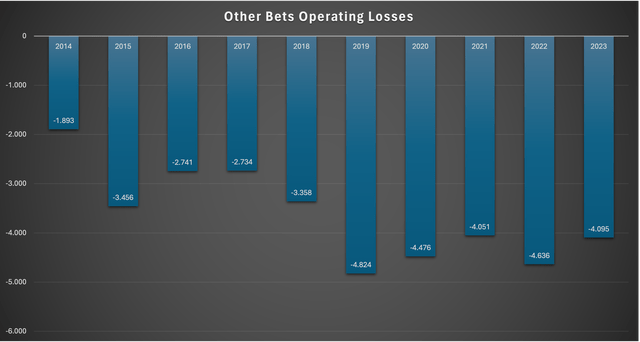
Looking at this chart (and the reported numbers), you might think that “Other Bets” improved in 2023 by cutting operating losses by around $600 million. Taking into account that $2 billion of losses for Google DeepMind were just shifted to the corporate segment, “Other Bets” operating losses for 2023 should have been around $6 billion on a comparable basis.
In conclusion, it looks like we can expect somewhere around $5-6 billion losses per year for the corporate segment (unallocated research and office costs) and somewhere around $4-5 billion losses for the “Other Bets” segment.
Google Search and Monetization Metrics
Now let’s turn to the bread and butter, cash-cow segments for GOOGL which are “Google Search & other” and “Google Network”. First of all, how does GOOGL earn money here?
Let’s start with Google Network. The Google Network is a network of websites that participate in AdMob, AdSense, and Google Ad Manager. The network includes every place where ads can be shown, including Google Maps, Google Shopping, external partner websites, YouTube or Gmail. Google earns money by what they call impressions, meaning impressions displayed to users at any place inside the network. The most commonly seen impressions are probably these little ad banners you can see when visiting one of the network’s partner websites (if you don’t use a working ad blocker). The main revenue drivers are the number of impressions and the cost-per-impression. GOOGL reports both metrics every year. Here is a chart showing how these two metrics evolved:
Google Network Monetization Metrics (Chart by Author – Data from GOOGL 10-K Filings)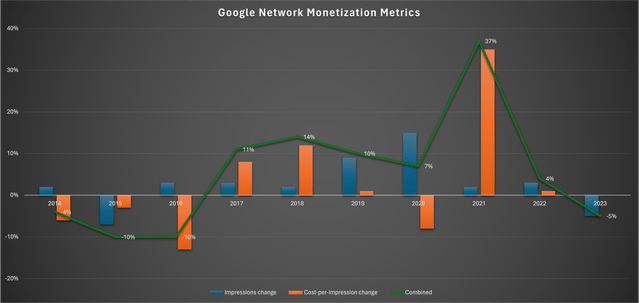
Here we can see that Google Network’s revenue decreased in 2014-2016, then grew nicely until 2020 before exploding in 2021 during the pandemic. In the last two years combined, revenue has been flat for this segment. That is understandable, though, because the huge increase in 2021 was a result of hefty price increases. So Google Network is currently consolidating versus very tough comps from 2021. Since price increases don’t seem to be the norm, my best guess is that this segment will grow somewhere in the mid to high single digits.
Now let’s turn to the “Google Search & other” segment. This includes revenues from Gmail, Google Maps, and Google Play, but I won’t bother with them because the bulk of the revenues and profits stems from the main search revenue. Here is what GOOGL says about this segment:
Google Search & other, which includes revenues generated on Google search properties (including revenues from traffic generated by search distribution partners who use Google.com as their default search in browsers, toolbars, etc.), and other Google-owned and operated properties like Gmail, Google Maps, and Google Play.
Source: GOOGL 2023 10-K Filing; Item 7
Revenue generated on Google search properties refers to revenue for clicks. Just like for Google Network, GOOGL reports the two main monetization metrics for Google Search: (1) Paid clicks change and (2) Cost-per-click change. Here is a chart showing the cost-per-click change over the past decade:
Google Search: Cost-per click change since 2014 (Chart by Author – Data from GOOGL 10-K Filings)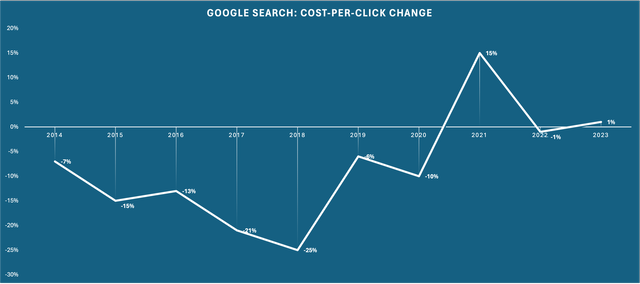
Here we can clearly that excluding 2021, GOOGL hasn’t been hiking prices in the past. On the contrary, costs-per-click have been decreasing every year until 2020. Only in more recent years, GOOGL hiked prices (2021) or made an effort to keep costs-per-click stable (2022+2023).
The other part of the equation, the change in the number of paid clicks, looks like this:
Google Search: Paid Clicks change since 2014 (Chart by Author – Data from GOOGL 10-K Filings)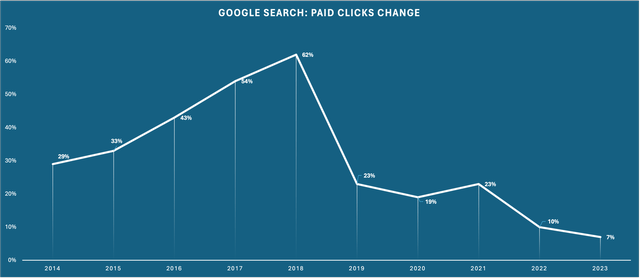
Now we can see what is going on here. In the years before 2019, a time when the number of paid clicks increased rapidly, GOOGL didn’t see any need to increase prices and opted to let costs-per-click decrease. That was fine as long as the number of clicks grew at a high rate. When the growth in paid clicks started to drastically decrease in 2019, costs-per-click decreased at a slower rate at first, before staying flat or increasing later on. More importantly, the growth in paid clicks has trended down dramatically over the last two years, down to high single digits in 2023.
For the sake of completion, here is a combined chart showing the combination of both metrics:
Google Search: Combined Chart since 2014 (Chart by Author – Data from GOOGL 10-K Filings)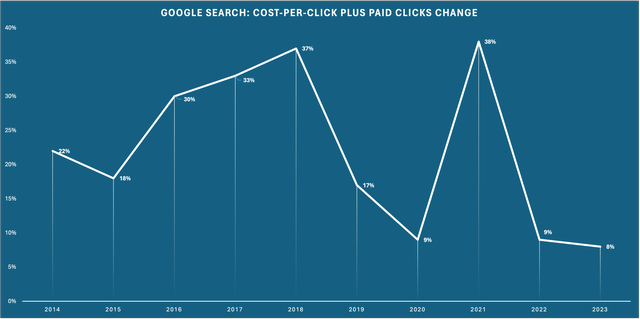
Here we can see that Google Search only grew in the high-single digits over the past two years, a growth rate that is much lower than we have seen in the past. The future development of costs-per-click and the number of paid clicks will be one of the most important metrics to look out for.
AI Opportunities
In the days of AI and ChatGPT, it is impossible to write about GOOGL without mentioning the opportunities AI offers. In February 2023, GOOGL first launched Bard, a conversational AI service. Later that year, in December, GOOGL introduced Gemini, GOOGL’s own AI model.
The key question is: In what ways can GOOGL implement AI into its offerings to drive growth and deliver helpful solutions to customers? This should be looked at from different angles.
(1) Search
Seeing how AI will be able to complement GOOGL’s search offerings is the hardest question to answer, in my opinion. GOOGL CEO Sundar Pichai made some comments regarding search & AI in the Q4 23 earnings call, which I would categorize as vague at best:
We’re already experimenting with Gemini in search where it’s making our Search Generative Experience or SGE faster for users. We have seen a 40% reduction in latency in English in the U.S. I’m happy with what we are seeing in the earliest days of SGE, it’s available through search labs in seven languages. By applying generative AI to Search, we are able to serve a wider range of information needs and answer new types of questions, including those that benefit from multiple perspectives.
People are finding it particularly useful for more complex questions like comparisons or longer queries. It’s also helpful in areas where people are looking for deeper understanding such as education or even gift ideas. We are improving satisfaction including answers for more conversational and intricate queries.
Source: GOOGL CEO Sundar Pichai on Q4 23 Earnings Call
The main benefits of AI in search seem to be (1) making search faster and (2) making search results more useful for more complex questions/problems.
Here are some more comments from GOOGL’s Chief Business Officer Philipp Schindler:
As we shared last quarter, ads will continue to play an important role in the new search experience, and we’ll continue to experiment with new formats native to SGE. SGE is creating new opportunities for us to improve commercial journeys for people by showing relevant ads alongside search results. We’ve also found that people are finding ads either above or below the AI-powered overview helpful as they provide useful options for people to take action and connect with businesses.
Source: Philipp Schindler on Q4 23 Earnings Call
This also doesn’t convince me, to be honest. Fellow SA Analyst Damir Tokic made some great points regarding how AI and Google Search might have a hard time finding out how to work together in this article. In the article, he makes the point that AI does nothing else than answer any given question. If search were designed in a way that the AI search results were influenced by ads, it wouldn’t be AI search anymore because the results wouldn’t be genuine. If I search for “best product X”, the AI should show me the best product X according to all the data it has. If it shows me ads on the first three results and the best product on position four, what is the point of AI in search? This will be a question that GOOGL needs to answer.
On the other hand, Google Search is so deeply ingrained in people’s lives that I can’t see how it is going away anytime soon. To be frank, AI capabilities while searching are not relevant for the normal consumer. I also think that optimizing the already great search results achieved by GOOGL’s search engine by using AI should already be good enough for GOOGL.
(2) Subscriptions
Subscriptions and the Cloud are the main two beneficiaries of GOOGL’s AI capabilities. Besides Microsoft’s ChatGPT Amazon-backed Anthropic’s Claude 3, GOOGL’s Gemini is one of the three major AI models currently out there. Gemini subscriptions might pose a huge opportunity to sell very profitable subscription services besides YouTube Music/Premium to a wider range of customers, especially business customers. A prime example of this is the possibility of a deal between Apple (NASDAQ:AAPL) and GOOGL as reported by Bloomberg on March 18, 2024. According to this news report, Apple is considering using GOOGL’s Gemini AI engine in their iPhones. This would be a great deal for GOOGL in two ways: (1) It would drive very profitable subscription revenue and more importantly (2) it would establish GOOGL’s Gemini AI as a serious competitor in the AI model race which would be very important after the initial problems with Gemini AI (see this Reuters article for context).
(3) Cloud
With businesses integrating AI into their offerings, for example, optimized AI search on a company’s website (like shopping for clothes and chatting with Bard about what you are looking for), GOOGL has a second way of earning money besides selling the AI model itself as a subscription. Google Cloud can offer the complementary cloud infrastructure to make sure these businesses can integrate AI and run these operations smoothly, preferably on Google Cloud servers, of course.
Besides offerings for companies that try to engage with customers, GOOGL also launched Duet AI (now called Gemini for Google Workspace) in May 2023. Duet AI helps customers to optimize workflows by using AI. Some examples include generating bespoke images by writing what you want to generate, or auto-generating job descriptions for job offerings. According to GOOGL, thousands of companies (including Singapore Post, Uber, and Woolworth) and more than a million trusted testers have already used Duet AI.
Financials
Now let’s take a look at GOOGL financial performance over the past decade. I will start, as I always do, by taking a look at GOOGL’s balance sheet. It is no secret that GOOGL has one of the strongest balance sheets in the world. Here is a screenshot from the FY2023 10-K filing showing the balance sheet as of December 31, 2023:
GOOGL Balance Sheet December 31, 2023 (GOOGL 10-K Filing)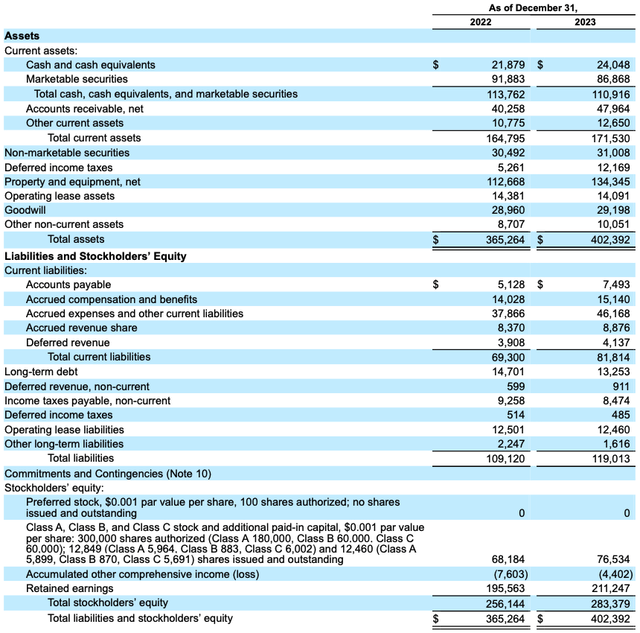
GOOGL has $283.4 billion of equity and a net cash position of $97.6 billion, calculated by subtracting the $13.2 billion long-term debt from the $110.9 billion cash and equivalents + marketable securities. There is nothing more to say here. The balance sheet is as strong as it can be.
Now let’s turn to the income statement. I will only look at revenue, operating profit, and net profit here. Here is a chart showing these three metrics over the past decade:
GOOGL Main Financial Metrics since 2014 (Chart by Author – Data from GOOGL 10-K Filings)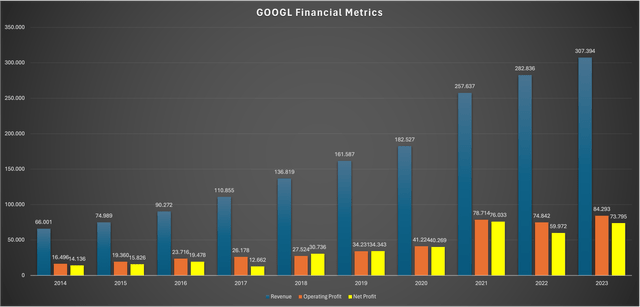
GOOGL managed to grow revenue every single year over the past ten years while profit growth, especially net profit growth, was a bit lumpier. The volatility of net profit growth is attributable to unrealized gains/losses on GOOGL’s marketable and non-marketable equity securities, so it isn’t a problem here. We can also see that while GOOGL managed to grow at a steady pace until 2020, profits exploded in 2021 (due to the price hike in Google Search I addressed earlier) and have consolidated at this high level since then. The fact that GOOGL was able to push through with such a price hike (and nearly doubling profits from 2020 to 2021) and managed to keep profits at this “new normal” level is a testament to the strength of GOOGL’s market position.
Operating profit margins have remained nearly flat, although with quite some volatility:
GOOGL Operating Profit Margins (Chart by Author – Date from GOOGL 10-K Filings)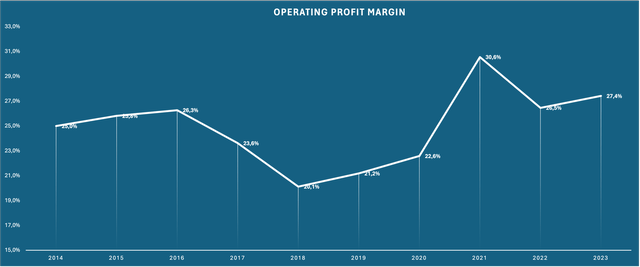
After dropping severely in 2018 and 2019 due to some fines and legal settlement costs ($5.1 billion in 2018 and $2.3 billion in 2019), operating margins reached a new high of 30% in 2021, the year of the Google Search price hike, and have decreased to the level we have seen in the past, the mid-twenty percentage range. With increasing profitability for Google Cloud on the horizon, I think consolidated operating margins could reach 30% again. So a little bit of margin expansion should be in the cards.
Turning to the Cash Flow Statement, let me remind you that I calculate Free Cash Flow (FCF) as Operating Cash Flow – CAPEX – SBC (stock-based compensation). Here is a table showing how I calculated FCF:
GOOGL Free Cash Flow since 2014 (Table by Author – Date from GOOGL 10-K Filings)
One thing that always bothered me was the very high amount of SBC and its growth rate. Looking at the numbers, it isn’t as bad as I always thought it was. While operating cash flows grew at a CAGR of 18% since 2014, SBC grew slightly faster, at 20.2%. With CAPEX growing way slower than both metrics, at 12.7% CAGR, overall FCF grew faster than operating cash flow, at a CAGR of 22.2%. These growth rates are a bit distorted because the cash conversion ratio (FCF divided by net profit) increased from 2014 to 2023, but it doesn’t matter. I don’t want to lose myself in tiny details while looking at cash flow growth rates in the 20% range.
Lastly, I want to take a look at returns on capital. I will use my own formula for return on capital employed (ROCE), which is Capital Employed divided by EBIT or operating profit, with Capital Employed calculated as long-term liabilities + shareholders’ equity – net cash if there is any. While there are many ways to calculate returns on capital, this one usually yields accurate results. We already looked at operating profits, so let’s take a look at the development of GOOGL’s capital employed over the last few years:
| Year | 2017 | 2018 | 2019 | 2020 | 2021 | 2022 | 2023 |
| Long-term Liabilities | 20,610 | 20,544 | 29,246 | 40,238 | 43,379 | 39,820 | 37,199 |
| + Equity | 152,502 | 177,628 | 201,442 | 222,544 | 251,635 | 256,144 | 283,379 |
| – Net Cash | 97,902 | 105,128 | 115,121 | 122,762 | 124,832 | 99,061 | 97,663 |
| = Capital Employed | 75,210 | 93,044 | 115,567 | 140,020 | 170,182 | 196,903 | 222,915 |
As we can see, GOOGL managed to grow its Capital Employed at a high rate. Since 2014, the growth CAGR for GOOGL’s Capital Employed come in at 17.7%. As long as we see good growth in Capital Employed while ROCE remains steady or expands, we are looking at a true compounder. This company consistently creates value for shareholders. Here is a chart showing GOOGL’s ROCE since 2014:
GOOGL ROCE since 2014 (Chart by Author – Data from GOOGL’s 10-K Filings)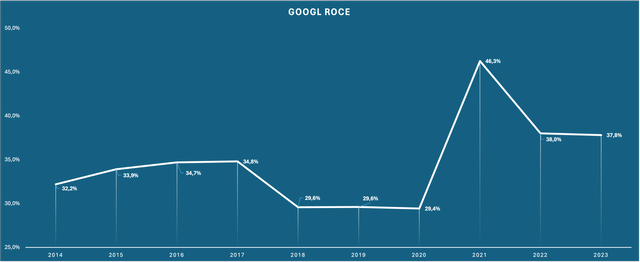
When you have to cut the Y axis at 25% in a ROCE chart, you know that you are looking at an outstanding business. GOOGL managed to keep the ROCE above 29% every year of the past decade, another testament to its strong moat and market position.
High returns on capital coupled with high growth in the capital base aka Capital Employed should always lead to outsized returns, and as you probably know, they did:
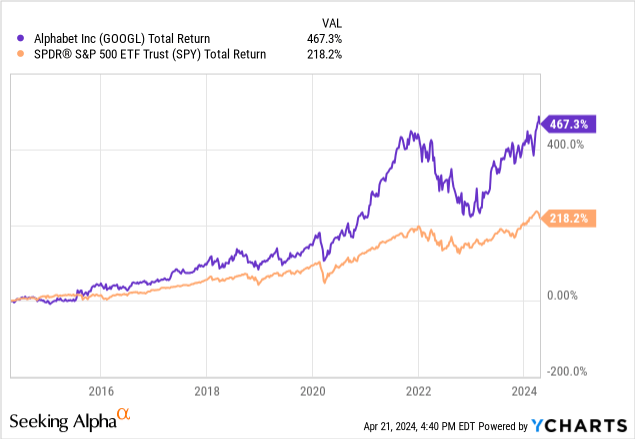
GOOGL easily outperformed the S&P 500 over the last ten years.
Q1 24 Estimates
GOOGL will report earnings for Q1 2024 on Thursday, April 25, 2024, after the market closes. According to Seeking Alpha, Analyst estimates look for 12.8% growth in revenue to $78.7 billion and EPS of $1.50 (28.4% YoY growth). Operating profit is expected to come in at $22.1 billion, up 27% from $17.4 billion in Q1 23.
I am not a big fan of short-term (quarterly) thinking though, so even when GOOGL manages to beat or miss these estimates, I don’t think it is that big of a deal. In my opinion, there are two major things to look out for in the upcoming report:
- As I highlighted earlier, YouTube has gained quite some market share in the first few months of this year. It will be interesting to see if this already translates into elevated growth in YouTube ads or the subscription segment.
- Even more importantly, trends in paid clicks and costs-per-click for Google Search will be very important. In Q1 23, the number of paid clicks increased by 8% while the costs-per-click decreased by 7%.
Valuation
With 12.6 billion shares outstanding as of the most recent Q4 23 report and a share price of $157.53 as I am writing this, GOOGL’s current market capitalization amounts to $1.985 trillion. After deducting the net cash position of $97.6 billion, the Enterprise Value (EV) stands at $1.888 trillion.
FY2023 net earnings came in at $73.8 billion, so GOOGL is currently trading at around 25x earnings. With Analyst estimates for FY2024 standing at net earnings of $84.8 billion, GOOGL is trading at just 22x forward earnings. This looks cheap for a company with a track record of GOOGL.
For valuation purposes, I usually use an approach I call “normalized FCF” where I try to gauge how much FCF a company will generate in a “normal” year. In the case of GOOGL, the cumulative FCF over the last ten years came in at $257 billion, while the cumulative net earnings amounted to $377 billion. By dividing 257/377, we arrive at the normalized cash conversion rate of 68.1%. So in a “normal” year, GOOGL should be able to turn 68.1% of net profits into FCF.
If we use this number on the aforementioned net earnings forecast for FY2024, FCF should come in somewhere around $57.8 billion for 2024, putting GOOGL at a forward FCF yield of just 3.05%. This looks much more expensive than the 22x forward earnings valuation. The poor cash conversion ratio might be one of the main reasons why GOOGL is trading at a discount to major tech peers like Microsoft and Amazon when looking at price-to-earnings ratios.
Since GOOGL acts in several markets that are supposed to experience double-digit growth well into the future (digital advertising, cloud, streaming, AI), I have little doubt that GOOGL will be able to deliver at least low double-digit returns for the foreseeable future. So it all comes down to valuation. For companies that act in several markets, it is very hard to predict any sort of growth rate. So I will just use a reverse DCF valuation to see what is currently priced into the share price.
I will use $4.81 (3.05% forward FCF yield x $157.53 share price) as the starting FCF per share. As I always do, I will use a discount rate of 10%. Here is the result:
GOOGL Reverse DCF Valuation (moneychimp.com)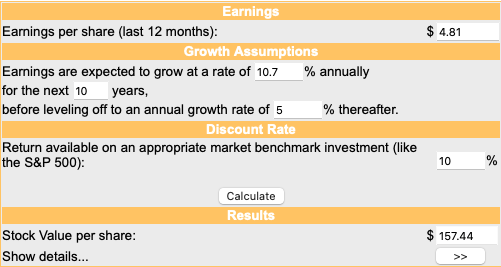
At the current price, GOOGL seems to be priced for 10.7% CAGR FCF per share growth, followed by 5% growth into perpetuity. This would be a growth at half the rate that we have seen in the past. However, even if GOOGL is a bit overvalued, it should still be buy-worthy for long-term investors due to its strong market position. This position should not be taken for granted, though, which leads me to the risks section.
Risks
There are several risks for GOOGL and I want to go over them separately.
(1) Dependability on Search
This is the major risk for GOOGL. Since GOOGL has an incredibly high market share in search, any kind of disruption of GOOGL’s search business could cause serious trouble for GOOGL. And I am not talking about erasing like a third of profits, but rather erasing nearly all of GOOGL’s profits. What GOOGL calls “Google Services” generated $96 billion operating profit in 2023 while consolidated operating profit amounted to $84 billion (Other Bets and Corporate activities generated an operating loss of $13 billion in 2023). Assuming YouTube and subscriptions made up somewhere around $20 billion of Google Services’ operating profit, a disruption of GOOGL’s bread-and-butter search business could erase nearly 100% of the bottom line. In that scenario, GOOGL would be worth only a fraction of today’s valuation. In the era of AI, this kind of disruption seems at least more likely than in the past. However, there is a reason why “to google” has become a commonly used verb. It is a testament to Google Search’s market position and how engrained it already is in the minds of the consumers. Still, the possibility of disruption is there and it would be disastrous for GOOGL.
(2) The AI race
As I have written earlier, GOOGL’s Gemini is one of the three major AI models besides ChatGPT and Anthropic’s Claude 3. The opportunities in the AI space are vast but the risk that Gemini won’t come out as a sizable beneficiary is still there. Especially the initial problems with Gemini AI (like showing a black pope) were a promotional disaster for GOOGL. If Gemini starts to severely lag behind its competitors, GOOGL’s share price could take a hit from it. With the share price being up by 50% over the past year, some AI profits already seem to be priced in.
(3) Regulation
With a large company that has a market position like GOOGL, regulation and anti-monopoly probes (coupled with regular fines) are a constant risk. As I have shown earlier, GOOGL already had to pay fines of $7.4 billion combined in 2018 and 2019. With AI becoming more common in the future, I can see a possibility of such fines coming back again, and at a higher price.
Regulators also regularly raise concerns over GOOGL’s business practices. Some examples include this press release from the Justice Department (DOJ), where the DOJ announced that it is suing GOOGL for monopolizing digital advertising technologies, or this report that Japan’s anti-monopoly body accuses GOOGL of undermining fair competition in the advertising market.
Regulatory risks will remain with the company for the foreseeable future. As a potential investor, you will have to live with that fact.
Conclusion
Summing it all up:
- Google Cloud is operating in a market that is experiencing very high-growth rates. Future margin expansion should lead to operating profits for Google Cloud to grow at a very high rate for the next few years.
- The YouTube franchise is, in my opinion, the underestimated gem of GOOGL. Recent reports have shown that YouTube has gained market share in streaming throughout Q1 24, setting it up for a very good report in Thursday’s earnings release.
- Google Search is the bread-and-butter cash cow business for GOOGL. The main metrics to look out for in the upcoming earnings report will be the number of paid clicks and the cost-per-click.
- GOOGL has several opportunities in the AI space, especially selling Gemini AI subscriptions and supplementary cloud infrastructure products.
- The balance sheet is as strong as it can be and the historical financial performance was excellent.
- The major risk is the possibility of disruption in the search business.
With my reverse DCF valuation leaving me to assume that GOOGL is still reasonably valued, even after the big run the stock has seen over the past year, I initiate coverage on GOOGL with a “buy” rating.
Analyst’s Disclosure: I/we have a beneficial long position in the shares of GOOGL, MSFT either through stock ownership, options, or other derivatives. I wrote this article myself, and it expresses my own opinions. I am not receiving compensation for it (other than from Seeking Alpha). I have no business relationship with any company whose stock is mentioned in this article.
Disclaimer: Any material in this article should not be relied on as a formal investment recommendation. Never buy a stock without doing your own thorough research.
Seeking Alpha’s Disclosure: Past performance is no guarantee of future results. No recommendation or advice is being given as to whether any investment is suitable for a particular investor. Any views or opinions expressed above may not reflect those of Seeking Alpha as a whole. Seeking Alpha is not a licensed securities dealer, broker or US investment adviser or investment bank. Our analysts are third party authors that include both professional investors and individual investors who may not be licensed or certified by any institute or regulatory body.
