Summary:
- Alphabet’s recent earnings have been impressive, with per-share earnings of $2.12 and revenue of $88.27 billion, surpassing expectations and showing strong growth.
- The Google Cloud segment excelled, generating $11.35 billion in revenue, outpacing Microsoft and Amazon, driven by AI product expansion.
- Alphabet’s forward P/E ratio of 20.79x is the lowest among MAG-7 companies, making it an attractive investment despite recent pullbacks.
- I maintain a “buy” rating for Alphabet, noting potential for further bearish movement but highlighting its strong position within the MAG-7 cohort.
Carlos Alvarez
When I last covered Alphabet, Inc. (NASDAQ:GOOG) (NASDAQ:GOOGL) (NEOE:GOOG:CA) on October 14th, 2024, with my article “Google: Buy Before Earnings”, the stock was trying to recover from an extended period of long-term losses (-45.05%) that stretched from highs printed on November 2021 and lasted until the lows of $83.45 were seen in October 2022. In the article, I explained why I believed Alphabet was likely to outperform in its upcoming quarterly earnings report and positive results would likely propel the stock to new near-term highs. In the periods that followed, the company has released major earnings updates and the stock actually managed to rally to new record highs of $193.31 on July 8th, 2024. Now that we have seen fairly substantial rallies in Alphabet share prices, I think that my initial thesis has played-out as expected at that the most prudent strategy is to reduce my outlook (by one level) to a “buy” rating while still maintaining my broader bullish outlook for this stock into the end of this year.
GOOG: Long-Term Price Trend History (Income Generator via TradingView)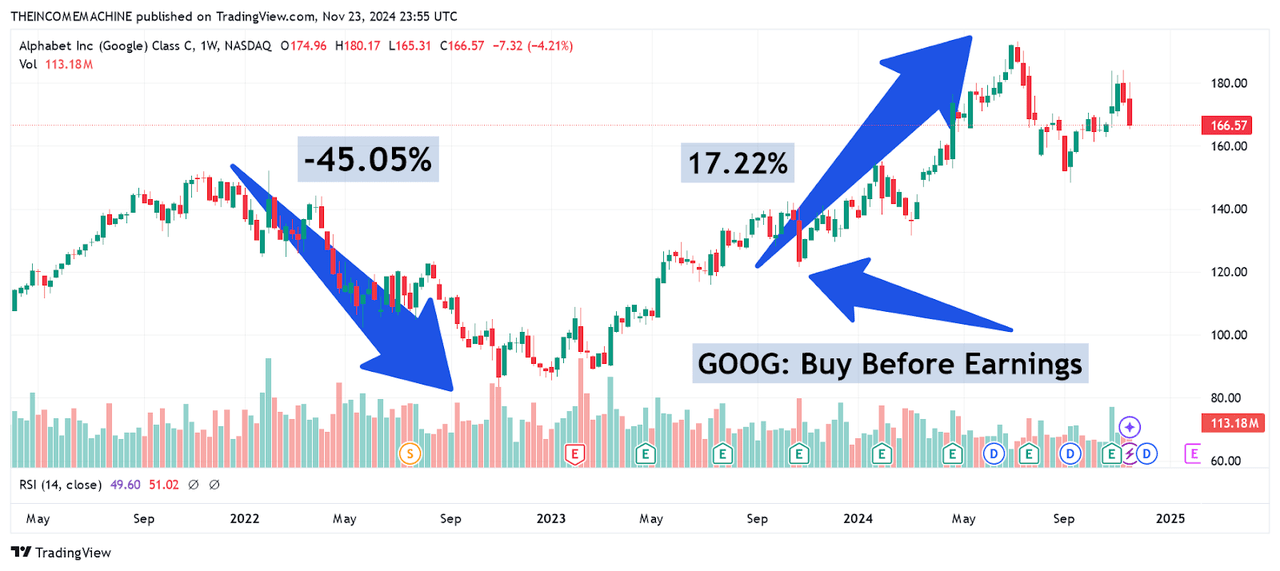
In large part, the crux of my broader bullish thesis stems from the fact that I believe recent earnings figures have demonstrated that Alphabet still looks like one of the most attractive MAG-7 companies in the market today. In the third-quarter period, Alphabet generated per-share earnings of $2.12 and this surpassed consensus by a wide margin (nearly 14.6%) while indicating sizable annualized growth rates of over 36.77%. Top-line figures were also fairly impressive ($88.27 billion), beating expectations by more than 2.28% and indicating annualized gains of 15%. Overall, this rate of revenue growth was an improvement relative to the growth rate that was posted in Q3 2023.
Alphabet: Q3 2024 Earnings Figures (Alphabet: Q3 2024 Earnings Presentation)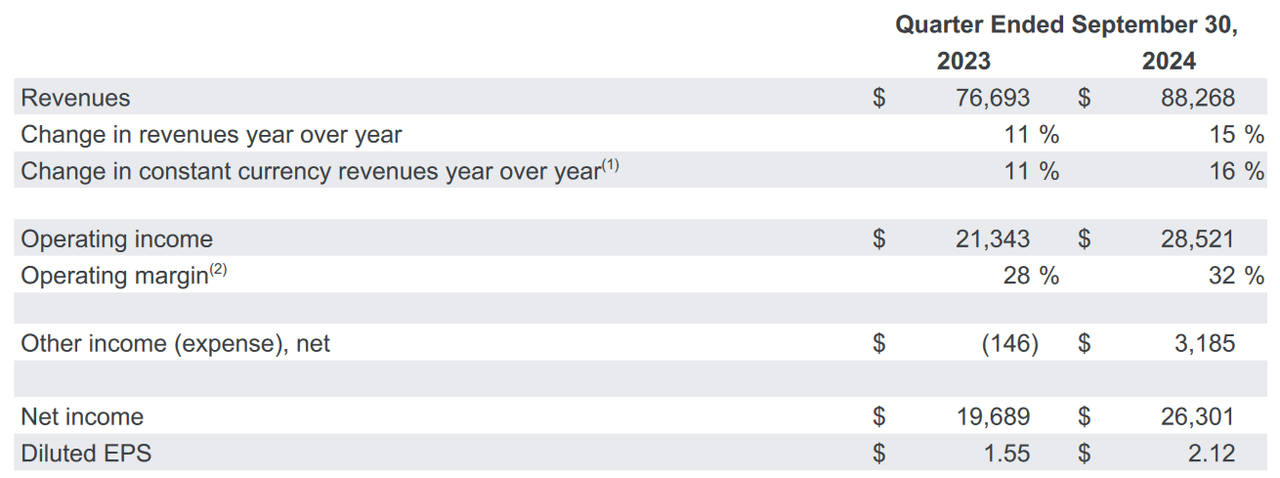
However, the real standout performance of the quarter could be seen in the Google Cloud segment, which generated $11.35 billion in revenue during the period. On the surface, this figure might seem inconsequential because this only surpassed consensus estimates by 4.3%. But this figure represents growth rates of 34.96% for the segment, and it also surpassed the Q3 cloud segment revenues that were generated by both Microsoft Corp. (MSFT) at 33% and Amazon.com, Inc. (AMZN) at just 12%.
Alphabet: Q3 2024 Earnings Figures (Alphabet: Q3 2024 Earnings Presentation)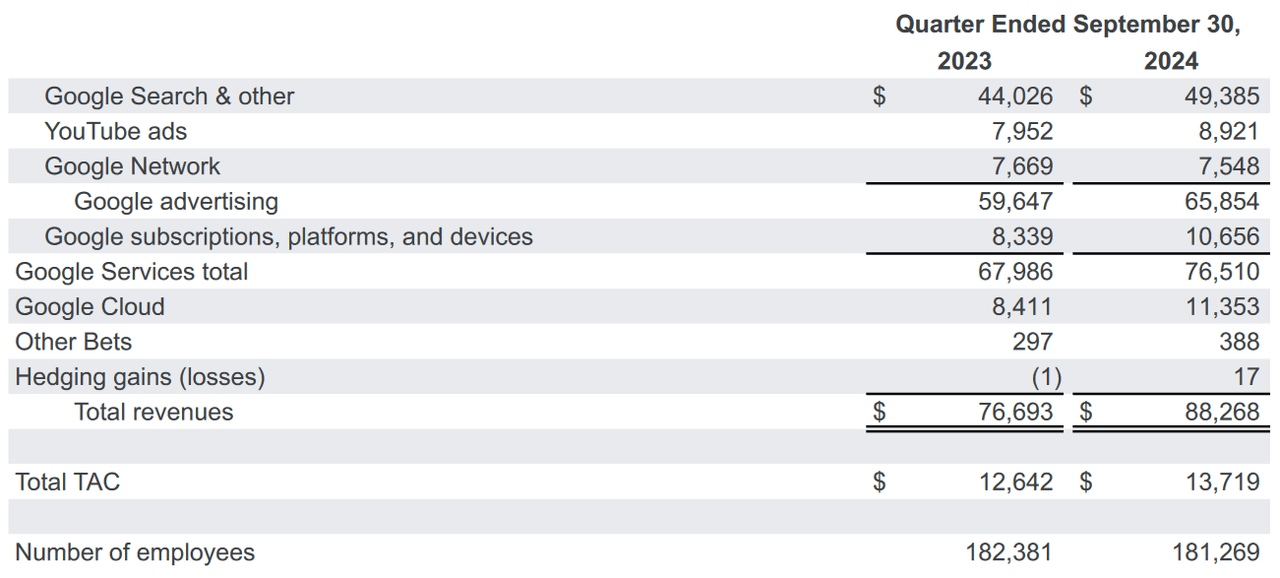
In large part, Alphabet’s market-beating cloud performances stemmed from Alphabet’s emerging focus on expanding the availability of artificial intelligence products, subscriptions, and services to enterprise clients. However, the most substantial driver of revenue growth for the period can be found in Alphabet’s search segment, which produced revenues of $49.4 billion and exhibited annualized growth rates of 12.3%. Larger revenue figures were seen in the advertising segment ($65.9 billion). However, the annualized rate of growth in this segment was seen at just 10.39% (which is weaker than the growth rate that was seen during the prior quarter).
Alphabet: Q3 2024 Earnings Figures (Alphabet: Q3 2024 Earnings Presentation)
Going forward, I think this segment will be a key area to watch because the issue of whether Google search will be able to maintain its best-in-class position in the years ahead remains quite questionable. For more than 20 years, Google search has been the obvious leader in search engines, but we are starting to see viable competitors within the artificial intelligence space. Key examples can be found in ChatGPT from OpenAI and the Meta A.I. offerings from Meta Platforms, Inc. (META) and these entities might prove to create major risks to the market share that has been commanded by Google search as this part of the market continues to change and evolve.
Alphabet: Comparative Forward Price to Earnings Metrics (YCharts)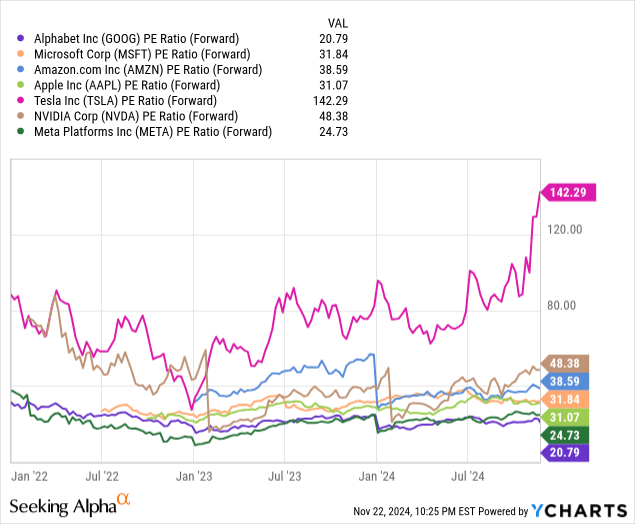
Data by YCharts
Given that Alphabet’s cloud growth easily surpassed the quarterly performances of two other MAG-7 companies, I think it is important to assess the comparative forward valuations of the stocks that are found within this grouping. Alphabet’s forward price-earnings ratio of 20.79x has remained relatively stable for the majority of 2024 and this current valuation is holding well below all of the company’s MAG-7 counterparts. Meta Platforms represents the next cheapest option (with a forward price earnings ratio of 24.73x) but the forward valuations really leap upward from there. Apple Inc. (AAPL) currently trades at 31.07x forward earnings and Microsoft is now seen at somewhat similar levels (31.84x). Amazon has a metric of 38.59x while NVIDIA Corp. (NVDA) has a metric of 48.38x. Perhaps not surprisingly, the most expensive stock here is Tesla, Inc. (TSLA), which is trading with an elevated forward price-earnings ratio of 142.29x.
Alphabet: Comparative Forward Price to Sales Metrics (YCharts)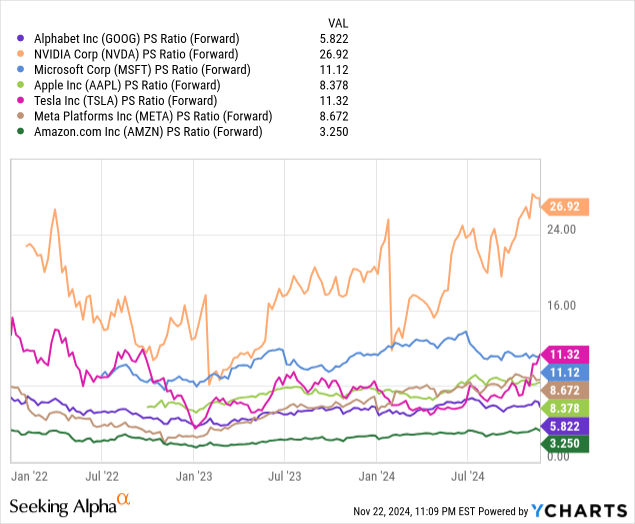
Data by YCharts
Looking at these comparisons a bit differently, we can see that Alphabet is currently trading with a forward price-sales ratio that is slightly less favorable (at 5.822x). Using this metric, we are able to find a company trading at a lower valuation in Amazon (with a ratio of 3.25x). However, once again, the rest of the group is trading at more elevated levels, with Apple showing a forward price-sales ratio of 8.378x and Meta Platforms now seen at 8.672x. Stocks trading with more elevated valuations can be found in Microsoft at 11.12x and Tesla at 11.69x. In this case, Nvidia is actually the most expensive stock in the grouping at 26.92x.
GOOG: Critical Price Failure Near Long-Term Resistance Levels (Income Generator via TradingView)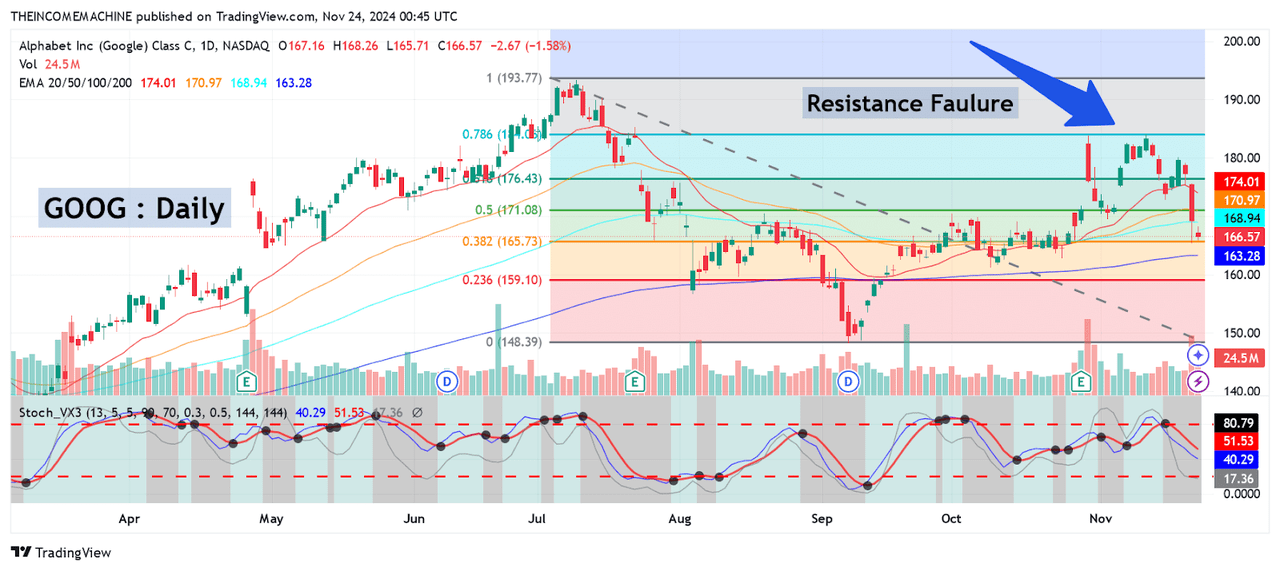
For all of these reasons, I still think that Alphabet stock is extremely well positioned within the broader MAG-7 cohort. However, all investors know that stock rallies do not last forever and pullbacks following trend movements into all-time highs are eventually inevitable. In the chart history shown above, I think there is relatively clear evidence that one of these stock pullbacks is currently taking place in Alphabet stock. Specifically, we can look at the stock’s all-time highs of $193.31 and then extend the following trend wave movement into the September 9th, 2024 lows of $148.20. If we do this, we can see that the stock has failed at critical resistance zones near the 78.6% Fibonacci retracement of the aforementioned price movement, which is located near $184.05. As this occurred, indicator readings in the daily stochastic index rolled out of overbought territory and bearish trading volumes began to spike above near-term averages.
Ultimately, all of this price action has created a strong double-top resistance zone just above $184 and this is the type of price structure that has the potential to limit gains for the stock near-term. In order for me to revise my current outlook even further (and reduce my stance to a “sell” rating), I would need to see the stock break below the aforementioned September 9th lows ($148.20). Essentially, this could accelerate potential for downside momentum and target the next major historical support zone (which is found near the March 4th, 2024 lows of $131.55). Unless (or until) this scenario actually develops, I will maintain my current long position and reduce my overall outlook to a simple “buy” rating based on the fact that I believe recent pullbacks from the all-time highs still have the potential to extend further in the bearish direction.
Analyst’s Disclosure: I/we have a beneficial long position in the shares of GOOG, NVDA, META either through stock ownership, options, or other derivatives. I wrote this article myself, and it expresses my own opinions. I am not receiving compensation for it (other than from Seeking Alpha). I have no business relationship with any company whose stock is mentioned in this article.
Seeking Alpha’s Disclosure: Past performance is no guarantee of future results. No recommendation or advice is being given as to whether any investment is suitable for a particular investor. Any views or opinions expressed above may not reflect those of Seeking Alpha as a whole. Seeking Alpha is not a licensed securities dealer, broker or US investment adviser or investment bank. Our analysts are third party authors that include both professional investors and individual investors who may not be licensed or certified by any institute or regulatory body.
