Summary:
- Alphabet Inc. reported strong financial results for Q4 2023 and full year 2023, with a 13% YoY increase in revenues to $86.31 billion.
- Google services remained the dominant source of revenue, with $76.311 billion in Q4 2023, while Google Cloud showed strong improvement, with $9.192 billion in revenue.
- The stock price is approaching the key level and a breakout will initiate the strong surge.
Jacob Wackerhausen
Alphabet Inc. (NASDAQ:GOOG)(NASDAQ:GOOGL) reported strong financial growth in Q4 and full year 2023 which sets the stage for future growth in coming years. This strong growth is observed using the quarterly and yearly revenues, operating income, operating margin and net income. Alphabet is continuously involved in AI development and is poised to further increase the financial growth in coming years. This article continues the discussion of the previous article and provides latest financial and technical developments in the market. The stock price is currently showing strength at the key level and breakout above this level will initiate another strong price surge. The yearly and quarterly charts show strong bullish momentum and indicate high probability of potential breakout from key level.
Recap
The previous article discussed the financial growth of Alphabet using the Q2 2023 earnings and the company’s technological advancements. The strong profitability was observed by strong growth in revenue and net income, which highlighted the company’s strength to tackle future challenges. Alphabet has stepped towards the AI advancements such as the development of Bard and Google Lens. The continuous advancements in AI and potential to maintain market leadership highlight strategic approach toward AI. These continuous advancements and strong financial growth were evident in the technical analysis using the monthly chart, which showed parabolic increase in prices.
As per the monthly chart, strong support was held in 2022 at the wedge support and price surged higher toward record highs. The weekly chart also supported the bullish outlook of monthly chart and showed the inverted head and shoulders with the head at $83.34 and shoulders at $101.88 and $115.35 with the inside weekly candle which further strengthened the bullish outlook. The target of this bullish momentum was identified as the record high of $151.55 by using the falling wedge pattern.
Sustained Profitability and Revenue Growth
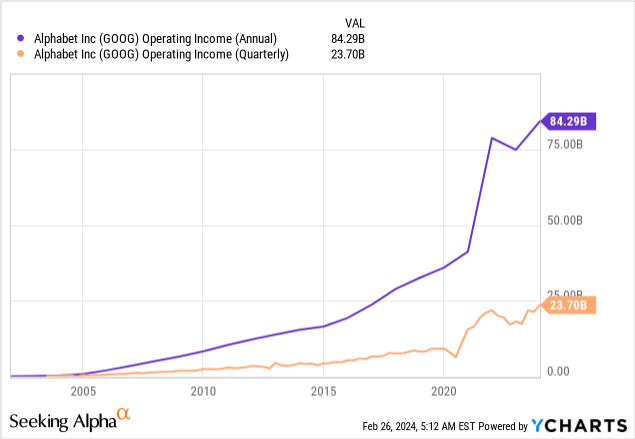
Alphabet reported strong financial results for Q4 2023 with 13% year-over-year increase in revenues to $86.31 billion. This strong performance was also reflected in the full year 2023 with total revenues of $307.39 billion, which shows 9% increment from 2022. The operating income for Q4 2023 also increased to $23.70 billion which resulted in significant increase in the operating margin to 27% which reflects the company’s ability to manage the operations. The operating income for full year 2023 also showed strong improvement with the operating income of $84.29 billion. The chart below shows the yearly and quarterly operating income, which is consistently increasing and highlights sustained improvement in the company’s profitability.
The chart below shows that the biggest source of revenue generation for Alphabet is Google Search and Others which has generated 55.6% of revenue for Q4 2023. The total revenue for Google Search and Others was $48.02 billion. This is followed by the Subscription, Platform & Devices, YouTube ads, Google Network which contributed 12.5%, 10.7% and 9.7% to the total revenue of Alphabet. Google Search, YouTube ads and Network lie within Google Advertising which contributed to 75.9% to the total revenue of $65.52 billion. This data presents the pivotal role of Google advertising in driving Alphabet’s financial performance in the future. Google services revenue, which is comprised of Google advertising, subscriptions, platforms, and devices, increased by 12.5% to $76.31 billion.
Percentage of Revenue in Google Segments (Data from Alphabet)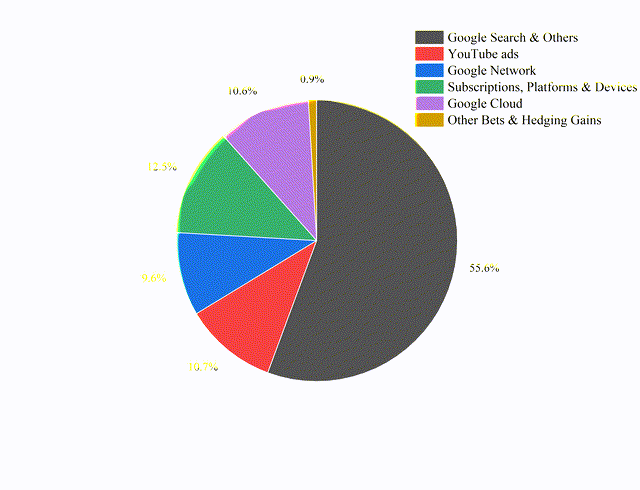
The major segments of Google operations are Google Services and Google Cloud, whereby the major source of income is from Google Services. It is observed from the Q4 2023 earnings that the operating income of Google Services increased by 32.18%. The operating income for Q4 2023 was $26.73 billion, as compared to the $20.22 billion in Q4 2022. On the other hand, the operating income for the Google Cloud segment was strong with $864 million as compared to the loss of ($186) million in the previous year’s quarter. This segment is growing at a faster pace as the operating income for 2023 has been strong for all quarters. The Q1 2023, Q2 2023, and Q3 2023 reported the operating income of $191 million, $395 million and $266 million, respectively, as compared to the significant loss in 2022. The strong operating income in the Cloud segment indicates that this segment is growing at a faster pace and opens future opportunities.
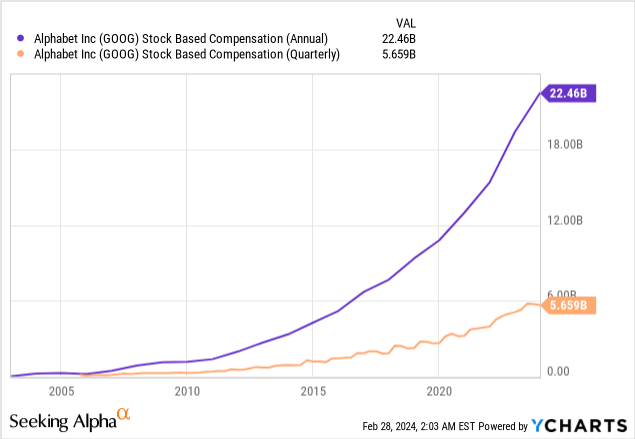
Moreover, Alphabet reported a drop in total number of employees from 190,234 to 182,502 in response to the company’s announcement in January 2023 to reduce the workforce. This led to the exit charges of $1.2 billion for Q4 2023. This move is part of strategic plan to improve efficiency in response to evolving market conditions. Despite the reduction in workforce, the stock-based compensation has been increasing consistently, as shown in the chart below. The stock-based compensation for Q4 2023 was increased by 10.96% to $5.659 billion. The consistent increase in stock-based compensation highlights Alphabet’s focus on rewarding and retaining key talent for strategic development and innovation. This strategy shows the optimization of productivity by reallocating resources to key roles and enhances shareholder value.
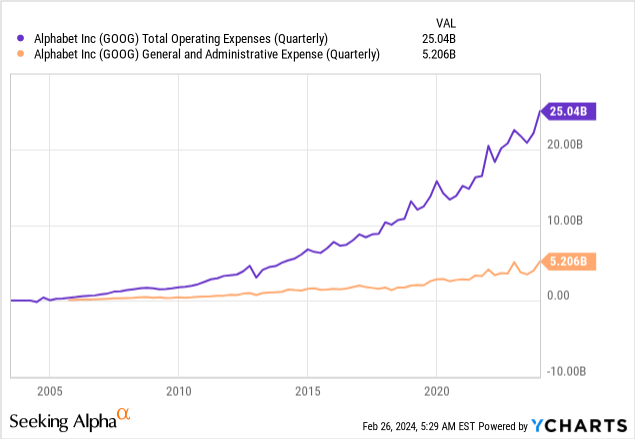
These charges may increase expenses for Google in the short term, but have a positive impact on long-term growth. The chart below presents the positive trend in operating expenses, general and administrative expenses and research and development expenses. The total operating expenses and general and administrative expenses have increased to $25.04 billion and $12.93 billion, respectively. On the other hand, the research and development expenses also show positive trend. The steady increment in research and development expenses indicates the company’s investment in the development of ongoing technology to benefit from future trends. The strong growth in services and cloud revenues and strategic reduction in the workforce position the company for long-term profitability.
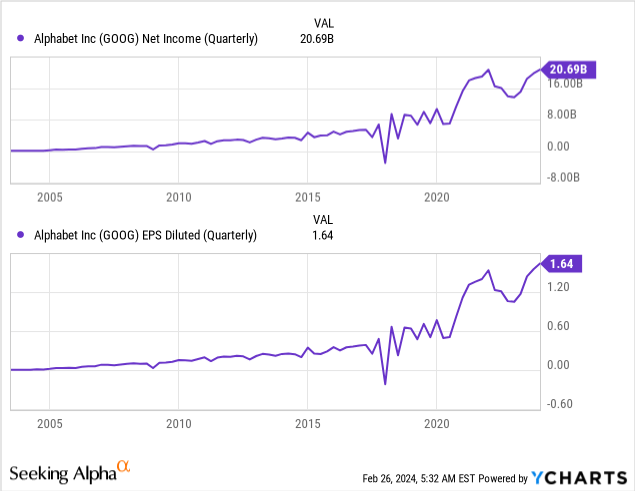
Despite the increment in total expenses, Alphabet showed strong growth in net income for Q4 2023 as shown in the chart below. The net income for Q4 2023 was $20.69 billion, as compared to $13.62 billion in Q4 2022. This strong growth was also reflected in the diluted earnings per share, which hit the record of $1.64. This strong growth in net income was also impacted by the decrease of the depreciation expenses to $983 billion for Q4 2023 and $3.9 billion for full year due to the extension of the lives of servers and network equipment.
Alphabet Growth Catalysts and Future Expectations
The significant growth catalyst for Alphabet is the AI development and expansion, which may impact the revenue streams and provide strong financial growth in future. The recent content licensing agreement with Reddit worth around $60 million is strategic move that allows Alphabet to access large data to train AI models. This partnership highlights the strategic approach to navigate copyright issues and the inflow of valuable data for AI training.
On the other hand, the release of Gemini 1.5 further shows the commitment to leverage AI innovations. On the other hand, Google faced significant backlash after the release of Gemini 1.5 for perceived biases in AI’s output. These issues resulted in short-term uncertainty in the Google market, which led to short-term price corrections. Despite the challenges, Google has been responding to users’ feedback, which enhances the user’s trust. Moreover, this situation offers an opportunity for Google to fix the recent issues and potentially avoid these mistakes in the future, which may strengthen its brand reputation over time.
The introduction of Ultra 1.0 outperforms human experts on MMLU benchmark and supports the knowledge and problem-solving abilities in 57 subjects. This platform can serve as a personal tutor to help students and businesses with content strategy or plans. Alphabet also launched the Circle to Search feature which enables to select images, text and videos naturally. As per the latest earnings results, Alphabet’s CEO expressed optimistic outlook for the company due to the growing demand for AI investments.
Moreover, Alphabet is aimed to expand the supply chain to India, which lays the strong foundation for revenue growth. This strategic expansion diversifies the company’s global footprint and position for revenue growth to meet the strong consumer demand.
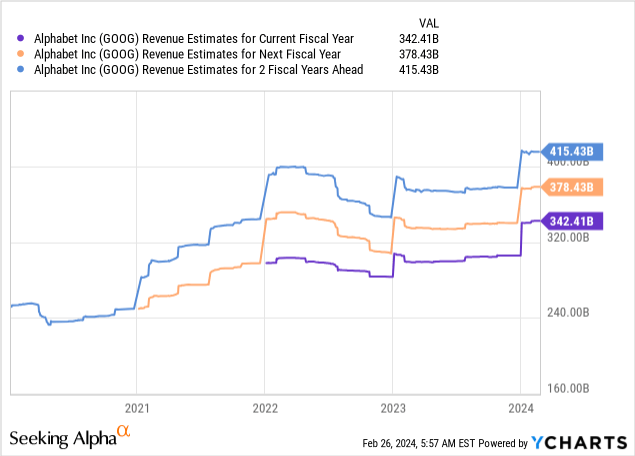
Due to strong financial performance and growth expectations, Alphabet expects strong revenue streams in coming years, as shown in the chart below. The yearly revenue for 2024, 2025 and 2026 are estimated to be $342.41 billion, $378.43 billion and $415.43 billion respectively. This is followed by strong earnings per share estimates of $6.766 and $7.815 for 2024 and 2025 respectively. These strong financial projections indicate the company’s strong future prospects.
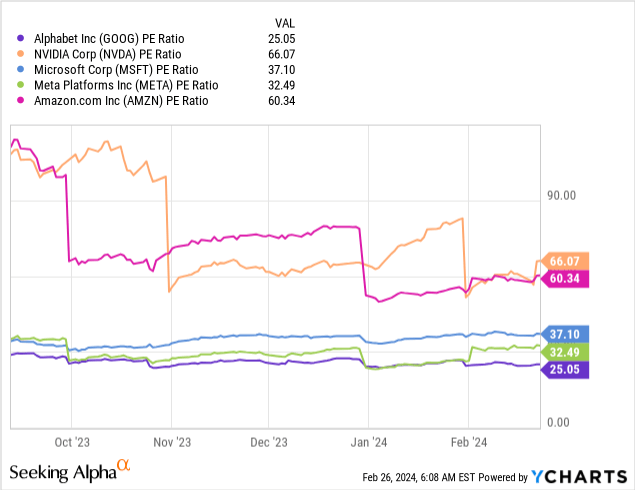
Despite strong financial growth and expectations, the company trades just 25.05 times earnings, which is lowest as compared to its peers, as shown in the chart below. Amazon (AMZN), Meta Platforms (META), Microsoft (MSFT) and NVIDIA (NVDA) have P/E ratios of 60.34, 32.49, 37.10 and 66.07. Some of these companies are growing faster than Alphabet, but the reasonable valuation of Alphabet positions it for strong growth potential.
Long-Term Technical Trends & Key Level
The yearly chart for Alphabet also shows strong growth potential in terms of technical trends. It is observed that the stock price is consistently trading higher without having strong corrections. The only correction in Alphabet was observed in 2022 which was started after reaching a record high of $152.10. The primary reason for this correction was the strong price surge in 2021 which was initiated due to the significant growth in advertising revenue. This growth was driven by the recovery of the global economy after Covid-19 pandemic and higher consumer activity. Moreover, Google Cloud also showed strong performance with the advancements in AI innovations which fuelled the growth of Alphabet.
Google Yearly Chart (stockcharts.com)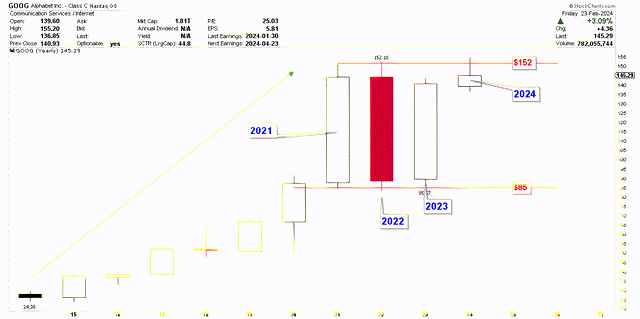
This price correction was supported at $85.57 and recovered 100% to break the record high levels in 2024. The strong candle for 2021 followed by the red candle in 2022 and then the strong recovery in 2023 highlights the strong price volatility between $85 and $152. However, the long-term trend remains positive and price is looking for higher levels in 2024. The red candle for year 2022 appears to stabilize the strong growth of 2021, which is a positive sign and indicates that any break above $152 could initiate a strong price move to much higher levels.
To further understand the price correction of 2022 and strong recovery of 2023, the quarterly chart below shows the important historical levels which are important for investors. The price peak was observed in Q1 2022 at the price level of $152.10 and the correction was quick with the same acceleration as the 2021 move. The consecutive negative quarterly candles for 2022 marked a bottom at $83.45 in Q4 2022 followed by strong recovery in Q1 2023.
The price bottom of Q4 2022 was held at the 50% Fibonacci retracement, which is stretched from the 2015 low of $24.31 to the record high of $152.10. After confirming this bottom, the stock price continuously rallied in the subsequent quarters of 2023. This strong recovery indicates that the price action for Alphabet is strong, as the price was unable to break 61.8% Fibonacci retracement and instead came back to the same level seen in 2021 highs. It is interesting to observe that the stock price attempted to breach the record highs of 2021 at $152.10 in Q1 2024 after having consistently positive quarterly candles. However, the stock price has not yet closed the quarter above this level, which indicates that the breakout has not yet been confirmed. This level has become the key level for the next strong market surge. A quarterly close above this key level will initiate the next move to higher levels, and the breakout is highly likely due to the emergence of bullish price action.
Google Quarterly Chart (stockcharts.com)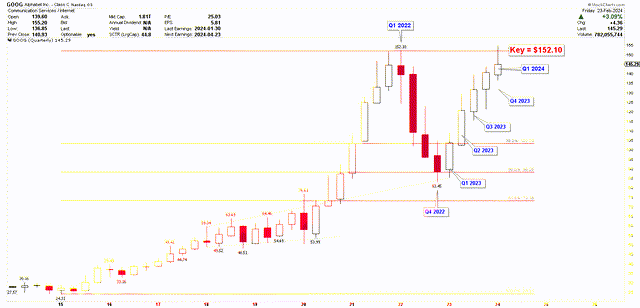
This key level was identified as the target of falling wedge as discussed in the previous article. The achievement of price target may initiate a slight correction, but due to the parabolic move, which was discussed previously, the continuation of upward momentum is likely. Therefore, investors can consider buying the stock even if the price is currently expensive. Based on the financial growth and technical price action, the stock price is likely to grow significantly from these levels, ignoring the major corrections.
Risks
Alphabet depends on Google services for revenue generation, which highlights potential vulnerabilities to the technological advancements. Since a big portion of revenue for Google is generated from advertising sector, this exposes the company to sector-specific risks such as changes in advertising spending, regulatory changes and strong competition from technology companies. Moreover, strategic workforce reduction can incur short term financial burdens and also introduce risks to sustain the growth momentum. The rapid advancements in AI innovation also introduce risks tied to rapid pace of technological change. Due to rapid technological change, there is need to continuously invest in new technologies to remain competitive in the market, which may divert focus from the core areas. On the other hand, the expansion of supply chain in India also introduces geopolitical tension, which may impact operational efficiency.
The controversy surrounding Gemini highlights the challenging situation for the brand. This situation may have a negative impact on Google as the reputable source of information. However, the company’s financial standing and growth potential indicate long-term growth. Any short-term drop in the stock price may be a strong buy for the long term. From a technical perspective, the stock price has not broken the key level of $152.10 which indicates the possibility of correction. Since the period from 2021 to 2023 shows strong volatility, the correction may be deeper than expected. A break below $103.34 will negate the bullish outlook and initiate further decline.
Bottom Line
In conclusion, Alphabet has shown strong financial and operational performance in Q4 and full year of 2023 which is evidenced by the strong performance in its key segments. The company’s strategic expansion in India, workforce optimization and significant development in AI lay the foundation for further growth in the competitive market. On the other hand, technical analysis further shows long-term growth in yearly and quarterly charts. The strong fluctuations between $85 and $152 observed during 2021 and 2023 in the yearly charts highlight the strong volatility. However, the stock price is expected to break this fluctuation in Q1 2024 at the key level of $152. This breakout may further open the investment opportunities for investors to benefit from the long-term growth. On the other hand, the consecutive strong quarterly candle in the quarterly chart highlights the probability of this breakout. Therefore, investors can consider accumulating long positions at the current levels to benefit from the upcoming swing in the market.
Analyst’s Disclosure: I/we have no stock, option or similar derivative position in any of the companies mentioned, and no plans to initiate any such positions within the next 72 hours. I wrote this article myself, and it expresses my own opinions. I am not receiving compensation for it (other than from Seeking Alpha). I have no business relationship with any company whose stock is mentioned in this article.
Seeking Alpha’s Disclosure: Past performance is no guarantee of future results. No recommendation or advice is being given as to whether any investment is suitable for a particular investor. Any views or opinions expressed above may not reflect those of Seeking Alpha as a whole. Seeking Alpha is not a licensed securities dealer, broker or US investment adviser or investment bank. Our analysts are third party authors that include both professional investors and individual investors who may not be licensed or certified by any institute or regulatory body.
